VOLUME 40, ARTICLE 8, PAGES 185
,
218
PUBLISHED 25 JANUARY 2019
https://www.demographic-research.org/Volumes/Vol40/8/ DOI: 10.4054/DemRes.2019.40.8
Research Article
Persistent joblessness and fertility intentions
Annalisa Busetta
Daria Mendola
Daniele Vignoli
© 2019 Annalisa Busetta, Daria Mendola & Daniele Vignoli.
This open-access work is published under the terms of the Creative Commons Attribution 3.0 Germany (CC BY 3.0 DE), which permits use, reproduction, and distribution in any medium, provided the original author(s) and source are given credit.
1 Introduction 186
2 Background 188
2.1 Persistent joblessness 188
2.2 Looking at couples, not individuals 190
2.3 The Italian setting 190
3 PJI: Persistent Joblessness Index 192
3.1 The rationale of the index 192
3.2 Operationalisation of the index 194
4 Analytical strategy 197
4.1 Data and sample selection 197
4.2 Computing the PJI 198
4.3 Model specification 200
5 Results 201
5.1 Fertility intentions differentials by persistent joblessness 201
5.2 Robustness checks 203
6 Conclusions 204
7 Acknowledgments 206
References 208
Persistent joblessness and fertility intentions
Annalisa Busetta1
Daria Mendola1
Daniele Vignoli2
Abstract
BACKGROUND
The vast majority of demographic studies have approached and operationalised the notion of economic uncertainty using snapshot indicators. Hence, the complexity and diversity of individuals’ employment careers were largely hidden. We posit that the persistence of joblessness – that is, repeated and close spells of joblessness – represents a crucial marker of economic uncertainty in the realm of fertility (intention) research.
OBJECTIVE
We aim to explore the association between persistent joblessness of both members of the couple and women’s fertility intentions among those who entered employment at least once in the last five years.
METHODS
We develop an index of persistent joblessness that simultaneously considers individual and contextual labour market conditions. It accounts for the severity of the experience of joblessness, the chances that an individual will escape joblessness, the alleviating effects of the years spent in continuous employment, and the recentness of any joblessness experience. This index is operationalized for Italy by consulting the 2009 Family and Social Subjects Survey. We verify the association between the index and women’s fertility intentions among Italian couples, net of a series of confounders.
RESULTS
Our findings show that the higher the level of persistent joblessness, the lower a woman’s fertility intentions. Within couples, we found a gendered association between joblessness and fertility intentions: His joblessness, more than hers, seems to play the decisive role in inhibiting a woman’s fertility intentions.
1 Università degli Studi di Palermo, Italy.
CONTRIBUTION
We corroborated that joblessness inhibits positive fertility intentions and facilitates negative fertility intentions. But we also added that these associations are much more pronounced when joblessness has been persistent. Disregarding the role of persistence in joblessness, scholars might underestimate the importance of individual-risk factors linked to labour market biographies in fertility planning. We additionally illustrated that accounting for regional labour market dynamics, thus placing one’s own level of persistence in joblessness in context, is pivotal.
1. Introduction
Growing uncertainty has become an intrinsic characteristic of contemporary globalised societies. This is the result of deregulation, internationalisation, and delocalisation (Blossfeld, Mills, and Bernardi 2006; Blossfeld and Hofmeister 2006). In a broad sense, uncertainty refers to clarity, or the lack thereof, about future economic activities (Bloom 2014; Moore 2016). The notion of economic uncertainty has become increasingly popular among social scientists, not least in the realm of fertility research (Kreyenfeld, Andersson, and Pailhé 2012). A number of macro-level studies have shown that adverse economic conditions, measured by national unemployment rates, are associated with a decline in total fertility (Adserà 2011; Goldstein et al. 2013; Sobotka, Skirbekk, and Philipov 2011; Matysiak, Sobotka, and Vignoli 2018). There is the idea, certainly, that macro-level economic downturns translate into micro-level perceptions of economic uncertainty, and that this discourages people from forming a family and having children. However, evidence at the individual level sends conflicting messages. This is true for both the relationship between economic uncertainty and fertility intentions (Vignoli, Rinesi, and Mussino 2013; Modena, Rondinelli, and Sabatini 2013; Fahlén and Oláh 2015; Hanappi et al. 2017) and the relationship between economic uncertainty and fertility behaviour (Andersson 2000; Gutiérrez-Domènech 2008; Kreyenfeld and Andersson 2014; Matysiak and Vignoli 2013; Vignoli, Drefahl, and De Santis 2012).
by the use of event history techniques, with employment characteristics included as a time-varying covariate in first- and higher-order birth models. Hence, virtually all demographic studies have approached the notion of economic uncertainty using snapshot indicators. Snapshot indicators seem, however, to fail in capturing what is intrinsically a dynamic process. After all, showing that economic uncertainty at ‘time one’ has an effect on fertility at ‘time two’ says nothing about whether ‘time’ really matters, and little about dynamic or sequential processes: complex processes require longer time-windows to be properly observed.
The foundation of our research stems from the life-course perspective: labour market positions and transitions today depend on previous circumstances leading to patterns of path dependency. This requires an emphasis on the accumulation of advantage and disadvantage across the life course (Dannefer 2003). Building on this life-course principle and relying on a series of recent papers (Özcan, Mayer, and Luedicke 2010; Pailhé and Solaz 2012; Ciganda 2015), we posit that the persistence of joblessness in employment career – that is, repeated spells of joblessness over the number of employment spells – represents a crucial marker of economic uncertainty in the context of fertility research. On this backdrop, we developed a Persistent Joblessness Index (hereafter ‘PJI’) that is derived from the literature on chronic poverty (Mendola, Busetta, and Milito 2011; Mendola and Busetta 2012). This is based, in turn, on the idea that the closer in time (and the harder) the years spent in a detrimental situation, the more they contribute to an increase in overall persistence assessment. The index simultaneously considers the intensity of the experiences of joblessness for each year, the alleviating effects of the years spent in continuous employment, the recentness of the joblessness episodes, and the chances that an individual will escape joblessness.
We concentrate on the association between persistent and repeated joblessness among partners who displayed some attachment to the labour market, namely those who entered employment at least once in the last five years, and fertility intentions. Fertility intentions follow the desire for childbearing and anticipate concrete behaviour by reflecting the combined effect of desired fertility and situational constraints (Thomson and Brandreth 1995; Testa and Grilli 2006). We investigate the relationship between PJI and women’s short-term fertility intentions, considering the employment trajectories of both partners. We then compare the results with a more standard approach that considers the relationship between the partners’ gender-specific employment status at the interview date and the woman’s fertility intentions. We outline the approach by studying a sample of couples selected from the Italian Multipurpose Household Survey on Family and Social Subjects, conducted by the Italian National Institute of Statistics (Istat) in November 2009.
not, neither whether s/he is searching for a job. Nonetheless, couple level joblessness has been suggested to matter more than couple level unemployment to study the consequences of a couple economic fragile situation on fertility (Härkönen 2011). Many of the social and demographic consequences of economic inactivity are the same as those of unemployment because the key point is whether a person is employed or not, not whether a person is looking for work. For this reason, many studies have expanded their focus to joblessness instead of unemployment in the strict sense of ‘searching for a job’ (Wilson 1987; OECD 1998; Clasen et al. 2006; Faggio and Nickell 2003). We follow this strand of research by looking at patterns of joblessness among partners with some interest to be in the labour market.
The contribution of this paper is threefold. First, we attempt to give a better conceptualisation and operationalisation of economic uncertainty that takes into account individuals’ employment trajectory over their actual labour market status by proposing an index of persistent joblessness. Second, our effort to incorporate gender-specific joblessness trajectories within couples in explaining childbearing intentions is a ‘plus,’ as most works of fertility (intention) research tend to focus on either men or women in isolation. Third, we provide evidence that the higher the level of persistence in joblessness, the lower a woman’s fertility intentions. Within couples, we found a gendered association between persistent joblessness and fertility intentions: his persistent joblessness – even if not so common among dual-earner couples – more than hers, seems to play the decisive role in inhibiting a woman’s fertility intentions.
2. Background
2.1 Persistent joblessness
substitution effect might only dominate when unemployment is perceived as being truly temporary. Research suggests that displacement is associated with subsequent unemployment, long-term earning losses, and lower job quality as well as lower levels of subjective well-being (Brand 2015). Yet, a “persistent spell of unemployment may have a large negative effect on household permanent income,” and people may prefer to postpone childbearing because of a “threat effect” (Adserà 2011: 6). In a similar vein, Schmitt (2012) suggested the existence of a “scare effect” of long-term unemployment in Germany. Spending a long period of time outside the labour market decreases an individual’s chances of re-entering, as the individual’s skills tend to deteriorate, and she may fall into a kind of “unemployment trap” (Adserà 2004). Evidence from social psychology and labour economics supports this view (see, for a review, Bossert and D’Ambrosio 2013). In sum, the income effect of unemployment dominates the substitution effect – for women – when the non-employment experience is more frequent and longer.
This paper focuses on the effects of persistent joblessness among labour market attached individuals on fertility intentions. As favoured by Härkönen (2011), many of the consequences of economic inactivity are the same as those of unemployment. For instance, since economically inactive people do not earn wages, they have a higher-than-average risk of poverty. Economic inactivity itself can strengthen this risk, because many social benefit programmes require job search as a requirement for entitlement. The focus on joblessness rather than unemployment – thus also including homemakers, discouraged workers, and others conditions – can be found in several other works as well (Clasen et al. 2006; Faggio and Nickell 2003; Wilson 1987).
2.2 Looking at couples, not individuals
In this paper, we aim to test a model of fertility intentions that incorporates persistent joblessness as faced by both partners. The mechanisms linking economics (particularly employment conditions) and fertility are complex, especially if considered at the couple, and not just at the individual, level. Oppenheimer (2003) argues that the deterioration of men’s position in the labour market and the declining ability of men to serve as the family’s sole breadwinner have been key factors in the postponement of marriage and fertility. According to Kreyenfeld (2010), the effect of a woman’s employment on childbearing varies according to whether she is expected to be a caregiver or a financial provider after having a child. Women’s employment may represent a greater barrier to childbearing in settings characterised by a pronounced insider-outsider divide, and in countries that lack social safety nets and family policies aimed at helping women to combine motherhood and paid work (Matysiak and Vignoli 2008).
In fertility intentions research, dual-earner couples generally display higher expected fertility because their combined employment resources make it easier to plan for childbirth (Heiland, Prskawetz, and Sanderson 2008; Régnier-Loilier and Vignoli 2011). Toulemon and Testa (2005) showed how in France fertility reached a peak when the two partners are working but drops sharply when one partner is unemployed. In this paper, we look at the gender-specific effects of partners’ persistent joblessness. Our effort to incorporate the gender-specific influences of economic uncertainty in explaining women’s childbearing intentions constitutes a key insight of this study.
2.3 The Italian setting
the de-regulation of ‘non-standard’ employment concentrated almost exclusively among labour market entrants, leaving behind ‘standard’ employment and existing work contracts largely unchanged. Researchers have suggested that these characteristics of southern European labour markets, with their high levels of youth unemployment and precarious patterns of employment entry, anticipated the fertility decline of these countries during the 1990s (McDonald 2000; Adserà 2004). Within this context, Italy constitutes an interesting case study.
In the country, the first step in the ‘gender revolution’ (Goldscheider, Bernhardt, and Lappegård 2015) is currently underway. Labour force participation for women aged 15 to 64 years increased from about 30% in 1979 to 54% in 2014 (International Labor Organization 2015). In terms of gender equality, at the macro level, Italy scores quite badly, with a 2014 Gender Gap Index of 0.69 (World Economic Forum 2014). This places Italy 69th in world equality rankings and a long way off not only from the Nordic European countries, which score more than 0.80, but also from most other Western and European countries (ibid). In all, the standard of living of the household depends on the market performance of the man because women in dual-earner couples are still the main caregivers and men continue to act primarily as household income providers (Aassve et al. 2015).
The state of the economy and the business cycle is likely to offer an important additional element. For instance, Hofmann, Kreyenfeld, and Uhlendorff (2017) found that the impact of a job loss is greater in an economic downturn than in an economic upturn. The global economic recession that started in autumn 2007 in the United States has hit almost all European countries, with many experiencing plummeting GDP and rising unemployment for most of the period 2008–2013. We use data recorded in November 2009, a year after the arrival of the Great Recession in Italy. The effects of the recession on family life – and on total fertility – start to register in 2010 (Istat 2016). This is because the Italian family served as a buffer in mitigating the very first years of the spread of the recession among individuals; then, when family savings also started to be affected, the recession seeped into poverty rates and fertility outcomes too (Sabbadini 2013). Hence, we believe that the link between persistent joblessness and individuals’ fertility plans are only slightly affected by the onset of the ‘Great Recession’ in our empirical investigation.
3. PJI: Persistent Joblessness Index
3.1 The rationale of the index
A new generation of studies have explicitly incorporated information on employment trajectories at the individual level. Özcan, Meyer, and Luedicke (2010) considered both the number of unemployment episodes and the duration of each spell of unemployment as determinants in the timing of the transition to parenthood in Germany. Pailhé and Solaz (2012) included the accumulation of unemployment and non-permanent employment periods in the equation predicting fertility timing in France. The most important attempt to measure persistent employment fragilities, and then to connect this measure with fertility, was the study conducted by Ciganda (2015). He proposed a measure that incorporated the information contained in the entire education/employment trajectory of individuals, including the time spent in each state, by applying sequence analysis techniques. Such indicators proved to have more explanatory power in predicting fertility outcomes than static indicators like employment status.
With respect to Ciganda’s approach (2015), we propose an index that takes in the sequencing of the spells of job and joblessness. In addition, our index has a theoretical maximum, which allows us to assess not only performance ranking but also intensity. We also extend the existing frameworks for two additional reasons. First, past, present, and future are all involved in the fertility decision-making process. But the very recent past is most crucial: the more stable the participation in the labour market of an individual has been, the bigger the buffer stock s/he can rely on in case of an adverse future event (Bossert and D’Ambrosio 2013). Clearly, the more recent these variations are, the more vivid our memories. Hence, we consider an index that accounts for the recentness of joblessness experiences. Second, the state of the economic environment faced by individuals is likely to be an additional important element. When the demand for labour is relatively low, a non-employed person searching for a job will tend to have more difficulties finding a new job of a similar quality to that s/he had previously. More generally, the local labour market dynamic is crucial for understanding individuals’ fertility intentions; those who experience discontinuous employment in areas characterised, for instance, by positive labour market dynamics, might experience a stronger feeling of exclusion and discouragement; conversely, living in an area characterised by a negative labour market dynamic might facilitate giving up in searching for a job. The chances that individuals will find new employment are estimated considering the concomitant labour market dynamics in their area of residence.
The Persistent Joblessness Index (PJI), described in detail in section 3.2, is based on the assumption that the closer two episodes of joblessness or employment discontinuity are, the more severe their effects will be on an individual’s economic situation (cumulative negative effect). In short, assuming, as a year of ‘joblessness or discontinuous employment,’ a year in which an individual who entered at least one time in the labour market was not employed for the whole year, PJI acknowledges:
a) the severity of each spell (year) of discontinuous employment, up to its maximum, that is a year of whole joblessness (i.e., degree of within-year joblessness) in the time window of observation;
b) the time needed for recovery (i.e., the spell of continuous employment between two episodes of joblessness), based on the assumption that the longer this period is the higher the likelihood that the individual will retain or improve his or her skill level, network, and economic resources, thereby alleviating the importance of joblessness spells;
d) the chances that an individual will find new employment given the current (local) labour market dynamics.
3.2 Operationalisation of the index
Let us suppose that we have, for each individual, a numberT of consecutive and equally spaced observations about her/his employment status. The status can be dichotomised as (i) ‘continuously employed,’ assigned to individuals who are employed for all twelve months of the year (including paid leave, paid parental leave, and medical leave); and (ii) ‘discontinuously employed,’ assigned to individuals who are not employed for one or more month/s of the year (up to the whole year, i.e., purely jobless people). This information can be arranged into a time-indexed vector of lengthT. Each element of the vector can be one or zero. We use 1 to denote a year spent in discontinuous employment or totally jobless, and 0 to indicate a year spent in continuous employment. With this approach, to each individual corresponds a ‘labour profile’ (hereafter LP), that is, a time-ordered vector of binary indicators that summarise his/her employment history.
For instance, let us now considerT= 5 years, while supposing that we observe the following time-ordered employment sequence: (11010). The latter is the LP of an individual who is not continuously employed for all twelve months of the first and the second year (labour status1 in positions 1 and 2), who then experiences one year of continuous employment (labour status 0 in position 3) followed by a year of discontinuous employment (labour status 1 in position 4), and, then, the last year of continuous employment (labour status0in position5).
It is possible to assign to the same individual a second vector of lengthT, hereafter referred to as an ‘Intensity Profile’ (IP). The elements here are a time-ordered sequence of the proportions of the year (on a monthly basis) the individual did not work, measuring the intensity of the departures from a condition of continuous employment. The general element of the IP is equal to 0 when the individual spent a year in continuous employment; it equals 1 when s/he was jobless for 12 months; it assumes intermediate values according to the months of joblessness. For example, assume that the hypothetical individual introduced above had IP = (0.25, 0.5, 0, 0.75, 0); this means that s/he was jobless for three months of the first year, and for 6 months of the second year, s/he worked for 12 months of the third year (i.e., s/he was continuously employed), then s/he was jobless for 9 months of the fourth year, and s/he was again continuously employed in the fifth year.
employed in the first, second, and fourth year, S*= {1, 2, 4}. The basic idea is that the more the distance between two spells of discontinuous employment, the better the individual’s employment prospects. The idea of a cumulative negative effect is here operationalised by considering the inverse of the pairwise distances between the years an individual spends in discontinuous employment. Figure 1 illustrates the pairwise distances, which are drawn as arches with a dotted line that becomes thicker as closer two years of discontinuous employment or joblessness are.
Figure 1: Pairwise distances between two years of discontinuous employment
or joblessness
We use the inverse of these pairwise distances so that the higher the distance is, the lower the importance assigned to the episodes of discontinuous employment. The analytical formulation of the PJI is a linear combination of two elements, basically one focussing on LP and IP and the other focussing on the recentness of the spells of discontinuous employment:
PJI = α∑, ∈ ∗ + (1 − ) with i > j and 0 ≤ α ≤ 1, (1)
in which:
∂ i andj are the generic elements of set S* (given thati is greater than j) and represent the ordinal positions in the LP of the spells of ‘discontinuous employment;’
∂ dijis the difference between the positions of the years spent in non continuous
employment, that is the distance(i–j);
∂ oij is the length of the recovery spell, that is, the number of years of
continuous employment (zeros) between each couple of years of not continuous employment (i,j);
∂ wijis a weight we want to assign to each pair of not continuous employment
years. Thewijis needed as a normalised measure of the intensity (severity) of
employment occupying positionsiandjin the individual labour profile. This can be expressed, for example, by the average of the corresponding elements in the IP vectors, measuring the average proportion of jobless months in each pair of years considered;
∂ pij is the measure of the probability of being discontinuously employed (up to
purely jobless) both in yeari and in yearj.Here it is calculated as the mean of unemployment rates in each pair of years spent in discontinuous employment in a given labour status profile (hereafter ‘permanence probability’). These permanence probabilities account for the individual’s chances of finding a job whether desired and are a signal for the discouraged workers about the possibilities to re-enter the labour market. Hence, pij adds to the PJI
information that goes beyond the information on the single individual, and thus links his/her condition to that of other individuals. We believe this feeling could influence their expectations for the near future, not least in relation to fertility intentions. The introduction of pij is important for comparative
purposes, particularly when the probabilities are computed for sub-groups (e.g., by region or by sex) who are performing very differently in the labour market;
∂ re is a ‘recentness factor’ that increases the value of the PJI the more the spells of discontinuous employment or joblessness are recent (within the observed time window), giving more emphasis to the up-to-datedness of the not continuous employment experiences. This recentness factor is defined as:
= ∑j∈S*j
T(T+1)
2
, (2)
where j is the generic elements of the set S* and represents the ordinal positions in the LP of the spells of not continuous employment. The more recent the years of not continuous employment are, the higher the value of j
and hence the sum at the numerator ofre, which acts as a time discount rate. Thinking of our example of the individual with a LP = (11010), s/he has, for example,re =(1 + 2 + 4) / (5(5 + 1) / 2) = 0.47. Using a moderate weight for
re (e.g., 0.2, which implies alpha equals 0.8), it means thatre will increase the value of the first addend of PJI by 0.093.
addendum in PJI can generally assume small values, which can be excessively outdone by the value of the second addendum.
Whatever the length of the considered time span, both addends in eq. (1) span in [0,1], since their own denominators are the theoretical maximum of the numerators (see Mendola, Busetta, and Milito 2011 for a demonstration). Hence, PJI spans in [0,1]. PJI equals 1 when both LP and IP are made wholly of ones (i.e., when the individual spent all of the years purely jobless, twelve months a year). PJI equals 0 when the individual does not experience any year with discontinuous employment, which means that the LP is, consequently, made wholly of zeros and the IP as well.
For the sake of clarity, in Appendix 1 we report the passages for the computation of the PJI for a hypothetical employment trajectory.
Note that PJI can also be calculated omittingwij, oij, pijorre (or each combination
of them). Indeed, the PJI is a class of indices, which preserves its main properties in each reduced form. A Stata package, which is available upon request to the authors, implements the computation of the full class of indices.
4. Analytical strategy
4.1 Data and sample selection
For our empirical investigation, we reorganised the nationally representative retrospective data from the 2009 multipurpose household survey “Family and Social Subjects.” This survey was conducted by Istat on a sample of about 24,000 households and about 50,000 individuals of all ages. Almost uniquely for a retrospective survey, it provided complete information on partners’ employment histories, recorded on a monthly basis. The data was collected based on a two-stage sampling design. The municipalities were the primary units and the households the secondary units. The municipalities were sampled with probabilities proportional to their population size and without replacement, whereas the households were drawn with equal probabilities and without replacement. Respondents were interviewed face-to-face. The overall response rate of the survey was over 80%. Our analytical sample includes 1,772 heterosexual coresident couples in which the women were aged 25–40.3 We chose these age ranges
because the decision to have a child beyond these ages may be less influenced by employment-related considerations than by the desire to have a child at a socially accepted childbearing age (Billari et al. 2011). We excluded from our analysis men and
3 Note that the intentions to a have a child are often considered in the literature as ‘parity-progression
women not living with a partner because their childbearing intentions may not reflect a realisable plan (Neyer, Lappegård, and Vignoli 2013). We limited the sample to individuals who entered into the labour market at least once during the period 2005– 2009,4 and for whom we had complete information on their labour market position for
the same period. Note that we excluded individuals who entered the labour market after 2007, as individuals with no more than two years of employment history were not sufficiently exposed to persistent joblessness in their employment history.
Individuals’ intentions to have a child within the next three years were checked using the following question: “Do you intend to have a child in the next three years?” The four possible answers were: “definitely not,” “probably not,” “probably yes,” and “definitely yes.” The distribution of women’s fertility intention variable by age is reported in Appendix 2 (Table A-1).
4.2 Computing the PJI
The PJI of women and their partners are our explanatory variables of interest. We are especially interested in the period of eventual joblessness that is in close temporal proximity to the formulation of fertility intentions (i.e., 2005–2009). As the basis of our computations, we use the two vectors LP and IP known for both of the partners in a couple and calculated dij, wij, oij, and re as described in section 3.2. For pijwe used
yearly regional-level (i.e., NUTS 2) gendered unemployment rates (over the period 2005–2009) provided by Istat for people aged 25–34. We did so to account for the large labour market disparities within Italy (see, for instance, Busetta and Giambalvo 2014) and for the differences in men’s and women’s chances of (re-)entering the labour market.
In combining the two addenda in equation (1), we selected a value of alpha equal to 0.8, in order to not overdone the value of the ‘core’ part of the PJI. As explained below, the selection of the sample implied very low levels of persistent joblessness among men, hence an alpha lower than 0.8 would have given too much weight to the more recent episodes overdoing the persistence effect within the 5-year window.
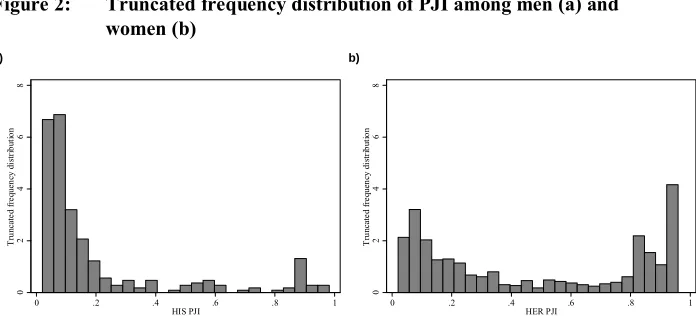
Basic descriptive statistics about PJI by age and gender are reported in Appendix 2 (Table A-2). Figure 2 shows the truncated distribution of PJI values for individuals who experienced at least one labour market transition (i.e., who entered and exited
4 In order to obtain a sequence of employment statuses on a monthly basis, we built up a sequence of
employment at least once). The distribution is bimodal, with a greater concentration around 0 (those experiencing low employment discontinuity during the last five years) and close to 1 (those experiencing a high incidence of months of joblessness).
Figure 2: Truncated frequency distribution of PJI among men (a) and
women (b)
a) b)
Table 1 provides some initial insights into the link between PJI and fertility intentions. The incidence of persistent joblessness was higher among women (46.1%) than among men (14.9%). This is probably due to the fact that our sample only includes individuals in coresident couples in Italy: male partner employment stability is often a pre-requisite for the formation of coresident couples (Vignoli, Tocchioni, and Salvini 2016), and women are characterised by relatively low labour market participation rates. Fertility intentions increase as PJI decreases: Moving from women who definitely do not intend to have a child in the next three years (whose average persistence is 57%) to those who definitely plan to have one (whose average persistence is 32%). The same patterns, with a lower intensity of persistence, work for men (from 25% to 14%).
0 2 4 6 8 T ru nc at ed fr eq ue nc y di st ri bu tio n
0 .2 .4 .6 .8 1
HIS PJI 0 2 4 6 8 T ru nc at ed fr eq ue nc y di st ri bu tio n
0 .2 .4 .6 .8 1
Table 1: Persistent joblessness (intensity and incidence) of women and men by her intentions to have a child in the next three years
Childbearing intentions
Persistent joblessness of women Joblessness of men
All Among individuals with at least one month of joblessness (PJI > 0)
All Among individuals with at least one month of joblessness (PJI > 0) Incidence
(CI 95%)
Intensity
(Mean) St.dev.
Incidence (CI 95%)
Intensity
(Mean) St.dev.
Certainly not 49.2 (45.2–53.3) 0.57 0.35 14.6 (11.9–17.7) 0.25 0.28
Probably not 43.0 (38.2–48.0) 0.52 0.36 8.3 (6.1–11.4) 0.28 0.32
Probably yes 44.2 (39.6–49.0) 0.41 0.33 17.0 (13.8–20.8) 0.18 0.23
Certainly yes 46.5 (41.4–51.7) 0.32 0.30 20.0 (16.0–24.5) 0.14 0.18
Total 46.1 (43.8–48.4) 0.47 0.35 14.9 (13.4–16.4) 0.20 0.25
4.3 Model specification
The association between persistent joblessness among labour market attached partners and fertility intentions needs to be verified in a multivariate setting, as it is likely to be affected by several other factors as well. Given the ordinal nature of the fertility intentions variable, we specify an ordered logit model predicting women’s (short-term) fertility intentions (as reported at the interview date).
The model includes quite a few additional covariates. The demographic controls include age (continuous in years), parity (0, 1, 2, 3 or more children), age of the youngest child (aged 0–2, aged 3 or more), and number of siblings (0, 1, 2 or more). In addition, we distinguish between married and cohabiting coresident couples and control for the number of years in cohabitation or marriage. The partners’ educational attainment is identified using the three standard levels: basic education, secondary and upper secondary education, and post-secondary and tertiary education. The family background is taken into account by including in the model equation the presence of at least one parent with higher education in his and in her family of origin. Finally, to account for dependence among observations belonging to the same region of residence, we utilized robust standard errors in the model estimation.
economic difficulties”). This covariate complements information derived from the employment history. Indeed, having a continuous participation to the labour market does not necessarily imply levels of economic resources perceived as adequate (this is an emerging class in Italy, the so-called ‘working poor’(Andress and Lohmann 2008)).
As the interpretation of the effects of the control covariates is beyond the scope of this paper, we deliberately do not comment on their effects. Nevertheless, those estimated are all in line with what was found in previous literature for Italy (Régnier-Loilier and Vignoli 2011; Rinesi et al. 2011), providing us with an indirect validation of our model.
5. Results
5.1 Fertility intentions differentials by persistent joblessness
We compare two model specifications. Model 1 considers the association between persistent joblessness among labour market attached partners measured through the PJI and her fertility intentions, while Model 2 looks at the association between current employment status and her fertility intentions. The full model results are reported in the Appendix 2 (Table A-3).
Net of other variables included, our findings show that the higher the level of PJI for men and women, the lower her childbearing intentions will be. Figure 3 shows a comparison of the estimates stemming from Model 1 and Model 2 in terms of the Average Marginal Effects (AME)5 computed for both genders, based on the scale of a
woman’s fertility intentions. The negative/positive association between PJI and the woman’s fertility intention level is particularly evident for the ‘extreme’ intentions (“definitely not” and “definitely yes”). Comparing Figure 3a and 3b, it is striking that the man’s PJI contributes to the variation in women’s fertility intentions to a much greater extent than his current labour market status. Her level of PJI, on the other hand, inhibits her intention to have a child in the near future, while her current employment status is not significant. This suggests that a consideration of only the current employment status leads to an underestimation in the association between partners’ joblessness and women’s fertility intentions.
Our results also provide evidence that, within couples, the effect of the persistence in men’s joblessness among active individuals is considerably larger than that of
5 AME expresses the effect of a change of an explanatory categorical variable x
1 from one category to
women’s. In other terms, when the male partner experiences persistent employment discontinuity, even at a lower intensity than that of the female partner, his situation appears more strongly negatively linked with the woman’s intention to have a child in the near future than her own joblessness. In the model with PJI, men’s persistent joblessness estimate is generally two times more important than women’s persistent joblessness. In particular, for women who said they definitely do not intend to have a child in the next three years the estimated marginal effect of his PJI is of +0.087 as opposed to her PJI of +0.043 (Figure 3a); for those who reported that they probably intend to have a child, respectively, –0.020 and –0.010; and for those who said they definitely intend to have a child, respectively, –0.068 and –0.033. This pattern is also confirmed in Model 2, which includes the current joblessness status, though the magnitude of the effects, as already outlined, is weaker and not statically significant for women. In sum, our findings suggest that, in Italy, the economic performance of the male partner still represents a crucial factor in the decision to have or not to have a child. Nonetheless, because incidence and intensity of persistent joblessness among active individuals are especially concentrated among women, women’s persistent joblessness constitutes a key, non-negligible force negatively associated with fertility planning.
Figure 3: Average marginal effects of persistence (a) and short-term (b)
measures of the persistent joblessness on women’s fertility intentions
a) b)
Note: In this analysis we controlled for the variables listed in Table A-3. Note: * p < 0.10; ** p < 0.05; *** p < 0.01, n.s.: not statistically
significant.
To validate the correct specification of our measure of persistent joblessness, we re-estimated how fertility intentions connect to several, in our view meaningful, versions of PJI: (i) excluding one by onewij,oij,pij, andre; (ii) testing the single effects
ofwij,oij, andpij (that is excluding two parameters each time but keepingre effect); and
(iii) only including the sequence of continuous/discontinuous years, with and without
** n.s. ** ** * n.s. * * -0.10 -0.06 -0.02 0.02 0.06 0.10
Certainly not Probably not Probably yes Certainly yes
Av er ag e m ar gi na le ffe ct
Women's intention to have a child
Her PJI His PJI
n.s. n.s. n.s. n.s. * n.s. * * -0.10 -0.06 -0.02 0.02 0.06 0.10
Certainly not Probably not Probably yes Certainly yes
Av er ag e m ar gi na le ffe ct
Women's intention to have a child
oij, basing the computation of PJI only on dij. All the models reiterated a significant
negative association between fertility intentions and any persistent joblessness, with the exception of only two versions of PJI. Interestingly, these two non-informative versions are the simpler ones, namely those of point (iii).
5.2 Robustness checks
Our findings have passed some robustness checks (results not shown but available upon request). First, some women might intend not to have more children because they already achieved their desired family size. Some might want to catch up and have more children quickly because of their advanced reproductive age. Others still might be just too young to be thinking of children given that the mean age at first birth in Italy is around 30 years of age. We run a series of sensitivity checks in which we let the age upper limit vary downward (i.e., 25–35; 25–36; 25–37; 25–38; 25–39) or upward (i.e., 25–41; 25–42; 25–43; 25–44; 25–45) and the age lower limit vary upward (i.e., 26–40; 27–40; 28–40; 29–40). The pattern of results, though, remains virtually unchanged.
Second, the PJI is computed taking into account the last five years. During that time span, women may have given birth to a child, and this may have affected their employment trajectories. To check for this kind of nosey effect, we restricted the analytical sample by focusing on those women who had not experienced a childbirth in the five years preceding the interview – again, the results proved very robust.
6. Conclusions
We studied how persistent joblessness among partners who displayed some attachment to the labour market in the last years connects to the intention to have a child in Italy. In line with previous studies, we corroborated that joblessness inhibits positive fertility intentions and facilitates negative fertility intentions. But we also added that these associations are much more pronounced when joblessness has been persistent. Our results suggested, indeed, that individuals plan their reproductive choices while keeping in mind not only their current employment situation, but also their recent past employment history, which will, most likely, influence their short-term prospects. Disregarding the role of persistence in joblessness, scholars might underestimate the importance of individual-risk factors linked to labour market biographies in fertility planning. Women plan to have a child only after they are convinced that they can draw on sufficiently sound and secure economic conditions to enable them to bring up their children properly and to continue pursuing their other life goals. We additionally illustrated that accounting for regional labour market dynamics, thus placing one’s own level of persistence in joblessness in context, is pivotal.
Italy represents an archetype of Southern European model of linking labour market dynamics to social risks. Several studies demonstrated that the unfavourable labour market dynamics characterizing young adults who wish to participate in paid employment lead to negative consequences for occupational prospects (Barbieri and Scherer 2009), poverty risk at childbirth (Barbieri and Bozzon 2016), health outcomes (Pirani and Salvini 2015), or private life (Scherer 2009). In this paper, we further proved that joblessness among more labour market attached individuals leads to negative consequences for family formation too; these consequences are especially visible when the experience of joblessness is accumulated and persistent in the life course of individuals.
Italy, the female labour market performance is likely to represent the key turning point in future fertility dynamics.
Our paper has its limitations, which offer opportunities for future research. First, PJI crudely distinguishes between episodes of employment and non-employment. With our data, we have no information about whether the individual exited employment voluntarily or not, neither we know whether s/he is actively searching for a new job. To properly evaluate the (demographic) consequences of economically disadvantaged individuals, however, the main issue is not whether a person is looking for work, but whether a person is actually employed or not (Wilson 1987; OECD 1998; Clasen et al. 2006; Faggio and Nickell 2003;Härkönen 2011).
Second, there are well-known economics papers, such as Del Bono, Weber, and Winter-Ebmer (2012, 2015), which discuss job changes due to firm closures, or similar interruptions to human capital accumulation. They argue that any interruption generates changes in fertility outcomes even if such change does not cause discontinuity in employment status (i.e., when workers immediately find another job without experiencing unemployment). In our proposal, transitions between full-time and part-time, between self-employment and employment are all treated as ‘employment stability’ by PJI. Future extensions of PJI must be directed towards an operationalization of job trajectories, instead of more basic employment trajectories to acknowledge the rising ‘contractual instability’ characterizing contemporary labour markets in Europe (Barbieri and Scherer 2009). A further extension of this work can be directed towards the development of a time-varying variant of the index to consider the timings of the subjects who experimented employment changes and their possible different effects on fertility (intentions).
Third, a clear obstacle for the identification of the effects of joblessness on fertility intentions is the simultaneity and mutual dependence of the decisions regarding work and family life, especially in the case of women. Our analysis has limited power in informing us about causal relationships because it does not take into account that family-centred women and career-oriented women – using terminology reminiscent of Hakim (2003) – might react in quite contrary ways to persistent employment joblessness. Note, however, that the focus of the paper on the persistence of discontinuous employment or joblessness is translated in the restriction of the sample to individuals who entered into the labour market at least once during the period 2005– 2009. This partly eliminates from the sample ‘pure’ family-centred women.
fact, the effect of (persistent) joblessness on fertility intentions is underestimated in this study. Nonetheless, the focus on couples is clearly essential in fertility intention research, because childbearing intentions represent a realizable plan only for partnered individuals.
Finally, the paper is affected by context- and time-specificities. Since labour patterns differ with varying workplace structures, social policies, and cultural norms in different countries (Neyer, Lappegård, and Vignoli 2013; Barbieri et al. 2015), future research should examine whether the findings of this study work for other countries. In addition, the advent of the ‘Great Recession’ in Italy, as well as in other European countries, may have made the persistence of joblessness more important in more recent years.
Despite these limitations, with this paper we advance the importance of persistence in individuals’ joblessness trajectories when exploring women’s fertility plans. Our findings are in line with a theoretical principal. From a life-course perspective, it is imperative to recognise the importance of critical, or sensitive, periods that can have enduring effects. Positions and transitions today depend on previous circumstances leading to patterns of path dependency (Keizer, Dykstra, and Jansen 2008). Hence, this paper emphasises the importance of considering the accumulation of labor market advantage and disadvantage across the life course when studying fertility differentials. We proposed a new measure of economic uncertainty in the context of fertility intention research. Previous studies have sought to identify the main determinants of fertility intentions by considering the respondents’ characteristics at the time of the interview. This approach overlooks the broader context of employment experience, which might have led to the formulation of fertility plans. Consequently, the complexity of individuals’ life careers and individual diversity were largely hidden. The longitudinal index proposed in this paper accounts for employment trajectories over life courses and so represents a step forward.
7. Acknowledgments
References
Aassve, A., Fuochi, G., Mencarini, L., and Mendola, D. (2015). What is your couple type? Gender ideology, housework sharing, and babies.Demographic Research
32(30): 835–858.doi:10.4054/DemRes.2015.32.30.
Adserà, A. (2004). Changing fertility rates in developed countries: The impact of labor market institutions.Journal of Population Economics 17(1): 17–43.doi:10.1007/ s00148-003-0166-x.
Adserà, A. (2011). Where are the babies? Labor market conditions and fertility in Europe.European Journal of Population 27(1): 1–32. doi:10.1007/s10680-010-9222-x.
Andersson, G. (2000). The impact of labor-force participation on childbearing behaviour: Pro-cyclical fertility in Sweden during the 1980s and the 1990s.
European Journal of Population 16(4): 293–333. doi:10.1023/A:1006454909 642.
Andress, H.J. and Lohmann, H. (eds.) (2008). The working poor in Europe: Employment, poverty and globalisation. Cheltenham: Edward Elgar Publishing. Barbieri, G. and Sestito, P. (2008). Temporary workers in Italy: Who are they and
where they end up. Labour 22(1): 127–166. doi:10.1111/j.1467-9914.2007. 00402.x.
Barbieri, P. and Bozzon, R. (2016). Welfare, labour market deregulation and households’ poverty risks: An analysis of the risk of entering poverty at childbirth in different European welfare clusters. European Journal of Social Policy 26(2): 99–123.doi:10.1177/0958928716633044.
Barbieri, P. and Scherer, S. (2009). Labour market flexibilisation and its consequences in Italy.European Sociological Review 25(6): 677–692.doi:10.1093/esr/jcp009. Barbieri, P., Bozzon, R., Scherer, S., Grotti, R., and Lugo, M. (2015). The rise of a
Latin model? Family and fertility consequences of employment instability in Italy and Spain. European Societies 17(4): 423–446. doi:10.1080/14616696. 2015.1064147.
Becker, G.S. (1960). An economic analysis of fertility: Demographic and economic change in developed countries. Princeton: NBER.
Bernardi, F. and Nazio, T. (2005). Globalization and the transition to adulthood in Italy. In: Blossfeld, H.P., Klijzing, E., Mills, M., and Kurz, K. (eds.). Globalization, uncertainty and youth in society. London: Routledge: 349–374.
Billari, F.C., Goisis, A., Liefbroer, A.C., Settersten, R.A., Aassve, A., Hagestad, G., and Spéder, Z. (2011). Social age deadlines for the childbearing of women and men.
Human Reproduction 26(3): 616–622.doi:10.1093/humrep/deq360.
Billari, F.C., Philipov, D., and Testa, M.R. (2009). Attitudes, norms and perceived behavioral control: Explaining fertility intentions in Bulgaria.European Journal of Population 25: 439–465.doi:10.1007/s10680-009-9187-9.
Bloom, N. (2014). Fluctuations in uncertainty.Journal of Economic Perspectives 28(2): 153–176.doi:10.1257/jep.28.2.153.
Blossfeld, H.P. and Hofmeister, H. (2006). Globalization, uncertainty and women’s careers: An international comparison. Cheltenham: Edward Elgar.
Blossfeld, H.P., Mills, M., and Bernardi, F. (2006). Globalization, uncertainty and men’s careers: An international comparison. Cheltenham: Edward Elgar. Bossert, W. and D’Ambrosio, C. (2013). Measuring economic insecurity.International
Economic Review 54(3): 1017–1030.doi:10.1111/iere.12026.
Brand, J.E. (2015). The far-reaching impact of job loss and unemployment. Annual Review of Sociology 41: 359–375.doi:10.1146/annurev-soc-071913-043237. Brant, R. (1990). Assessing proportionality in the proportional odds model for ordinal
logistic regression.Biometrics 46(4): 1171–1178.doi:10.2307/2532457.
Busetta, A. and Giambalvo, O. (2014). The effect of women’s participation in the labour market on the postponement of first childbirth: A comparison of Italy and Hungary.Journal of Population Research 31(2): 151–192. doi:10.1007/s12546-014-9126-4.
Cameron, A.C. and Trivedi, P.K. (2010).Microeconomics using Stata. College Station: Stata Press.
Ciganda, D. (2015). Unstable work histories and fertility in France: An adaptation of sequence complexity measures to employment trajectories. Demographic Research 32(28): 843–876.doi:10.4054/DemRes.2015.32.28.
Cutuli, G. and Guetto, R. (2013). Fixed-term contracts, economic conjuncture, and training opportunities: A comparative analysis across European labour markets.
European Sociological Review29(3): 616–629.doi:10.1093/esr/jcs011.
Dannefer, D. (2003). Cumulative advantage/disadvantage and the life course: Cross-fertilizing age and social science theory.Journal of Gerontology Series B: Social Sciences 58(6): S327–S337.doi:10.1093/geronb/58.6.S327.
Del Bono, E., Weber, A., and Winter-Ebmer, R. (2012). Clash of career and family: Fertility decisions after job displacement. Journal of the European Economic Association 10(4): 659–683.doi:10.1111/j.1542-4774.2012.01074.x.
Del Bono, E., Weber, A., and Winter-Ebmer, R. (2015). Fertility and economic instability: The role of unemployment and job displacement. Journal of Population Economics 28(2): 463–478.doi:10.1007/s00148-014-0531-y. Dixit, A. and Pindyck, R.S. (1994).Investment under uncertainty. Princeton: Princeton
University Press.
Esping-Andersen, G. and Regini, M. (2000). Why deregulate labor markets? Oxford University Press.
Faggio, G. and Nickell, S. (2003). The rise in inactivity among adult men. In: Dickens, R., Gregg, P., and Wadsworth, J. (eds.). The labour market under new labour. The state of working Britain. Houndmills: Palgrave Macmillan: 40–52. doi:10.1057/9780230598454_4.
Fahlén, S. and Olàh, L. (2015). The impact of economic uncertainty on childbearing intentions in Europe. Stockholm: University of Stockholm (FamiliesAndSocieties working paper 36/2015).
Goldscheider, F.K., Bernhardt, E., and Lappegård, T. (2015). The gender revolution: A framework for understanding changing family and demographic behaviour.
Population and Development Review 41(2): 207–239. doi:10.1111/j.1728-4457.2015.00045.x.
Goldstein, J., Kreyenfeld, M., Jasilioniene, A., and Örsal, D.K. (2013). Fertility reactions to the ‘Great Recession’ in Europe: Recent evidence from order-specific data. Demographic Research 29(4): 85–104. doi:10.4054/DemRes. 2013.29.4.
Hakim, K. (2003). A new approach to explaining fertility patterns: Preference theory.
Population and Development Review 29(3): 349–374.doi:10.1111/j.1728-4457. 2003.00349.x.
Hanappi, D., Ryser, V.A., Bernardi, L., and Le Goff, J.M. (2017). Changes in employment uncertainty and the fertility intention–realization link: An analysis based on the Swiss household panel. European Journal of Population 33(3): 381–407.doi:10.1007/s10680-016-9408-y.
Härkönen, J. (2011). Children and dual worklessness in Europe: A comparison of nine countries.European Journal of Population 27(2): 217–241. doi:10.1007/s10680-011-9232-3.
Heiland, F., Prskawetz, A., and Sanderson, W.C. (2008). Are individuals’ desired family size stable? Evidence from West German panel data. European Journal of Population 24: 129–156.doi:10.1007/s10680-008-9162-x.
Hobson, B. (2011). The agency gap in work-life balance: Applying Sen’s capabilities framework within European contexts. Social Politics 18(2): 147–167. doi:10.1093/sp/jxr012.
Hobson, B. and Oláh, L.S. (2006). Birthstrikes? Agency and capabilities in the reconciliation of employment and family.Marriage and Family Review 39(3–4): 197–227.doi:10.1300/J002v39n03_01.
Hofmann, B., Kreyenfeld, M., and Uhlendorff, A. (2017). Job displacement and first birth over the business cycle.Demography 54(3): 933–959. doi:10.1007/s13524-017-0580-4.
International Labor Organization (2015). Geneva: ILO. http://www.ilo.org/global/lang--en.
Istat (2016). Rome: Istat.http://www.istat.it.
Keizer, R., Dykstra, P.A., and Jansen, M.D. (2008). Pathways into childlessness: Evidence of gendered life course dynamics.Journal of Biosocial Science 40(6): 863–878.doi:10.1017/S0021932007002660.
Kreyenfeld, M. (2010). Uncertainties in female employment careers and the postponement of parenthood in Germany.European Sociological Review 26(3): 351–366.doi:10.1093/esr/jcp026.
Kreyenfeld, M., Andersson, G., and Pailhé, A. (2012). Economic uncertainty and family dynamics in Europe: Introduction. Demographic Research 27(28): 835–852. doi:10.4054/DemRes.2012.27.28.
Long, J.S. (1997).Regression models for categorical and limited dependent variables. Thousand Oaks: Sage.
Matysiak, A. and Vignoli, D. (2008). Fertility and women’s employment: A meta-analysis.European Journal of Population 24(4): 363–384. doi:10.1007/s10680-007-9146-2.
Matysiak, A. and Vignoli, D. (2013). Diverse effects of women’s employment on fertility: Insights from Italy and Poland. European Journal of Population 29(3): 273–302.doi:10.1007/s10680-013-9287-4.
Matysiak, A., Sobotka, T., and Vignoli, D. (2018). The Great Recession and fertility in Europe: A sub-national analysis. Vienna: Vienna Institute of Demography (Vienna Institute of Demography Working Papers 02/2018). https://www.oeaw. ac.at/fileadmin/subsites/Institute/VID/PDF/Publications/Working_Papers/WP20 18_02.pdf.
McDonald, P. (2000). Gender equity, social institutions and the future of fertility.
Journal of Population Research 17: 1–16.
Mendola, D. and Busetta, A. (2012). The importance of consecutive spells of poverty: A path-dependent index of longitudinal poverty. Review of Income and Wealth
58(2): 355–374.doi:10.1111/j.1475-4991.2011.00486.x.
Mendola, D., Busetta, A., and Milito, A.M. (2011). Combining the intensity and sequencing of the poverty experience: A class of longitudinal poverty indices.
Journal of the Royal Statistical Society Series A 174(4): 953–973. doi:10.1111/ j.1467-985X.2011.00699.x.
Mills, M. and Blossfeld, H.-P. (2013). The Second Demographic Transition meets globalisation: A comprehensive theory to understand changes in family formation in an era of rising uncertainty. In: Evans, A. and Baxter, J. (eds.).
Negotiating the life course: Stability and change in life pathways. Dordrecht: Springer: 9–33.doi:10.1007/978-90-481-8912-0_2.
Moore, A. (2016). Measuring economic uncertainty and its effects. Sydney: Bank of Australia (Research Discussion Paper RDP 2016-01).
Mynarska, M., Matysiak, A., Rybinska, A., Tocchioni, V., and Vignoli, D. (2015). Diverse paths into childlessness over the life course. Advances in Life Course Research25: 35–48.doi:10.1016/j.alcr.2015.05.003.
Neyer, G., Lappegård, T., and Vignoli, D. (2013). Gender equality and fertility: Which equality matters?European Journal of Population 29(3): 245–272.doi:10.1007/ s10680-013-9292-7.
OECD (1998). Recent labour market developments and prospects: Special focus on patterns of employment and joblessness from a household perspective. In:
Employment outlook. Paris: OECD: 1–30.
Oppenheimer, V.K. (2003). Cohabiting and marriage during young men’s career-development process.Demography 40(1): 127–149.doi:10.2307/3180815. Özcan, B., Mayer, M.K., and Luedicke, J. (2010). The impact of unemployment on the
transition to parenthood.Demographic Research 23(29): 807–846.doi:10.4054/ DemRes.2010.23.29.
Pailhé, A. and Solaz, A. (2012). The influence of employment uncertainty on childbearing in France: A tempo or quantum effect? Demographic Research
26(1): 1–40.doi:10.4054/DemRes.2012.26.1.
Pirani, E. and Salvini, S. (2015). Is temporary employment damaging to health? A longitudinal study on Italian workers. Social Science and Medicine 124: 121– 131.doi:10.1016/j.socscimed.2014.11.033.
Ranjan, P. (1999). Fertility behaviour under income uncertainty. European Journal of Population 15(1): 25–43.doi:10.1023/A:1006106527618.
Régnier-Loilier, A. and Vignoli, D. (2011). Fertility intentions and obstacles to their realization in France and Italy.Population–E 66(2): 361–390.doi:10.3917/pope. 1102.0361.
Rinesi, F., Pinnelli, A., Prati, S., Castagnaro, C., and Iaccarino, C. (2011). Avoir un deuxième enfant en Italie: de l’intention à la réalisation. Population–F 66(2): 435–450.doi:10.3917/popu.1102.0434.
Sampson, R.J. and Laub, J.H. (1997). A life-course theory of cumulative disadvantage and the stability of delinquency. In: Thornberry, T.P. (ed.). Developmental theories of crime and delinquency. New Brunswick: Transaction Publishers. Scherer, S. (2009). The social consequences of insecure jobs. Social Indicators
Research 93(3): 527–547.doi:10.1007/s11205-008-9431-4.
Schmitt, C. (2012). Labour market integration, occupational uncertainty, and fertility choices in Germany and the UK. Demographic Research 26(12): 253–292. doi:10.4054/DemRes.2012.26.12.
Sobotka, T., Skirbekk, V., and Philipov, D. (2011). Economic recession and fertility in the developed world. Population and Development Review 37(2): 267–306. doi:10.1111/j.1728-4457.2011.00411.x.
Testa, M.R. and Grilli, L. (2006). The influence of childbearing regional contexts on ideal family size in Europe.Population–E 61(1–2): 109–137.doi:10.3917/pope. 601.0099.
Thomson, E. and Brandreth, Y. (1995). Measuring fertility demand. Demography
32(1): 81–96.doi:10.2307/2061898.
Toulemon, L. and Testa, M.R. (2005). Fertility intentions and actual fertility: A complex relationship.Population and Societies 415: 1–4.
Vignoli, D., Drefahl, S., and De Santis, G. (2012). Whose job instability affects the likelihood of becoming a parent in Italy? A tale of two partners. Demographic Research 26(2): 41–62.doi:10.4054/DemRes.2012.26.2.
Vignoli, D., Rinesi, F., and Mussino, E. (2013). A home to plan the first child? Fertility intentions and housing conditions in Italy. Population Space and Place 19(1): 60–71.doi:10.1002/psp.1716.
Vignoli, D., Tocchioni, V., and Salvini, S. (2016). Uncertain lives: Insights into the role of job precariousness in union formation in Italy. Demographic Research
35(10): 253−282.doi:10.4054/DemRes.2016.35.10.
Williams, R. (2006). Generalized ordered logit/partial proportional odds models for ordinal dependent variables. The Stata Journal 6(1): 58–82. doi:10.1177/ 1536867X0600600104.
Wilson, W.J. (1987).The truly disadvantaged. Chicago: University of Chicago Press. World Economic Forum (2014). The global gender gap report 2014. Geneva,
Appendix 1
An exemplification of the computation and interpretation of PJI and its components
The individual identified byLP = (11010) and IP = (0.25, 0.5, 0, 0.75, 0), haved21= (2
– 1) = 1;d41= (4–1) = 3;d42= (4 – 2) = 2;o21= 0;o41= 1;o42= 1,w21= (0.5 + 0.25) / 2
= 0.375;w41= (0.75 + 0.25) / 2 = 0.500;w42= (0.75 + 0.25) / 2 = 0.625. Suppose these
probabilities are p21 = 0.24, p41 = 0.11 and p42= 0.05, and alpha equal 0.8. The
calculation of PJI looks like this:
PJI = α (d21 + 1)-p21*(o21 + 1)*w21 + (d41 + 1)-p41T*(o41 + 1)*w41 + (d42 + 1)-p42*(o42 + 1)*w42 2
+(1 – α) 1 + 2 + 45(5 + 1) 2
= 0.8(1 + 1)-0.24*(0 + 1)*0.375 + (3 + 1)-0.11*(1 + 1)5 *0.500 + (2 + 1)-0.05*(1 + 1)*0.625 2
+ 0.2(0.467)
=(0.8*0.124) + (0.2*0.467) = 0.099 + 0.093 = 0.192.
Considering that PJI, and similarly its two addends, spans in [0,1], the value of 0.124 (first addend of PJI’s linear combination) expresses a low persistence in joblessness motivated by the fact that (i) the individual was in continuous employment in two out five years; (ii) the first and second year were characterized respectively by a high and medium number of months of employment (8 out of 12 in year one and 6 out 12 in the second year); (iii) the first two years of discontinuous employment (which weigh the most, given that they are consecutive) contribute less than expected due to the fact that between the first and the second year nearly a quarter of all people remained in the same detrimental situation (p21= 0.24). In addition, the evaluation of
the relevance of discontinuity in employment is stressed by considering that the most recent year of discontinuous employment was the penultimate and that the other two episodes are settled at the beginning of the LP (re = 0.467).
giving relevance to the recentness of the episodes of discontinuous employment changes PJI from 0.124 (i.e., when alpha = 0) to 0.192 (when alpha = 0.8); or, considering or not all spells of discontinuous employment as equally important (i.e., respectively, excluding or including wij) changes the first addend of PJI from 0.248 to
0.124.
Appendix 2
Table A-1: Women’s intentions to have a child in the next three years by age
Childbearing intentions Age
25–29 30–34 35–40
% 95% CI % 95% CI % 95% CI
Certainly not 12.4 (8.9–17.2) 23.6 (20.2–27.2) 44.6 (41.5–47.8)
Probably not 15.3 (11.3–20.4) 18.3 (15.3–21.7) 26.4 (23.7–29.3)
Probably yes 33.5 (27.8–39.7) 31.3 (27.6–35.2) 17.3 (15.0–19.8)
Certainly yes 38.8 (32.9–45.1) 26.9 (23.4–30.7) 11.7 (9.8–13.8)
Total 100.0 100.0 100.0
Table A-2: Incidence and intensity of persistent joblessness among women and men by age group
Incidence* of PJI
All individuals Among individuals with at least one month of joblessness (PJI > 0)
Intensity**
of PJI 95% CI
Intensity**
of PJI 95% CI Women
25–29 62.8 0.206 (0.170 – 0.241) 0.328 (0.281 – 0.374)
30–34 50.1 0.228 (0.201 – 0.255) 0.455 (0.416 – 0.494)
35–42 39.4 0.214 (0.193 – 0.235) 0.543 (0.508 – 0.579)
Total 45.9 0.217 (0.202 – 0.233) 0.474 (0.450 – 0.497)
Men
25–29 32.9 0.043 (0.022 – 0.064) 0.130 (0.080 – 0.180)
30–34 19.8 0.036 (0.022 – 0.049) 0.181 (0.123 – 0.239)
35–42 11.9 0.026 (0.019 – 0.033) 0.218 (0.173 – 0.263)
43–49 12.8 0.032 (0.018 – 0.047) 0.250 (0.160 – 0.340)
Total 14.6 0.030 (0.024 – 0.035) 0.203 (0.173 – 0.233)
Note: * share of individuals who experienced at least one year with at least one month of non-employment (PJI different from 0).
Table A-3: Fertility intentions in the next three years: results of ordered logit models
Model 1 Model 2
Beta and significance Beta and significance
Her PJI –0.293** She is not employed (ref: empl) –0.059
His PJI –0.601* He is not employed (ref: empl) –0.327*
Her education (ref: Low) Her education (ref: Low)
Medium –0.146 Medium –0.119
High 0.073 High 0.097
His education (ref: Low) His education (ref: Low)
Medium 0.243*** Medium 0.243***
High 0.227 High 0.239
Her age 0.248 Her age 0.268
Her squared age –0.005 Her squared age –0.005
His age 0.252** His age 0.249**
His squared age –0.004** His squared age –0.004**
No. of her children at 2009 (ref. no child) No. of her children at 2009 (ref. no child)
One child –1.325*** One child –1.342***
Two children –3.327*** Two children –3.363***
Three or more children –3.334*** Three or more children –3.397***
Married 0.535*** Married 0.522***
No. of her siblings (ref. no siblings) No. of her siblings (ref. no siblings)
One 0.220* One 0.228*
Two or more 0.402** Two or more 0.398**
Her youngest child 0–2 yrs
(ref. aged 3 yrs or more) 0.210
Her youngest child 0–2 yrs
(ref. aged 3 yrs or more) 0.229 No. of years in cohabitation/marriage –0.075*** No. of years in cohabitation/marriage –0.074***
He has at least one parent with high
education –0.010
He has at least one parent with high
education –0.017
She has at least one parent with high
education 0.076
She has at least one parent with high
education 0.072
Perceived economic difficulties –0.221*** Perceived economic difficulties –0.229***
Cut off ^ Cut off^
cut1 constant 4.228 cut1 constant 4.597
cut2 constant 5.750* cut2 constant 6.117*
cut3 constant 7.573** cut3 constant 7.939**
Pseudo R-squared 0.223 Pseudo R-squared 0.222
No. of observations 1,772 No. of observations 1,772
Note: * p < 0.10; ** p < 0.05; *** p < 0.01. Standard errors adjusted for the 19 Italian regions. ^ partition boundaries that define the