AERODYNAMIC OPTIMIZATION OF A TWIN-BOX DECK BASED ON FLUTTER
STABILITY ADOPTING CFD APPROACH
SAAD A. YEHIA*, WALID A. ATTIA
*PhD Student in Structure Dept., Faculty of Eng., Cairo University, Giza, Egypt.
Professor of Theory of Structure, Structure Dept., Faculty of Eng., Cairo University, Giza, Egypt. KEYWORDS
:
Twin-box deck, Stonecutters Bridge, Computational fluid dynamics, Critical flutter wind speed, Fluid-Structure Interaction.ABSTRACT
Twin-box bridge decks offer a very good aerodynamic response in terms of flutter stability. Because of this, they are being adopted in some of the most challenging long span bridges recently built such as the Stonecutters Bridge. The importance of bridge aerodynamic investigations was immediately realized after the Tacoma Narrows Bridge collapsed in 1940. Since, the cable-stayed bridges are prone to the aerodynamic instabilities caused by wind this becomes a prime criterion to be checked during the design. The target is to optimize the deck shape to reduce the aerodynamic forces. To achieve this goal, more than 40 model cases were tested in order to obtain an optimized aerodynamic configuration of the deck. The influence of the gap distance between twin-box and the geometry modifications on the aerodynamic stability has been established through this thesis. CFD (Computational Fluid Dynamics) simulations appear to be powerful rivals of the wind tunnel tests, which are expensive, require a scale model and a time consuming tool in designing bridges. Therefore, the analyses are carried out for deck shapes through CFD software OpenFOAM V2.3.1, establishing a dimensional fluid-structure interaction (FSI) numerical model to calculate the flutter critical wind speed.
INTRODUCTION
Wind load is one of the most important design loads in civil engineering structures, especially for long span bridges with low damping and high flexibility. Deck sections of long span bridges are one type of bluff bodies that are usually elongated with sharp corners that make the flow around them to cause aerodynamic instabilities. Such instabilities may cause serious catastrophic structural failure such as, the old Tacoma Narrows Bridge collapse in 1940.
Multi-box and twin-box decks, have received growing attention in recent years. The need for spanning longer distances has demanded a particularly efficient aerodynamic response from bridge deck designs. Multi-box bridge decks have provide better aerodynamic responses that their single deck counterparts [1]. On the other hand, multi-box bridge deck arrangements have shown to be prone to vortex-induced vibrations which must be carefully tackled [2]. One of the most important parameters influencing the aerodynamic and aeroelastic response of twin-box decks is the gap distance between twin-boxes. Remarkable examples of twin-twin-box bridges recently built are the Xihoumen Bridge, which is a suspension bridge with a main span of 1650m and the Stonecutters Bridge, a cable-stayed bridge with an impressive 1018m main span length. The case study presented here is the Stonecutters Bridge.
Fig.1 Example of Positive and Negative Damping [7]
METHODOLOGY
Bridge Description
Stonecutters Bridge is part of Hong Kong’s Route 8 - a new east-west expressway providing a further link between Sha Tin and Tsing Yi Island. The dual 3-lane road provides an alternative option on the route to the Hong Kong international airport off Lantau Island and better access connections into the container terminals at Kwai Chung. The bridge spans the Rambler Channel, providing high level clearance and linking container terminal 8 on Stonecutters Island on the east side to the new container terminal 9 on Tsing Yi Island on the west. Fig.2 shows the Stonecutters Bridge location.
Fig.2 Stonecutters Bridge location [8]
Highways Department of Hong Kong (HyD) procured the bridge concept through an international design competition in 2000. The consultancy for the detailed design, awarded to Arup and COWI in March 2001, started with a thorough technical review of the competition winning concept. Detailed design [9] commenced in March 2002, with particular studies [10] carried out into wind, seismicity and ship impact as part of the design process. The construction contract was awarded to the Maeda - Hitachi - Yokogawa - Hsin Chong joint venture (MHYHJV) in April 2004. Throughout construction many interesting challenges have been overcome [11]. Fig.3 shows the elevation and plan of Stonecutters Bridge.
Stonecutters Bridge is cable-stayed with a steel main span of 1018m, and a total length of 1596m. There are four prestressed concrete back spans on each side. The tapered mono-towers are in concrete up to level +175m and steel-concrete composite from level +175m to level +293m with the outer steel skin being duplex stainless steel. 5m tall glazing structures top the towers off to level +298m. The 2 planes of stay cables take a modified fan arrangement, anchored at the outer edges of the deck at 18m intervals in the main span and 10m intervals in the back spans.
The deck is a twin box-girder, with the two longitudinal girders connected by cross girders. The piers in the back spans are monolithically connected to the deck. The three intermediate piers are single column piers, while the end piers at the adjoining viaducts are twin column portal structures. Laterally the bridge deck is restrained by vertical bearings on the towers and by the back span piers. In the longitudinal direction dynamic movements are restrained by hydraulic buffers at the towers. The ground is reclaimed on both sides, and comprises a highly variable thickness of superficial deposits overlying bedrock typically at level –50m to –90m. Fig.4 shows concrete and steel deck of Stonecutters Bridge.
Fig.4 Concrete and Steel deck section. (mm) [12]
Numerical Simulation Principle
The structure is regarded as a mass, spring and damping system. A schematic diagram of numerical simulation is shown in Fig.5. Fluid control equations for incompressible flow are given in equations (1), (2) which represent the continuity and the Navier-Stokes equation respectively. The first step to ascertain the aerodynamic response of the considered bridge deck types is computation of the aerodynamic force coefficients (Cd , Cl, and Cm).
After getting these coefficients, forces (F
D, FL and M) can be easily calculated using equations (3), (4), and (5)
[13]. Fig.6 shows criteria for the aerodynamic forces and moment. Equations (6), (7) are the governing structural equations for the heaving and torsional mode [5].
.
0
(1)
V
2
1
(
.
)
p
(2)
t
p
V
V
V
V
2
0.5
d(3)
D
F
U BC
2
0.5
l(4)
L
2
0.5
m(5)
M
U BC
( )
h( )
h( )
L( )
(6)
mh t
C
h t
K h t
F
t
( ) ( ) ( ) ( ) (7)
I
t C
t K
t M tWhere:
V, p and t: Velocity, pressure, time respectively.
: Air density.
: Air dynamic viscosity. FD, FL, and M: Drag force, lift force, and moment respectively.
Cd, Cl, and Cm: Coefficients of drag force, lift force, and moment respectively. U: Reference velocity.
B: Bridge width.
m: Deck mass per unit length.
I: Mass moment of inertia about shear center per unit length. Ch , Cα: Structural damping coefficients.
K
h, Kα: Translational and rotational spring stiffness.
( ), ( ) , ( )
h t
h t
h t
: Instantaneous bending acceleration, velocity and displacement respectively.( ), ( ) , ( )
t
t
t
: Instantaneous torsional acceleration, velocity and displacement respectively.Before calculating the time step, the preliminary value of bending and torsional acceleration, velocity, and displacement are set to be zero [14]. For every time step the pressure and velocity are computed around the bridge deck for the given position by solving the continuity and Navier-Stokes equations as in equations (1), (2). Then the aerodynamic force coefficients acting on the bridge deck are calculated by using equations (4), (5). Lift pressure force and moment are represented by the force in y-direction and the force that causes rotation respectively. Lift force is applied at the center of gravity and the moment is applied at the shear center, then the lift and moment are extracted into structural dynamic equations (6), (7). Then they are solved by using The Newmark-β method to get the displacements for the heave and pitch. These displacements are applied in a rigid body fashion and the grid is updated. The velocity of the grid is applied from one time step to the next one by dividing the time step size in different positions. This process is repeated for several time steps. Then the velocity of the grid is extracted in the Navier stokes equation to account and simulate deck movement by a dynamic mesh technique.
Numerical Simulation Model
specific dissipation rate ω. The algorithm used to solve the Reynold’s Averaged Navier-Stokes equations is PIMPLE, an incompressible transient turbulent flow solver, which combines the PISO and SIMPLE algorithms for computing the pressure. The PIMPLE algorithm is compiled in the OpenFOAM solver, pimpleDyMFoam, and was used in all the computations presented herein. PISO stands for Pressure Implicit with Splitting the Operators algorithm while SIMPLE represents Semi-Implicit Method for Pressure-Linked Equation algorithm [15].
Table 1. Full scale properties of the deck section [16]
Parameters Units Values
Natural vertical frequency (
f
v )Hz
0.201 Natural torsional frequency (f
t)Hz
0.425 Mass per unit length (m) Kg/m 20488 Mass moment of inertia about shear center per unit length (I) Kg.m² /m 65.789 *10
The computational region and boundary conditions of the bridge deck are shown on Fig.7. The height of the fluid domain is 8B and the length is 16B where (B) is the deck width.
Fig.7 Computational region and boundary conditions of the bridge deck
For all the simulation presented in this work, the pressure is enforced as zero gradient at the inlet of the tunnel and zero value at the outlet, while the velocity is fixed at the inlet and has a zero gradient boundary condition at outlet. The upper and lower sides are specified as symmetrical. The no-slip boundary condition is applied on the deck surface. The OpenFOAM boundary condition settings for velocity and pressure are given in Table 2.
Table 2. Boundary conditions for velocity and pressure
Boundary BC for velocity BC for pressure
Inlet Fixed value Zero Gradient
Outlet Zero Gradient Fixed value, value uniform (0)
Top and Bottom Zero Gradient Zero Gradient Deck Moving wall velocity , uniform
(0,0,0) Zero Gradient
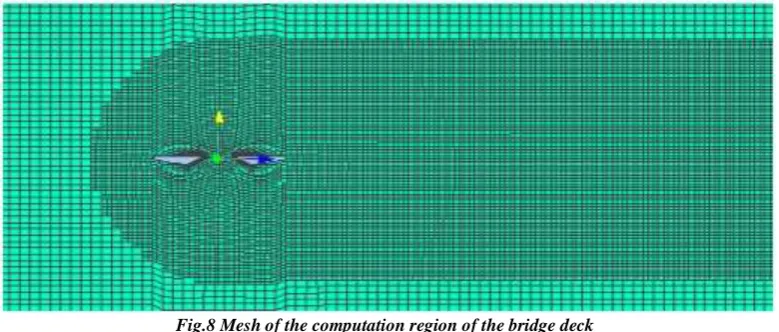
the final mesh. Fig.8 shows a section of the mesh created by the snappyHexMesh OpenFOAM application. The final mesh consisted of 46928 cells and 94990 Nodes.
Fig.8 Mesh of the computation region of the bridge deck
After choosing the solver and discretization schemes, the simulation is run with OpenFOAM. Post processing software ParaView is used to visualize the results of the computation for the user and to calculate key figures.
RESULTS AND DISCUSSION
The Influence of Different Gaps on Flutter Critical Wind Speed
Because the critical wind speed influenced by gap distance between boxes, therefor nine different arrangements in terms of gap distance between boxes have been considered. The ratios considered of the gap width (D) to the total deck depth (H) are 0, 0.5, 1.0, 1.5, 2.0, 2.50, 3.0, 3.64, and 4.0. These nine configurations are named as Gap 1, Gap 2, Gap 3, … and Gap 9. It must be noted that the actual configuration of the Stonecutters Bridge corresponds to Gap 8. Fig.9 indicate gap width (D) and deck depth (H). Flutter wind speed were obtained in the tests for the nine gaps with attack angles (-3 deg, 0 deg and 3 deg) and the results are shown in Table 3 and Fig.10. It is noted that the flutter critical wind speed increases along with the increasing of gap distance between boxes.
Fig.9 Gap width (D) and deck depth (H)
Table 3. Critical wind speed varying with different gaps
Case Gap width Flutter critical wind speed (m/s)
-3˚ 0˚ +3˚
Gap 9 D = 4.00 H ( 15.716 m ) 212.0 227.0 230.50
Fig.10 Relationship between gaps and flutter critical wind speed
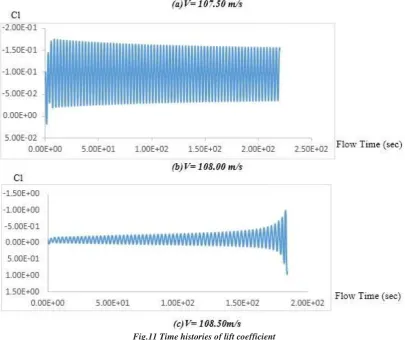
To find the critical wind speed of flutter for each case, time history analysis for aerodynamic coefficients and vibrating motion should be applied by increasing the inlet velocity incrementally in different runs. When the aerodynamic coefficients and motion amplitude started to grow (negative damping), the critical velocity was found. From Fig.11 for Gap 1(One Box) it can be seen that:
When wind speed equals 107.50 m/sec, lift coefficient decrease with the increase of time. This illustrates that the total damping of the model is positive.
When wind speed equals 108.00 m/s, lift coefficient remain almost the same.
When wind speed reaches 108.50 m/sec, lift coefficient increase with the increase of time. This illustrates that the total damping of the model changes from positive to negative. So flutter critical wind speed equals 108.50 m/se
Fig.11 Time histories of lift coefficient
The Influence of Interior Slope of Twin-Box deck on Flutter Critical Wind Speed
The interior slope of twin-box deck is taken into account in the tests. The gap distance between twin-box (D) equal to the deck depth (H) has been considered in the tests. The slope angle varies from 0 deg to 30 deg as shown in Fig.12. Total seven cases were tested. Flutter wind speed were obtained in the tests for the seven models with attack angles (-3 deg, 0 deg and 3 deg) and the results are shown in Table 4. It is noted that the flutter critical wind speed increases along with the increasing of interior slop. However, the flutter critical wind speed comes down distinctly when the slope angle exceeds 15˚.
Fig.12 Interior slope angle
Table 4. Critical wind speed varying with interior slope of twin-box deck
Case slope angle
Flutter critical wind speed (m/s)
-3˚ 0˚ +3˚
2 α= 5˚ 140.50 132.0 143.0 3 α= 10˚ 142.50 157.0 141.50 4 α= 15˚ 156.0 162.50 150.50 5 α= 20˚ 144.50 152.0 150.0 6 α= 25˚ 143.50 148.0 146.0 7 α= 30˚ 141.50 145.0 142.50
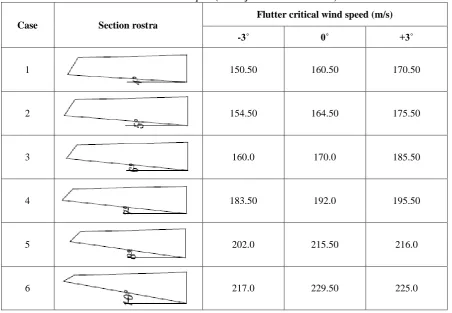
The Influence of Lower Web Slope on Flutter Critical Wind Speed
The rostra with varying of lower web slopes and the width of section rostra is only1.25m is taken into account in the tests. The web slope varies from4 deg to 10 deg. Flutter wind speeds were obtained in the tests for the section model and the results are shown in Table 5. It is noted that the flutter critical wind speed increases along with the increasing of the steepness of lower web slope
Table 5. Critical wind speed (width of section rostra is 1.25m)
Case Section rostra
Flutter critical wind speed (m/s)
-3˚ 0˚ +3˚
1 150.50 160.50 170.50
2 154.50 164.50 175.50
3 160.0 170.0 185.50
4 183.50 192.0 195.50
5 202.0 215.50 216.0
6 217.0 229.50 225.0
The Influence of Section Rostra on Flutter Critical Wind Speed
Table 6. Critical wind speed varying with different section rostra
case Type of the section rostra
Flutter critical wind speed (m/s)
-3˚ 0˚ +3˚
1 Width : 1.50m 223.50 230.5 234.0
2 Width : 1.75m 233.0 240.50 243.0
3 Width : 2.00m 234.0 242.50 246.50
4 Width :2.25m 232.50 240.50 242.0
5 Width :2.50m 224.50 232.50 235.0
6 Width : 2.75m 223.0 228.0 230.50
7 Width : 3.00m 218.50 226.0 229.50
8 Width : 3.25m 218.50 224.50 227.0
9 Width : 3.50m 217.0 223.0 225.0
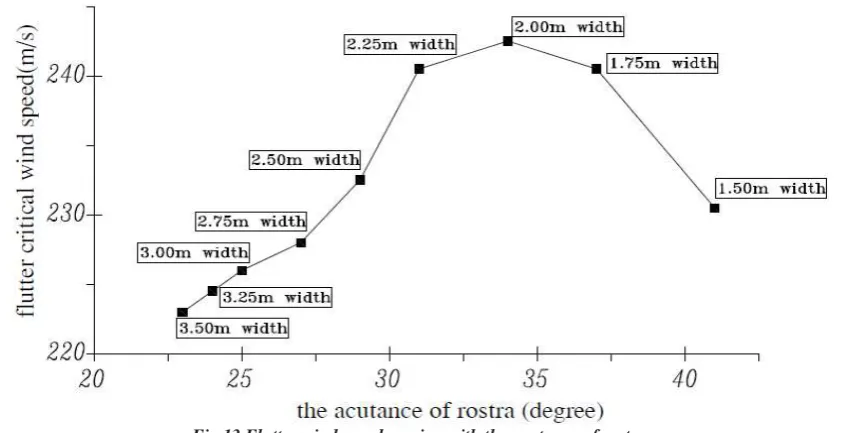
The Influence of Rostra Width with Fixed Steepness of Lower Inclined Web Slope on Flutter Critical Wind Speed
The wider and acuminate section rostra are more difficult to be fabricated and fixed, implying more cost in design and construction, although it can strengthen the aerodynamic stability of the girder distinctly. Alternate way is to fixed steepness of lower inclined web slope and varying the rostra width. Flutter wind speeds were obtained in the tests for the section model and the results are shown in Table 7. It is noted that the flutter critical wind speed increases along with the increasing of the rostra width. However, the flutter critical wind speed comes down distinctly when the rostra width exceeds 0.75m.
Table 7. Critical wind speed (web slope is 9˚)
case Type of the section rostra Flutter critical wind speed (m/s) -3˚ 0˚ +3˚
1 Width : 0.0m 200.0 209.0 211.50
2 Width : 0.25m 208.0 221.0 224.50
3 Width :0.50m 213.0 224.0 223.0
4 Width :0.75m 213.0 225.50 224.0
5 Width :1.00m 212.0 224.50 223.0
6 Width : 1.50m 209.50 221.0 221.50
7 Width : 1.75m 200.0 211.0 211.0
8 Width : 2.00m 198.0 208.50 211.0
The Influence of the Curvature Section Rostra on Flutter Critical Wind Speed
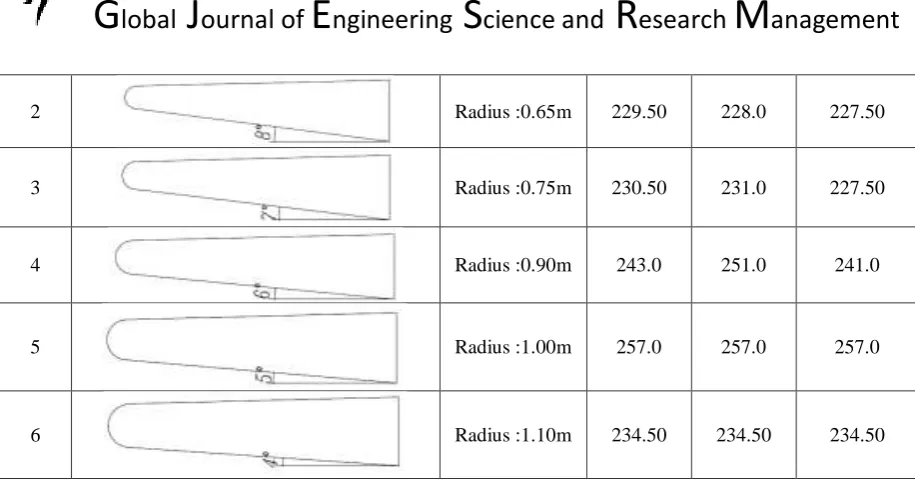
The rostra with varying of lower web slopes and the curvature section rostra were taken into account in the tests. The web slope varies from 4 deg to 9 deg. Total six model cases were tested. Flutter wind speeds were obtained in the tests for the section model and the results are shown in Table 8. It is noted that the flutter critical wind speed increases along with the increasing of the curvature rostra. However, the flutter critical wind speed comes down distinctly when the curvature rostra exceeds 1.00m.
Table 8. Critical wind speed varying with different section rostra
case Type of the section rostra Flutter critical wind speed (m/s) -3˚ 0˚ +3˚
1 Radius :0.55m 228.0 226.50
2 Radius :0.65m 229.50 228.0 227.50
3 Radius :0.75m 230.50 231.0 227.50
4 Radius :0.90m 243.0 251.0 241.0
5 Radius :1.00m 257.0 257.0 257.0
6 Radius :1.10m 234.50 234.50 234.50
Numerical Validations
The result of work done for the basic section of Stonecutters Bridge is compared with the data existing already in the literature from wind tunnel experiment as shown in Table 9. The critical flutter velocity predicted in the present work is a good agreement with the wind tunnel results.
Table 9. References of Flutter Velocity for the Basic Section of Stonecutters Bridge
References Vcr (m/s)
Present Work (Basic Section) 222.0 Hui, Michael C. H., et al. [16] 230.40 W. Qiu and Z. Xu. [19] 215.50
CONCLUSION
The following points offer the major outcome of the present study:
1. The aerodynamics of bridge deck cross section has been fully described through CFD simulations by using OpenFOAM software.
2. FSI is considered as a direct simulation method for the flutter stability of bridge and was developed based on CFD OpenFOAM software and proved to be useful in the early aerodynamic design stage of cable stayed bridges.
3. The flutter critical wind speed increases along with the increasing of gap distance between boxes. 4. The flutter critical wind speed increases along with the increasing of interior slop. However, the flutter
critical wind speed comes down distinctly when the slope angle exceeds 15˚.
5. The wider and acutance section rostra can strength the aerodynamic stability of the girder. 6. The flutter critical wind speed is sensitive to the steepness of blow inclined web slope.
7. When the slope of lower inclined web is 9 deg, the flutter critical wind speed increases along with the increasing of the rostra width. However, the flutter critical wind speed comes down distinctly when the rostra width exceeds 0.75m.
8. Using the curvature section rostra will increase the flutter critical wind speed with in the increasing of the curvature rostra. On the other hand, the curvature section rostra will increase the complexity of the structure design and construction cost.
9. The results also lead to an optimized section of twin-box girder: increase gap distance between boxes and shorter rostra. It also satisfies different kinds of requirements: high security, low cost, and more convenience.
ACKNOWLEDGEMENTS
The author Saad A. Yehia thanks Eng. Mohamed Abou-Elela for the many valuable comments to the manuscript
REFERENCES
1. K. Ogawa, H. Shimodoi and T. Oryu, “Aerodynamic characteristics of a 2-box girder section adaptable for a super-long span suspension bridge,” J. Wind Eng. Ind. Aerodyn. Vol. 90, pp. 2033-2043, 2002. 2. G. Diana, F. Resta, M. Belloli and D. Rocchi, “On the vortex shedding forcing on suspension bridge
deck,” J. Wind Eng. Ind. Aerodyn. Vol. 94, pp.341-363, 2006.
3. X. R. Qin, K.C.S. Kwok, C.H. Fok, P.A. Hitchcock and Y. L. Xu, “Wind-induced self-excited vibrations of twin-deck bridge and the effects of gap-width,” Wind Struct. Vol. 10(5), pp. 463-479, 2007.
4. X. R. Qin, K.C.S. Kwok, C.H. Fok and P.A. Hitchcock, “Effects of frequency ratio on bridge aerodynamics determined by free-decay sectional model tests,” Wind Struct. Vol. 12(5), pp. 413-424, 2009.
5. Hao Zhan, Tao Fang, and Zhiguo Zhang, “Flutter stability studies of Great Belt East suspension bridge by two CFD numerical simulation methods,” European & African Conference on Wind Engineering, Robinson College, Cambridge, UK, 7-11July 2013.
6. W.M.Zhang, Y.J.Ge, and M.L.Levitan, “Aerodynamic flutter analysis of a new suspension bridge with double main spans,” Journal of Wind and Structure, Vol. 14(3), 2011.
7. Vikas Arora, “Hybrid Viscous-Structural Damping Identification Method,” Vibration Engineering and Technology of Machinery, Mechanisms and Machine Science, Vol.23, pp.209-218, 2015.
8. Highways Department, The Government of the Hong Kong Special Administrative Region, http://www.stonecuttersbridge.net [accessed:10/3/10]
9. FALBE-HANSEN K, HAUGE L and KITE S, “Stonecutters Bridge – Detailed Design”, IABSE Symposium Shanghai: Metropolitan Habitats and Infrastructure, IABSE Report, Vol. 88, 2004
10. KITE S, FALBE-HANSEN K, VEJRUM T, HUSSAIN N, PAPPIN J, “Stonecutters Bridge – Design for Extreme Events”, IABSE Symposium Lisbon: Structures and Extreme Events, IABSE Report Vol. 90, 2005
11. KITE S, HUSSAIN N, “Challenges in Construction of Stonecutters Bridge”, IABSE Symposium Budapest : Responding to Tomorrow’s Challenges in Structural Engineering, IABSE Report, Vol. 92, 2006.
12. Highways Department, the Government of the Hong Kong Special Administrative Region, Stonecutters Bridge, Catalogue August 2007.
13. Fẽlix Nieto, Ibuki Kusano, Santigo Hernảndez, and Josẽ Ả. Jurado, “CFD analysis of the vortex – shedding response of a twin- box deck cable-stayed bridge,” The Fifth International Symposium on Computational Wind Engineering Chapel Hill, North Carolina, USA, 23-27 May 2010.
14. Xiaobing Liu, Zhengqing, and Chenb Zhiwen Liu, “Direct simulation method for flutter stability of bridge deck”, The Seventh International Colloquium on Bluff Body Aerodynamics and Applications (BBAA7), China, 2-6 September 2012.
15. Jasak H. “Error analysis and estimation for the finite volume method with applications to fluid flows”, PhD thesis, Imperial College of Science, Technology and Medicine, 1996.
16. Hui, Michael C. H., Ding, Q. S. and Xu, Y.L. “Flutter Analysis of Stonecutters Bridge,” Hong Kong: Wind and Structures, Vol. 9, pp.125-146. 2006.
17. Allan Larsen, “Aerodynamic aspects of the final design of the 1624 m suspension bridge across the Great Belt”, Journal of Wind Engineering and Industrial Aerodynamics, vol. 48, Issues 2-3, pp. 261-285, Oct. 1993.
18. Toshio Miyata, “Historical view of long-span bridge aerodynamics”, Journal of Wind Engineering Industrial Aerodynamic (91), pp.1393-1410, 2003.
![Table 1. Full scale properties of the deck section [16] Units](https://thumb-us.123doks.com/thumbv2/123dok_us/8888718.1823930/5.595.70.527.586.686/table-scale-properties-deck-section-units.webp)