1. Introduction
Load connected to the medium voltage feeder have some reactions to the parameters variation like environ-mental conditions variation, energy pricing variation, major event happening, and power utility announcing to the own customers. Due to some items in the customers, reactions to the parameter changes can be different. These items are customer welfare level, customer knowledge level, and type of load that we considered. If there is a method to find out the amount of reaction level of each feeders energy consumption to each parameter variation during the day then we could find which parameter that must managed and more amount of assets should be as-signed to aforementioned parameter's control and manag-ing.
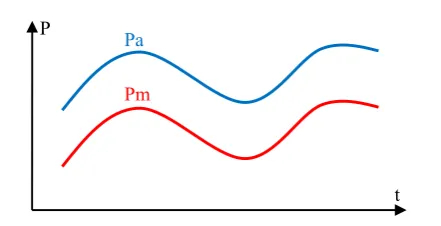
In figure 1 two load profiles curve for typical medium voltage feeder are shown. Pa(t) is the specific day load profile curve equation and Pm(t) is the managed load pro-file curve equation for mentioned feeder that is obtained after applying principle parameters effectiveness. Some principle parameters caused load profile curve changes from Pa(t) to Pm(t). These parameters effectiveness are shown in LMF as shown in 1.
(1)
There is a lot of parameters that their changes maybe affect to power energy consumption and causes load re-action which some of them that are very important consist environmental condition such as temperature and humid-ity variation, energy price variation at a specific period of time, major events like sport game broadcast and presi-dent lecture on TV, and power utility announcing to the own customers. These parameters respectively are shown with x1 to x5 variables in 2.
ܮܽ݀ܯܾ݈ܽ݊ܽ݃݁ܽ݅݅ݐݕܨܽܿݐݎሺܮܯܨሻ ൌሺ௧ሻ ሺ௧ሻ
Residential Load Manageability Factor Analyses by Load
Sensitivity Affected by Temperature
N. Eskandari*and S. Jalilzadeh*(C.A.)
Abstract:Load side management is the basic and significant principle to keeping the balance between
gen-eration side and consumption side of electrical power energy. Load side management on typical medium voltage feeder is the power energy consumption control of connected loads with variation of essential pa-rameters that loads do reaction to their variation. Knowing amount of load's reaction to each papa-rameters variation in typical medium voltage feeder during the day, leads to gain Load Manageability Factor (LMF) for that specific feeder that helps power utilities to manage their connected loads. Calculating this LMF needs to find out each types of load with unique inherent features behavior to each parameters variation. This paper results and future work results will help us to catch mentioned LMF. In this paper analysis of residential load behavior due to temperature variation with training artificial neural network will be done. Load behavior due to other essential parameters variations like energy pricing variation, major event hap-pening, and power utility announcing to the customers, and etc will study in future works. Collecting all re-lated works results in a unit mathematical equation or an artificial neural network will gain LMF.
Keywords:Load behavior, load side management, load sensitivity, manageability factor, neural network.
Iranian Journal of Electrical & Electronic Engineering, 2016. Paper received 4 November 2016 and accepted 3 March 2017. * The Authors are with Zanjan University, Zanjan, Iran. E-mail: [email protected], [email protected] Corresponding Author: N. Eskandari
P
t
Pa
Pm
Fig. 1.Two load profile curve for typical medium voltage feeder.
(2)
Each customer's degree of reaction to the mentioned parameters depends on inherent feature of them like cus-tomer's welfare, cuscus-tomer's knowledge, and type of loads such as residential, commercial, and industrial loads. If specific load with a unique own inherent feature reactions to the condition with same amount for parameters x2 to x5 in definite period of time are shown with 3 and so on for conditions that parameters x1 and x3 to x5 are the same are shown with 4 and continue this situation for each parameters, thus there are 5 equations that each of them illustrates load profile with only one parameter variation effectiveness. So with combination of these 5 equations, the main equation is gained. In this main equation that shows load profile, with changing one of essential param-eters, the amount of load profile variation could be seen and calculated. So with changing one of these parameters, the amount of manageability of load could be calculated.
(3)
(4)
(5)
(6)
(7)
In this paper with use of assumption 2, manageability factor for a unique typical residential medium voltage feeder are calculated during the day. Manageability factor value for each time of the day shows that specific feeder energy consumption changes with considering tempera-ture changes on that time. Calculating manageability
fac-tor with use of assumptions 3 till 6 give us a proper strat-egy to lead assets for controlling and managing load side energy consumption with concentrate on which parame-ters that needs less attempting or budgets and more effec-tiveness in comparison with others. Calculating process for assumption 4 to 7 is very similar to work that we did in this.
The main equation is the combination of those five equations that each of them present load profile with one variable changing effectiveness by considering that an-other parameters with same conditions for whole period of time that studying performed. With having this main equation, power utility companies could manage load side energy consumption more effectively. This main equation has Load Manageability Factor (LMF) inherently that was showed in 1. Calculating should be done for every kind of loads with unique innate features. In this paper the cal-culation are done for residential load with average welfare and knowledge level.
2. Previous Related Works
Many researches discuss some approaches to manage load side energy absorption that we are going to summa-rize them in the following context.
Reference [1] proposes a scheduling strategy based on real-time pricing in smart grids. Also a hierarchical game is employed to analyze the decision-making process of generators and consumers. It proves the existence and uniqueness of Nash equilibrium and utilize a backward induction method to obtain the generation and consump-tion strategies. Then, two dynamic algorithms for the gen-erators and consumers to search for the equilibrium in a distributed fashion are proposed. Simulation results in the article demonstrate that the proposed scheduling strategy can match supply with demand and shift load away from peak time.
In [2] Demand-response (DR) is regarded as a promis-ing solution for future power grids. They used a Stackel-berg game approach, and describe a novel DR model for electricity trading between one utility company and mul-tiple users, which is aimed at balancing supply and de-mand, as well as smoothing the aggregated load in the system. In [2] an iterative algorithm is proposed to derive the Stackelberg equilibrium, through which optimal power generation and power demands are determined for the utility company and users respectively. Numerical sults indicate that the proposed method can efficiently re-shape users’ demands, including flattening peak demands and filling the vacancy of valley demands, and signifi-cantly reduce the mismatch between supply and demand. In [3] residential demand response is studied through the scheduling of typical home appliances in order to min-imize electricity cost and earn the relevant incentive. A mixed integer nonlinear optimization model is built under a time-of-use electricity tariff. A case study shows that a ݔͳ ՜
ʹ ՜ ݄ݑ݉݅݀݅ݐݕ
ݔ͵ ՜ ݓ݁ݎ݁݊݁ݎ݃ݕݎ݅ܿ݁
ݔͶ ՜ ݆݉ܽݎ݁ݒ݁݊ݐݏ݄ܽ݁݊݅݊݃
ݔͷ ՜ ܽ݊݊ݑ݊ܿ݅݊݃ݐݐ݄݁ܿݑݏݐ݉݁ݎݏ
ݔͳ ՜ ܿݑ݈ܾ݀݁ݒܽݎݕ
ݔʹݐݔͷ ՜ ݓ݅ݐ݄ݑݐݒܽݎ݅ܽݐ݅݊ (
ܲͳሺݐሻ ൌ ݈ܽ݀ݎ݂݈݅݁݁ݍݑܽݐ݅݊ݓ݅ݐ݄ܾܽݒ݁ܿ݊݀݅ݐ݅݊ݏ
ݔʹ ՜ ܿݑ݈ܾ݀݁ݒܽݎݕ
ݔͳܽ݊݀ݔ͵ݐݔͷ ՜ ݓ݅ݐ݄ݑݐݒܽݎ݅ܽݐ݅݊ (
ܲʹሺݐሻ ൌ ݈ܽ݀ݎ݂݈݅݁݁ݍݑܽݐ݅݊ݓ݅ݐ݄ܾܽݒ݁ܿ݊݀݅ݐ݅݊ݏ
ݔ͵ ՜ ܿݑ݈ܾ݀݁ݒܽݎݕ
ݔͳǡ ݔʹǡ ݔͶǡ ݔͷ ՜ ݓ݅ݐ݄ݑݐݒܽݎ݅ܽݐ݅݊ (
ܲ͵ሺݐሻ ൌ ݈ܽ݀ݎ݂݈݅݁݁ݍݑܽݐ݅݊ݓ݅ݐ݄ܾܽݒ݁ܿ݊݀݅ݐ݅݊ݏ
ݔͶ ՜ ܿݑ݈ܾ݀݁ݒܽݎݕ
ݔͳǡ ݔʹǡ ݔ͵ǡ ݔͷ ՜ ݓ݅ݐ݄ݑݐݒܽݎ݅ܽݐ݅݊ (
ܲͶሺݐሻ ൌ ݈ܽ݀ݎ݂݈݅݁݁ݍݑܽݐ݅݊ݓ݅ݐ݄ܾܽݒ݁ܿ݊݀݅ݐ݅݊ݏ
ݔͷ ՜ ܿݑ݈ܾ݀݁ݒܽݎݕ
ݔͳݐݔͶ ՜ ݓ݅ݐ݄ݑݐݒܽݎ݅ܽݐ݅݊ (
ܲͶሺݐሻ ൌ ݈ܽ݀ݎ݂݈݅݁݁ݍݑܽݐ݅݊ݓ݅ݐ݄ܾܽݒ݁ܿ݊݀݅ݐ݅݊ݏ
household is able to shift consumption in response to the varying prices and incentives, through which the con-sumer may realize an electricity cost saving of more than 25%. It has also been shown that at different values of the weighting factor ˛ gives varying costs, from which the consumer is able to choose according to their preferences. Therefore a final decision about participation in the pro-gram could be made.
In [4] they derive an optimization problem that mini-mizes procurement costs of an electricity retailer in order to control Demand Response usage. The evaluation with historic data shows that cost volatility can be reduced by 7.74%; peak costs drop by 14.35%; and expenditures of retailers can be significantly decreased by 3.52%.
In [5] investigations on DSM programs which are done in different countries, enlarge the view of managers for program designing. This paper reviews DSM programs of 13 countries and at the end there are some suggestions for the case of Iran. In this article peak reduction and load shifting could be apply for DSM programs in Iran. Also unreal electricity price is known as a major problem in Iran.
In [6] the authors examine the influence of M/SV for a specific case of the conceptual design of a demand re-sponse (DR) program. DR is a proposed Smart Grid ca-pability that can be implemented by a utility into an electricity distribution grid. M/SV considered include simulation time-step, number of electricity consumers, and seed variables used in modeling stochastic behavior. The influence of these variables on the ability of the DR simulation environment to produce accurate load curves and peaks is analyzed. For some M/SV, is shown that in-creased fidelity offers diminishing returns on greater com-putation time. Quantification of the influence of M/SV is used to support discussion and to identify important siderations when modeling large scale DR past the con-ceptual design stage.
In [7] one type of algorithm is extended to cover sce-narios where the supply is no longer fixed; its perform-ance is investigated under varying conditions such as the percentage of the flexible load as well as the extent of the load’s flexibility. The expected benefit of applying the al-gorithm to real world scenarios is predicted, allowing for an informed decision on whether or not to employ it in specific situations and under which pricing conditions.
[8] Presents a Building Automation System where the Demand-Side Management is fully integrated with the building’s Energy Production System, which incorporates a complete set of renewable energy production and stor-age systems. The presented strategy is developed for the new Experimental Park of Renewable Energies (PETER) located in the University of Évora, Portugal. These facil-ities are located within Herdade da Mitra, the University agro-livestock complex, which comprises several houses, teaching facilities, animal hospital, wineries, byre, pigsty,
and other agriculture facilities.
[9] Describes the current status of DSM efforts in the U.S. and explores how these programs affect electricity operations. The relationship between DSM policy and program efforts and the amount of saved electricity is tested, with a methodological approach aimed at minimiz-ing selection bias that is inherent in the non-experimental research design. Results confirm that state-run DSM ef-forts contribute to electricity savings across the country. Public benefit funds coupled with performance incentives are found to encourage utility participation in DSM pro-grams. Energy efficiency portfolio standards and perform-ance incentives effectively promote electricity savings; but public benefit funds without the support of other DSM policies are not significant drivers of either DSM program participation or total DSM electricity savings.
[10] proposes the use of an stochastic evolutionary based optimization technique, Evolutionary Algorithms, to automatically generate optimal, or nearly optimal, so-lutions that represent schedules to charge a number of electric vehicles (EVs) with two goals: (a) that each EV is as fully charged as possible at time of departure, and (b) to avoid charging them at the same time, whenever possible (e.g., load reduction at the transformer level). In-stead of using a price signal to shift load consumption, we achieve this by considering what all the EVs might do at a particular time, rather than considering an interaction between an utility company and its user, as normally adopted in DSM programs. The main contribution of this work is the notion of load shifting, borrowed from smart pricing methods, implemented in an evolutionary-based algorithm to automatically generate optimal solutions. The results obtained by their proposed approach are highly encouraging in both: EVs being almost fully charged at time of the departure and the transformer load being reduced as a result of avoiding turning on the EVs at the same time.
In [11] first argued that the chosen test statistics bias results in favor of rejecting the null hypothesis that util-ity-reported savings reflect true values. They also note that utility estimates of average program savings and costs are rejected based on point estimates alone. They use the same data and econometric model to estimate the appro-priate test statistics. Then they construct nonparametric bootstrap confidence intervals. These intervals are quite large. They fail to reject the average electricity savings and DSM costs reported by utilities. Their results suggest that the evidence for rejecting utility estimates of DSM savings and costs should be re-interpreted.
In [12] they focus on a smart grid in which the demand-side comprises traditional users as well as users owning some kind of distributed energy sources and/or energy storage devices. By means of a day-ahead optimization process regulated by an independent central unit, the latter users intend to reduce their monetary energy expense by
producing or storing energy rather than just purchasing their energy needs from the grid. In this paper, they for-mulate the resulting grid optimization problem as a non-cooperative game and analyze the existence of optimal strategies. Furthermore, they present a distributed algo-rithm to be run on the users’ smart meters, which provides the optimal production and/or storage strategies, while preserving the privacy of the users and minimizing the re-quired signaling with the central unit. Finally, the pro-posed day-ahead optimization is tested in a realistic situation.
[13] Gives an overview and taxonomy for DSM, ana-lyzes the various types of DSM, and gives an outlook on the latest demonstration projects in this domain.
In [14] they consider an abstract market model for de-mand response where a supply function bidding is applied to match power supply deficit or surplus. They character-ize the resulting equilibria in competitive and oligopolistic markets and propose distributed demand response algo-rithms to achieve the equilibria. Also they further show that the equilibrium in competitive market maximizes so-cial welfare, and the equilibrium in oligopolistic market has bounded efficiency loss under certain mild assump-tions. Finally they propose distributed demand response algorithms to achieve the equilibria.
[15] proposes a reward based demand response algo-rithm for residential customers to shave network peaks. Customer survey information is used to calculate various criteria indices reflecting their priority and flexibility. Cri-teria indices and sensitivity based house ranking is used for appropriate load selection in the feeder for demand re-sponse. Customer Rewards (CR) are paid based on load shift and voltage improvement due to load adjustment. The proposed algorithm can be deployed in residential distribution networks using a two-level hierarchical con-trol scheme. Realistic residential load model consisting of non-controllable and controllable appliances is considered in this study. The effectiveness of the proposed demand response scheme on the annual load growth of the feeder is also investigated. Simulation results show that reduced peak demand, improved network voltage performance, and customer satisfaction can be achieved.
In all of previous essays researchers argue demand side management that is affected from one or two parameters variation. If load behavior due to large number of param-eters variation are available then it is possible to control load side consumption in an effectively method. Studying load behavior at single parameter variation and then merge those in a load manageability factor could help us to achieve load side effective consumption management. In the following section we get load behavior due to single parameters variation. At first our approach to get the load manageability factor will be discussed, and then by using real data about electric load energy consumption, the unique factor will be achieved.
3. Load Manageability Factor Analyses
Suppose that there is medium voltage feeder that more than 90% of connected loads have residential aspects and configuration of this feeder for a long period of time does-n't have basic changes. There are 24-hour load profiles for this feeder through aforementioned long period of time and also there are basic information about that feeder and respective days. Basic information about the feeder could be knowledge level of costumers, and social welfare that are the same through studying period of time. Basic in-formation about the respective days could be environment temperature, environment humidity, and some important events that have happened on typical days with large ef-fective on energy consumption like principal football matches playing, political debates, and popular TV pro-grams.
In order to catch the single effective parameter load profile we need the load profile of days that differences between them are because of the single parameter changes. In this paper single parameter is temperature variation. So we consider and select load profile of days that have same effective factors except environment tem-perature differences. Equation (8) shows load profile curve equations for all days that have same conditions ex-cept different temperature. m is the number of days that have same conditions during studying period of time ex-cept temperature variation.
(8)
For all days of 1 to m effective factors that causes load consumption variation is environmental temperature changes. All equations for these days are obtained from curve fitting process in Matlab software with acceptable R-square index value. Type of fitting equation is not im-portant than R-square index, so we select equation that have R-square value near 1. Because of nature LMF that must be without specific unit and has per unit structure and also for comparison of each days load profile with base load profile, it is necessary to find out base load pro-file among m load propro-files. The simple method for finding base load profile is finding average load profile, but in this paper with using of curve fitting method, the best one is selected. Base load profile curve equation that is ob-tained from curve fitting methods is shown in 9.
t t
t t
t t
t t
t t
t t
t t
t t
n n
n
n n
n
n n
n
n n
n
Z Z
Z
J J
J
E E
E
D D
D
1 2 1
m
1 2 1 3
1 2 1 2
1 2 1 1
) ( P
) ( P
) ( P
) ( P
(9)
With dividing all days load profile curve equation to base load profile curve equation, LMF of each days that caused by only temperature changes will be obtained as are shown in 10. These equations are per unit and without specific unit. In this step there are m number LMF that differences between them are because of temperature vari-ation. There are some methods to find out specific LMF that all equations of m day's LMF converge that, but in this paper artificial neural network analysis is selected. Furthermore with using of this method relation between temperature variation and load profile curve will be con-sidered.
(10)
Training artificial neural network with temperature data as input vector and 24 hours LMF for typical days as target or output vector will be done. With having a set of input valid data for trained network a set of LMF will be achieved. With applying curve fitting on output data the final LMF will be fined. It is necessary to consider other parameter beside temperature information as an input vec-tor for training network and it is load growth for relative days. It is absolutely obvious that load profile variation in two similar days depends on load growth so we consider input vector with four dimensions.
According to recent description input vector for neural network training is like matrix A is shown at (11). Each row is relative day's temperature information and load growth index. Columns 1 to 4 are minimum, average, maximum and load growth index for respective day. Tar-get vector for neural network training is like matrix B that is shown at (12). In this matrix each row shows 24 load amounts at 24 hour on relative day that are divided to Pbase(t). Matrix A and B order depends on the number of days that we have same condition except temperature variation.
(11)
In matrix A, tmin1 is minimum temperature on first day, tavg1 is average temperature on first day, tmax1 is maximum temperature on first day and finally Lg1 is load growth on first day. m is the number of days that have same condition except temperature variation. After train-ing neural network we have pattern that enables havtrain-ing 24 hours LMF with having temperature information and load growth. With having this pattern, 24 hours LMF index for related medium voltage feeder are obtained and it was obvious that temperature variation when and how much could change load side consumption.
4. Practical Study
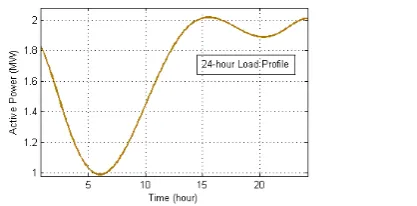
We collect all 20Kv feeders' energy consumption of Al-borz Province Power Electric Distribution Company for 4 years. Also temperature information of 4 years has been collected. All our study is based on collected information. This company has 309 medium voltage feeders that smart meters recorded energy consumption in 1 hour step. Due to importance and effectiveness of residential loads, we concentrate this type of load behavior. Feeders that feed the large number of residential type of loads are selected for our study. In order to ignore residential load behavior caused by knowledge level of costumers, and social wel-fare, feeders that feed the part of city with the same knowledge level and social welfare with the average level have been noticed. Also feeders that 90% of connected loads are residential are used for our study. Feeders don't have any load displacement are considered for our study. Fig. 2 shows load profile curve of typical residential feeder for typical day.
d e n
ܲ௦ሺݐሻ ൌ ߣଵݐ ߣଶݐିଵ ڮ ߣt
t t
t t P
t P
t t
t t P
t P
t t
t t P
t P
t t
t t P
t P
n n
n
base m
n n
n
base
n n
n
base
n n
n
base
T T
T
K K
K
] ]
]
H H
H
1 2 1
1 2 1 3
1 2 1 2
1 2 1 1
) (
) (
) (
) (
) (
) (
) (
) (
» » » » »
¼ º
« « « « «
¬ ª
» » » » »
¼ º
« « « « «
¬ ª
) (
) (
) (
) (
1
max 2 max max
min min min
2 1 1
2 1
2 1
t P
t P
t P
t P
B
l l l
t t t
t t t
t t t
A
base m base
g g g
avg avg avg
m m m m
Fig. 2.Load profile curve of typical residential feeder for typi-cal day
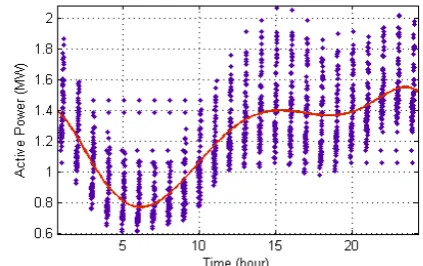
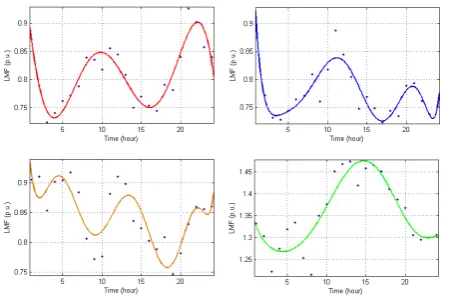
There was m=70 days in 4 year that other parameters variation was the same except temperature variation. Fig. 3 shows 24 hours load profile on 70 days. So the load pro-file curve of these days was extracted and with using of curve fitting related equation of mentioned curves was calculated as are shown in 12. Fig. 4 shows sample curve fitting for 4 typical days.
(12)
With applying curve fitting on 70 days data that was shown in Fig 3, base load profile that is mentioned in 9 will be obtained. This equation is considered as base load profile to do comparison each days load profile curve with this and make LMF index without any unit as per unit index. Fig. 5 shows this curve fitting and 13 shows related equation with acceptable R-square index near 0.6048.
(13)
With dividing all equations in 12 to Pbase(t) hour by hour value, per unit LMF for each day will be obtained as shown in 14. These equations represent power consump-tion variaconsump-tion between each day in comparison with Pbase(t) due to temperature variation. Fig. 6 shows some example of mentioned equation in 14.
(14)
In this step with temperature value as input vector and equations on 14 as output vector, the artificial neural
net-9943 . 0 37 . 2 ) 4 72 . 0 ( ... ) 7 87 . 4 ( ) 9 98 . 3 ( ) ( P
9898
. 0 23 . 1 ) 4 25 . 0 ( ... ) 7 02 . 2 ( ) 9 84 . 1 ( ) ( P 9907 . 0 51 . 1 ) 4 30 . 0 ( ... ) 7 11 . 1 ( ) 9 08 . 1 ( ) ( P 9955 . 0 26 . 1 ) 4 63 . 1 ( ... ) 7 75 . 1 ( ) 9 61 . 1 ( ) ( P 7 8 70 8 9 3 8 9 2 8 9 1
square R with
t e t e t e t
square R with
t e t e t e t
square R with
t e t e t e t
square R with
t e t e t e t
6048 . 0 2 . 1 52 . 0 49 . 0 ) 1 6 . 1 ( ) 2 9 . 2 ( ) 3 2 . 3 ( ) 4 1 . 2 ( ) 4 52 . 8 ( ) 7 83 . 1 ( ) 9 65 . 1 ( ) ( P 1 2 3 4 5 6 7 8 9 base square R with t t t e t e t e t e t e t e t e t 39 . 1 ) 088 . 0 ( ... ) 6 21 . 1 ( ) 8 44 . 1 ( ) ( ) ( P 704 . 0 08 . 1 ) 2515 . 0 ( ... ) 8 07 . 7 ( ) 10 04 . 7 ( ) ( ) ( P 8103 . 0 21 . 1 ) 51 . 0 ( ... ) 7 42 . 7 ( ) 9 61 . 7 ( ) ( ) ( P 8726 . 0 04 . 1 ) 2 . 0 ( ... ) 6 07 . 3 ( ) 8 99 . 9 ( ) ( ) ( P 6 7 70 8 9 3 7 8 2 5 6 1 t t e t e t P t square R with t t e t e t P t square R with t t e t e t P t square R with t t e t e t P t base base base base
Fig. 3.24 hours load profile on 70 days Fig. 5.Curve fitting on 70 days data
Fig. 4. sample curve fitting for 4 typical days
work will be trained. The aim of this section is making re-lation between temperature changes and related load pro-file curve and finding final curve with a large number of valid temperature data as a series of inputs. Final curve could be obtained from curve fitting of neural network outputs as shown in fig 7 and related Gaussian equation as are shown in 15.
(15)
The value of dividing area under the final LMFcurve to area of maximum value of this curve that happened in hour 11 is 0.95. This value could be considered as total load manageability factor affected by temperature varia-tion on this typical residential medium voltage feeder. If this value was equal to 1 then it showed temperature vari-ation could not affected on load consumption more in-tensely. Because all curves in fig7 were obtained from dividing specific day load profile to base load profile, then value 1 means despite temperature variation, consumption of energy was the same amount in two curves in specific time. If this value is greater or smaller than 1, it shows temperature variation positive or negative intense affec-tivity on load consumption. Also hour by hour analysis of final curves shows that before the hour 10 temperature variations were in a manner that caused load consumption decreases and after that it caused increases of load con-sumption and need to support by other feeders.
Conclusion
In this article we concentrate on residential load to find load reaction in the medium voltage feeder due to tem-perature variation to get the LMF. Final LMF curve shows
that temperature variation could decrease load consump-tion in specific times during the day and also increase that in another times. Collecting other parameters effective on load profile to finding final LMF will be done. With ob-taining other parameters LMF it can be easy to find that which parameters must be manage and control to get op-timum load managing.
Acknowledgment
The authors wish to thank Alborz Province Power Electric Distribution Company (APPEDC). This work was supported by APPEDC.
References
[1] J. Yang, G. Zhang, and K. Ma, “Real-Time Pricing-Based Scheduling Strategy in Smart Grids: A
Hi-erarchical Game Approach,” Hindawi Publishing
Corporation Journal of Applied Mathematics, 2014. [2] M. Yu, and S. H. Hong, “Supply-demand balancing for power management in smart grid: A
Stackel-berg game approach,” Applied energy 164, pp.
702–710, 2016.
[3] D. Setlhaolo, X. Xia, and J. Zhang, “Optimal scheduling of household appliances for demand
re-sponse,” Electric Power Systems Research 116, pp.
24–28, 2014.
[4] S. Feuerriegel, D. Neumann, “Measuring the finan-cial impact of demand response for electricity
re-tailers,” Energy Policy 65, pp. 359–368, 2014.
[5] M. Asadi, and M. H. Moradi, “Investigation of DSM challenges in Iran with review of the
interna-tional experiences,” IEEE PrimeAsia Pacific
Con-ference on Postgraduate Research in, pp. 420–423, Jan 2009.
[6] S. S. Pogaru, M. Z. Miller, S. J. Duncan, and D. N.
11
2311 10 21 . 1 t
-20.34 21.96
-t
-2.618 8.87
-t
-2.261 8.71 -t
-10 e
62
. 8 0.133e
0.395e -0.44e
LMF(p.u.)
2
4
2
2 2
u
¸ ¸ ¹ · ¨ ¨ © § u ¸
¹ · ¨ © §
¸ ¹ · ¨ © § ¸
¹ · ¨ © §
Fig. 6.Sample LMF for 4 typical days Fig. 7.Final LMF
Mavris, “Investigating the Impacts of Modeling Variables- A Case Study with Smart Grid Demand
Response,” Procedia Computer Science, vol. 16,
pp. 440–448, 2013.
[7] H. Hildmann and F. Saffre, “Influence of Variable Supply and Load Flexibility on Demand-Side
Man-agement,” 8th International Conference on the
Eu-ropean Energy Market, pp. 63–68, May 2011. [8] J. Figueiredo and J. Martins, “Energy Production
System Management-Renewable energy power
sup-ply integration with Building Automation System,”
Energy Conversion and Management 51, pp. 1120-1126, 2010.
[9] S. Carley, “Energy Demand-Side Management:
New Perspectives for a New Era,”, July 2011.
[10] E. G. Lopez, A. T. Taylor, S. Clarke, and V. Cahill,
“Design of an Automatic Demand-Side
Manage-ment System Based on Evolutionary Algorithms,”
Symposium on Applied Computing. Korea, , pp. 24-28, March 2014
[11] M. Auffhammer, C. Blumstein, and M. Fowlie,
“Demand-Side Management and Energy Efficiency
Revisited,” The Energy Journal. Vol 29, pp. 91–104,
2008.
[12] I. Atzeni, L. G. Ordonez, G. Scutari, D. P. Palomar, and J. R. Fonollosa, “Demand-Side Management via Distributed Energy Generation and Storage
Optimization,” IEEE Transactions on Smart Grid,
2012.
[13] P. Palensky, and D, Dietrich, “Demand Side Man-agement: Demand Response, Intelligent Energy
Systems, and Smart Loads,” IEEE Transactions on
industrial informatics, vol. 7, pp. 381–388, August 2011.
[14] N. Li, L. Chen, and M. A. Dahleh, “Demand
Re-sponse Using Linear Supply Function Bidding,”
IEEE Transactions on Smart Grid, 2015.
[15] C. Vivekananthan, Y. Mishra, G. Ledwich, and F. Li, “Demand Response for Residential Appliances
via Customer Reward Scheme,” IEEE Transactions
on Smart Grid, vol.5, pp. 809–820, March 2014.
Nasser Eskandari was born in Zanjan, Iran, 1962. He received the B.S. degree from university of Chamran (Ahwaz, Iran) in 1991 and M.Sc. degree from Water &Power University (Tehran,Iran) in 2000 both in Electric Power Engineering and currently he is candidate of Phd degree at university of Zanjan (Zanjan,Iran). Cur-rently he is Managing Director of AEPDC (Alborz Electric Power Distribution Co), and part time ac-ademic member of Azad University (Karaj,Iran).
He is member of Iranian Association of Electric and Electronic Engineering, member of Iran grid relia-bility, power system research committee. His re-search interest includes the DSM (demand side management), Smart Grid and DG’s.
Saeid Jalizadeh was born in Salmas, Iran in 1962. He received his B.Sc. and M.Sc. degree both in electrical engineering from Tabriz University in 1986 and 1989, respectively. He received Ph.D. degree in electrical engi-neering from Iran University of Science & Tech-nology in 2005. Currently, he is an Assistant Professor at Technical Engineering Department of Zanjan University, Zanjan, Iran. He is the author of more than 60 journal and conference papers. His research interests are dynamic stability, power mar-ket, and renewable energy in power system, power system contingency analysis and power system planning. He is a member of the institute of elec-trical and electronics engineers (IEEE)