3
ANALYSIS OF THE LEVEL ACHIEVED BY VARIOUS SPECIFIC
RAIL TRANSPORTATION INDICATORS BY IMPLEMENTING ITT
Gheorghe-Stelian , PhD S.C. Alstom S.A. - Bucharest
sbalan_ro @yahoo.com
M , PhD
Institute for Economic Forecasting-NIER, Romanian Academy [email protected]
Abstract: Rail transportation is one of the transportation ways that continues to remain of high interest due to some certain advantages: it is the least polluting and most environmentally friendly ways of transport. These are but two of the reasons why for the last years based on the strategies adopted by various international bodies the attempt is made to develop and implement some programmes for reinvigorating rail transportation and
attracting increased traffic for this type of transportation.
An important role in developing transports by and large and rail transportation in particular is played by technological innovation. This constitutes and will continue to be an important source of contributions for solving transportation issues. The rail traffic management systems might optimise the use of the network and improve transportation safety.
Technology (ITT) in the field of transports. Such applications are developed for various means of transport, but also for favouring their interaction (including intermodal platforms).
Aligning the Romanian rail transportation to the European one meant also the implementation of the ERTMS/ETCS system in Romania. Implementing ITT in rail transports might improve significantly both the activity and services provided by this activity sector. Next to interoperability, ERTMS means also increasing the capacity of the infrastructure, increasing speed and diminishing production and maintenance costs, improving safety but also reconfiguring skills and expertise of the service personnel.
The present paper intends to analyse the impact of implementing the new technologies from ITT in rail transportation on some specific indicators for this sector of activity in view of identifying some viable solutions for increasing its efficiency in relation to other transportation systems, but also for counteracting the social effects generated by these technologies.
Key words: rail transport, ITT, productivity performance, socio-economic implications; ERTMS/ETCS;
4 Introduction
In a broad (economic and social) understanding, the information and telecommunications technology (ITT) entered societies and economies in a way no one could have anticipated only a short time ago. In particular, transportation systems underwent and will undergo substantial changes due to market openness and innovation in the ITT field. The competitiveness of economies in general and, implicitly, of the rail transportation depends on the capacity of the respective entities (economies and companies) to adjust to innovation and new market requirements.
Implementing in r
marketing policy by promoting the social effects/benefits for customers (positive externalities); improving the transparency of processes and information management by which are facilitated the processes of planning and decision-making; creating opportunities for externalising specific economic processes; diminishing exploitation and maintenance costs for the rail infrastructure and the used superior rolling material; increasing the transportation capacity by increasing the tonnage of the freight trains as result of using locomotives with superior traction and intelligent waggons, and by increasing the number of trains for the same towing section by making use of traffic management systems for the entire territory of the member countries; diminishing the time of trans-border operations by using modern multi-power locomotives that might operate on various systems of electric traction and by using the single signalling system ERTMS/ETCS which eliminates the need of changing locomotives on crossing from one country to another; increasing the number of transported passengers on the railway by implementing audio-visual and internet apps.
The transportation system is very important for achieving the objectives of sustainable development in the context of the Information Society.
The ITT solutions applied by the Romanian rail transportation are still fragile but aligned to the EU standards of interoperability (TAF-TSI).
In Romania the ERTMS/ETCS system is implemented on less than 500 km of rail and follows to be implemented first on the Pan-European corridors crossing the country and thereafter for the rails making the connection between the corridors IV and IX, as well as on the TEN network on the national territory. Because of lacking funds from the state budget and poor absorption of European funds for the Romanian rail system, new locomotives cannot be purchased from the traditional manufacturers of rolling material, the only option being to modernise the locomotives with control and command systems that allow for diminishing electric power consumption, facilitate train driving and lower maintenance operations and costs. The cost of the modernization is by about 50% less than the price of a new locomotive.
In Romania, the implementation of the ERTMS system is at the beginning; implementing in pilot regime the ETCS Level 2 system on the 5100kW electric locomotive with the number 0538 allows, in correlation with the modernisation of the infrastructure, to achieve speeds of 160km/h. After 9 years as of making this locomotive operational, it continues to be the only one in Romania equipped with the
The lack of strategy for reinvigorating rail transportation in Romania represents one of the main reasons for the high delays recorded in implementing the ERTMS/ETCS system, as to this is added also the poor capacity of the management and implementation bodies.
5 The data regarding the level of implementation for ERTMS in EU were available for the year 2015. The gaps between the data sets are determined by the interval between the time of ETCS implementation and the one of visible effects emergence with regard to productivity; as result, the data used for evaluating the impact of implementing ERTMS on rail transportation productivity complies with the definition of cross-section series, and the differing reference timeframes of the data have rational support.
The estimates realised by the cross-section method have led to positive correlations between the variables of the automation degree of some subsectors of the rail transport (interoperability, speed and high transportation capacity, safety, modernising signalling and rolling material) and the level of increasing productivity.
1. Estimates of ITT implementation impact on the productivity of rail transportation
In the specialised economic literature, ITT implementation is regarded as key-factor in increasing productivity. Up to date, despite all visible progresses recorded by the rail industry and in the activity of rail operators, fewer efforts were made for quantifying the ITT contribution to the productivity of rail transports.
Methodology and used data
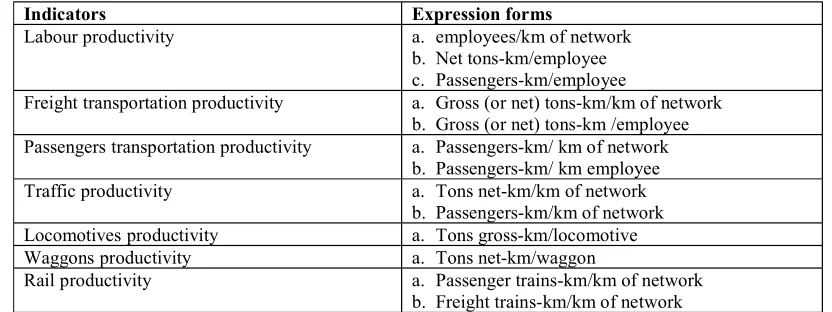
In 2000, the Inland Transport Committee of the United Nations Economic Commission for Europe (UNECE) defined a common framework for measuring the productivity of the rail transportation. This definition resulted from a double necessity: on one hand a system for evaluating national rail systems was necessary and, on the other hand, due to the strong interlinking of European countries this evaluation system needed to be unitary for allowing the comparison of national performances. Thus, a series of indicators were defined that would reflect best the productivity level of the rail system and that are presented in the table hereunder:
Table 1 Indicators for expressing the productivity of the rail system
Indicators Expression forms
Labour productivity a. employees/km of network b. Net tons-km/employee c. Passengers-km/employee
Freight transportation productivity a. Gross (or net) tons-km/km of network b. Gross (or net) tons-km /employee Passengers transportation productivity a. Passengers-km/ km of network
b. Passengers-km/ km employee Traffic productivity a. Tons net-km/km of network
b. Passengers-km/km of network Locomotives productivity a. Tons gross-km/locomotive Waggons productivity a. Tons net-km/waggon
Rail productivity a. Passenger trains-km/km of network b. Freight trains-km/km of network
Source: The Committee for Internal Transports of the United Nations Economic Commission for Europe
6 The data contained in the report of the United Nations Economic Commission for Europe (UNECE or ECE)1 regarding rail transportation productivity, and statistics of the International Union of Railways (UIC)2 were used for the proposed analysis.
The data regarding the level of implementing ERTMS in Europe are taken over from the European Commission3 and from Eurostat statistics. For a better comparison between countries, the data were normalised with the length of the railway network corresponding to each country.
In the framework of the analysis were used also data regarding the ETCS-Net network defined according to the Decision of the Commission (2006/679/EC) from 28 March 2006 regarding the interoperability technical specification within the control-command and signalling subsystem for the conventional Trans-European Railway System4. The length of the rails endowed with operational ETCS, either contracted or planned, is as well a good indicator of the level of implementing ITT in rail transports. The source of these data is the ERTMS Atlas5. In this case as well, for better comparison, the length of the ETCS routes was normalised with the dimension of the national railway networks.
The poor availability of data determined the cross-sectional type data input of the analysis. These are sets of one-dimensional data corresponding to some subjects (which can be indicators, economic entities, sectors of activity, regions, countries, etc.) at a given time6. In the case taken into account, the data refer to the productivity of the rail transportation in member-countries of the European Union. The data used comply with the following: definition of cross-sectional series, and the various moments of collecting the data have a theoretic background.
The analysis of the cross-sectional data differs from the one of chronological data which approaches the evolution of an economic process or phenomenon in time, and the one of panel data studying the evolution in time of several indicators. The object of the cross-sectional analysis is, actually, highlighting the difference between the subjects, in our case the comparison regarding the productivity differences of the rail transportation in the member-countries in correlation with the level of implementing ERTMS/ETCS. By this approach is attempted to identify the influences of implementing the new control system of the railway traffic on the efficiency of the rail transportation.
By means of unifactorial regression is analysed the simplest relationship between the two variables, respectively the linear relation. According to it, the values of the elements of one variable may be estimated by multiplying them with a fixed coefficient of the elements of the other variable and by adding a constant: . If a linear relationship exists between the level of ERTMS implementation and the productivity of the rail system, this would prove that a higher level of implementing ERTMS coincides with a higher efficiency of railway transportation.
In this context, was realised as first state a descriptive analysis of the Romanian railway transportation within the Union from the perspective of the productivity indicators. The second part is
1 The United NationsEconomic Commission for Europe, Inland Transport Committee, Working Party on Rail Transport, Productivity in Rail Transport (ECE/TRANS/SC.2/2012/5 and (ECE/TRANS/SC.2/2014/6): www.unece.org
2Railway Statistics,2014-2016 Synopsis, International Union of Railways, www.uic.org
3 European Commission, Staff Working Document of the Commission of the state of play of the implementation of the ERTMS Deployment Plan, SWD(2014) 48 final, Brussels, 14.2.2014, and Commission Implementation Regulation (EU) 2017/6 of 5 January 2017, on the European Rail Traffic Management System European deployment planhttp://ec.europa.eu/ transport
4 http://eur-lex.europa.eu/LexUriServ/LexUriServ.do?uri=OJ:L:2006:284:0001:0176:EN:PDF
5 ATLAS of ERTMS Worldwide Implementation, International Union of Railways (UIC), http://www.uic.org/html/ertms-conference2007/conferences/2007/docs/Atlas-ERTMS.pdf
7 focused on studying the relationship between the level of ERTMS/ETCS implementation and the productivity of the railway systems by means of unifactorial linear regressions.
The descriptive analysis of the Romanian railway system was made by means of the data supplied by the productivity report drafted by UNECE and by the UIC statistics. Because the comparison with each of the other countries mentioned in the report might prove as inopportune, an option was made for comparing the situation of Romania with various aggregates of the European countries.
In the Romanian railway system, the number of employees in relation to the length of the railway is higher than the European average EU-28 for 2012, but much lower in 2015 (Figure 1).
The Romanian railway system had a high number of employees but that decreased significantly on a yearly basis, these being a factor that led to considerably less activity of the system than the
persons/km.), and freight transport (measured in tons/km) to the number of employees results a performance of 255 units in the case of Romania, as compared with the EU-28 average of 609 in the year 2012, and 150 units for Romania and 717 units for the EU-28 in 2015.
Figure 1 Labour productivity in railway transportation in Romania and EU-28
Data source: Study on the Cost and Contribution of the Rail Sector, Final Report September 2015, European Commission, www.eu.europe.eu/transport and Railway Statistics, 2014-2016 Synopsis, International Union of Railways, www.uic.org,
The analysis of this indicator on the two branches highlights the fact that the low productivity transportation (Figure 2). For a Romanian employee there are 41 passengers/km. while the European average is by over six times higher (282 persons/km./employee).
average and against the EU-11 average regarding freight transportation. It is interesting that in the countries of the former communist bloc, freight transports on the railway is still at a very high level, comparable with the European average.
The degree of using railways in Romania is much lower as compared with the other European
transport in Romania is of 1309 units, while the European average is of 2886.
0 100 200 300 400 500 600 700 800
0.0 1.0 2.0 3.0 4.0 5.0 6.0
EU -28 Ro EU - 28 Ro
2012 2015
8 Figure 2 Productivity of railway transportation related to the number of employees within the
sector in Romania and EU-28 in 2015
Data source: Railway Statistics, 2014-2016 Synopsis, International Union of Railways, www.uic.org,
communist countries; however this is six times less productive than the average of the EU-28 countries. These outcomes deno
including here Romania. Nevertheless, the other former communist countries have developed freight transportation more than Romania.
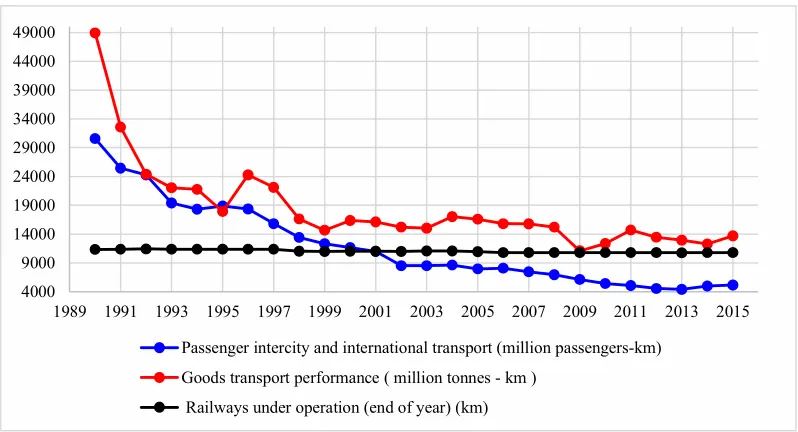
Romania measured about 11348 kilometres. Comparatively, freight was transported by 9.4 times more (48912 mill. tons/km) on the railway in the year 1990 than in 2015 (13673 mill. tons/km.). The analysis of the diagrams in Figure 3 highlights the collapse of the CFR (Romanian Railways Company) together with the economic downfall of the period. In three years, 1990-1992 the volume of transported freight decreased from 48912 mill. tons/km to 24387 mill. tons/km. The activity of CFR-Freight decreased even more in the following years, reaching its minimum in 2009: 11088 mill. tons/km.
mill. passengers/km. which is the maximum for the period under consideration. After 1990, the number of passengers decreased constantly, reaching only 5149 mill. passengers/km., respectively 7 times less than in the year 1989. Thus, the low productivity of the railway transportation system in Romania can be explained: an extended infrastructure requires numerous human resources for a poor, much under its actual potential, activity.
0 50 100 150 200 250 300 350 400 450
Tonnee km / employee Passengers km / employee
9 Figure 3. Evolution of railway transportation from Romania, in the period 1990-2015
Regarding the activity of trains considerable gaps exist between Romania and the EU-28: the EU-28 performance is almost double. As expected, the productivity of locomotives and waggons is also much under the European average.
2. Analysis of the ERTMS/ETCS impact on the performance of the public railway transportation system
The econometric analysis attempts to answer the question whether the implementation of the ERTMS/ETCS system in Europe led to increased productivity of the railway transportation. In economic terms, increasing efficiency means better use of infrastructure, rolling material and of the personnel employed in railway transportation.
An in-depth analysis of this phenomenon would require European level series of data that would contain several years, respectively panel-type data. These would show the evolution over time for each country. However, the poor availability of data restricts the econometric analysis to one of the cross-sectional type.
The statistical instruments employed most often to analyse the links existing between two variables are correlation and regression. The correlation model shows how strong is the link, how much the two variables tend to change together, and the regression model is used in explaining and forecasting the values of one variable based on the values of another variable.
The Pearson correlation coefficient not only shows the direction of the link but also its intensity. The value of the correlation index is situated between -1 and 1, where 1 indicates a perfect direct linear correlation, while -1 denotes a perfect reverse link. The zero value shows the missing link between the two studied variables.
4000 9000 14000 19000 24000 29000 34000 39000 44000 49000
1989 1991 1993 1995 1997 1999 2001 2003 2005 2007 2009 2011 2013 2015
Passenger intercity and international transport (million passengers-km) Goods transport performance ( million tonnes - km )
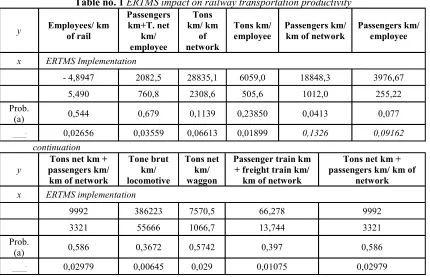
10 The impact of implementing ERTMS/ETCS on railway transportation productivity In order to study the impact of implementing ERTMS on some component elements of railway transportation productivity in EU was used the cross-section method. The obtained results are synthetically presented in Table 1 from the Annex.
The analysis of these results highlight that implementing ERTMS leads to railway transportation increased efficiency by a 1 pp increase of ERTMS implementation, the number of employees will diminish by about 5%, the volume of freight/km per kilometres of network grows, and the productivity
realised based on the hypothesis of a confidence threshold , of 10%, which means that the coefficients of the exogenous variable might be considered as significantly different from zero under the conditions
where .
From the viewpoint of the confidence threshold, in analysing the results from Table 1 of the Annex as significant might be regarded the coefficients of the regressions corresponding to freight and
In this context, it might be noticed that the level of implementing ERTMS has a favourable influence on the producti
(1).
Where:
ERTMS represents the level of implementing ERTMS;
productivity develops depending on ERTMS; represents the free term, and is the error term.
The estimated regression coefficients both in case of the relation to the number of employees within the railway system, and to the dimensions of the railway network are significant, the confidence thresholds being of 5% in the first case, and 10% for the second one. The estimated values of the parameters are:
(2)
(3)
where , and
The correlation coefficient is by 0.36 in the case of the relation to employees and by 0.41 in the case of the relation to the dimension of the railway network.
Regarding the determination relationship, its values show that the percentage resulting from the variation of the endogenous variable due to the implementation of ERTMS is very low (e.g. 13.3%, from
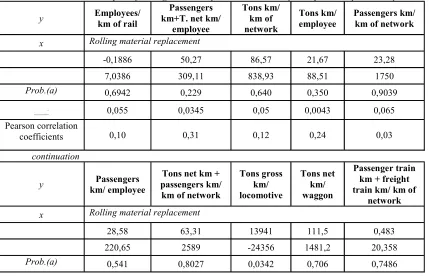
The analysis of the impact of implementing ERTMS on the level reached by various indicators specific to railway transportation (interoperability, high speed and high transportation capacity, safety, the replacement degree of signalling and of the rolling material) by the cross-section method based on the same hypotheses about the significance threshold of the estimators highlighted positive correlations but weak as intensity, varying between 0.2 and 0.31 (Table 2 of the Annex).
The determination relationship has low values confirming that on optimizing these indicators contribute, next to ERTMS, other factors as well.
The relationship between the ER
11 Where: represents the speed and capacity increase of railway transportation,
is the regression coefficient which designates the extent to which speed and transportation capacity vary depending on the level of ERTMS implementation,
represents the free term, is the error term.
The estimated value of the parameters is:
Implementing ITT in certain subsectors of railway transportation leads to its increased productivity. The study of the impact of implementing ITT for interoperability in each of the compartments for the productivity of the railway transportation was realised by the cross-section method. The equations have the form:
(5) where: is the endogenous variable corresponding to a country ;
is the exogenous variable corresponding to the country ;
represents the regression coefficient designating the extent to which y developes depending on x in the country i;
is the free term; is the error term.
The results of the regression equations are presented in Tables 3 and 4 of the Annex.
The link between speed and the transportation capacity and the level of labour productivity in railway transportation was realised with the help of a regression equation of the form:
(6)
where:
- the speed and capacity increase of railway transportation as result of implementing ERTMS.
The significance threshold by 10% and a value of by 32% confirm the existence of a close link between the two variables (Table 3 from the Annex). The estimated value of the parameters is:
The correlation coefficient between labour productivity in the railway transportation system and the speed and capacity of the railway transportation network is 0.6. In accordance with the results of the regression, the correlation shows a direct link between the two variables.
Implementing ITT for rolling material has implications on rendering efficient railway transportation. By regressing the productivity of locomotives depending on the replacement level of the rolling material a positive link is noticed, which is statistically significant for a threshold of 5% (Table 4 from the Annex). This result confirms that the new locomotives and waggons have better performance than the old ones, as they have the capacity to transport higher quantities in shorter time.
The regressionequation has the form:
(7)
where: designates the productivity of locomotives expressed in tons/km per locomotive
12 The estimated value of the parameters is:
The Pearson correlation coefficient is 0.52 confirming the existence of a positive direct link between the replacement of the rolling material (new or modernised) and the productivity of locomotives.
Even if in Romania modernisations were made for the rolling material, still the productivity of the locomotives is between the lowest ones. This situation might be explained by the presence of many locomotives in the rolling material park of CFR. However, a good part of these locomotives are depreciated from the technological point of view and are no longer in use or are inoperable due to the lack of spare parts.
Conclusions
As result of implementing ITT in railway transportation all activities are influenced within the sector. The increase in the productivity of the railway transportation and implementing ITT in the sector are two strongly correlated variables.
At the level of the European Union or of the empowered bodies in the field of railway transportations are made available databases referring to the implementation level of these systems for the whole sector and on sub-fields. The poor information which are retrievable in the UN, European Union, or the European Commission and UIC databanks or by inquiry to other bodies in the field are incomplete and most often than not contain data older than 5 to 6 years. At the same time, most of the supplied data are the result of surveys realised at the level of railway companies in Europe. This makes the existing data to be available only at the level of a single year.
In this context, the analysis regarding the ITT impact on railway transportation productivity was made based on cross-sectional-type data for a series of European countries. The data regarding the level of implementing ERTMS dates from 2008 and the variable on which it impacts, respectively the productivity of railway transportation is at the level of the year 2015. This time gap is natural due to the fact that the effects of implementing ETCS on productivity may be quantified after a couple of years after implementing the system.
By detailed analysis was highlighted:
the implementation of ERTMS is one of the factors leading to increases of productivity for railway transportation; as result of this fact, the determination coefficient has low values, varying between 1-29%;
the coefficients of the regression equations reflect the logical link between the considered variables. Thus, by implementing ERTMS the numbers of employed personnel is diminished by about ctivity is improved (by 28835.1 tons/railway network, respectively by 18848.3 passengers/km/ network);
the study of the impact of implementing ERTMS on some specific indicators of railway transportation highlighted the existence of positive results. A significance threshold of 10% and a value by 0.32 confirm the existence of a close link between the ERTMS variables and the high speed and capacity of transportation;
the analysis of the impact of implementing ETCS on productivity led to obtaining the right links between the two variables;
13 The automation degree of some subsectors from railway transportation (interoperability, speed and transportation capacity, safety, signalling and rolling material modernisation) influence the level of productivity increase for this sector. The estimates realised by the cross-section method led to positive correlations between the considered variables. The low number of observations determined the loss of statistical significance for some regression coefficients and thus to the low values of the determination relationship.
Because the econometric estimates were based on few observations, relevant conclusions cannot be drawn regarding the impact of ITT on productivity increase.
Moreover, the evaluation of the socio-economic impact of implementing ITT in railway transportation should be realised in a first stage at firm and subsector level and only thereafter at aggregate level.
Table no. 1 ERTMS impact on railway transportation productivity
y Employees/ km of rail
Passengers km+T. net km/ employee Tons km/ km of network Tons km/ employee Passengers km/ km of network
Passengers km/ employee
x ERTMS Implementation
- 4,8947 2082,5 28835,1 6059,0 18848,3 3976,67
5,490 760,8 2308,6 505,6 1012,0 255,22
Prob.
(a) 0,544 0,679 0,1139 0,23850 0,0413 0,077
0,02656 0,03559 0,06613 0,01899 0,1326 0,09162 continuation
y passengers km/ Tons net km + km of network
Tone brut km/ locomotive Tons net km/ waggon
Passenger train km + freight train km/
km of network
Tons net km + passengers km/ km of
network
x ERTMS implementation
9992 386223 7570,5 66,278 9992
3321 55666 1066,7 13,744 3321
Prob.
(a) 0,586 0,3672 0,5742 0,397 0,586
0,02979 0,00645 0,029 0,01075 0,02979
Table no. 2 ERTMS impact on some railway transportation indicators
y Interoperability High speed/ capacity Safety replacement Signalling Rolling material replacement
x Implementarea ERTMS
11,18143 33,26674 28,22674 14,92884 17,98836 7,594899 5,844793 6,538336 5,478053 4,428013
Prob. (a) 0,5523 0,1594 0,2548 0,4077 0,2701
R2 0,038570 0,064831 0,022713 0,016566 0,017616
Pearson correlation coefficients
14 Table no 3 Impact of speed and transportation capacity increase on railway transportation productivity
y Employees/ km of rail km+T. net km/ Passengers employee
Tons km/ km of network
Tons km/
employee Passengers km/ km of network
x High speed and transportation capacity
-0,3183 62,33 78,31 14,70 156,5
8,1398 158,55 764,09 100,94 642,7
Prob.(a) 0,2889 0,0108 0,504 0,318 0,189
0,01287 0,3179 0,034 0,0042 0,0527
Pearson correlation
coefficients 0,26 0,60 0,17 0,26 0,33
continuation
y km/ employee Passengers passengers km/ Tons net km + km of network
Tons gross km/ locomotive Tons net km/ waggon Passenger train km + freight train km/ km of
network
x High speed and transportation capacity
47,65 234,8 5721 -240,5 0,2111
57,44 1406,7 7362 2464,5 19,3413
Prob.(a) 0,0954 0,130 0,192 0,1887 0,825
0,1192 0,0888 0,051 0,053 0,0631 Pearson
correlation
coefficients 0,42 0,38 0,33 0,33 0,05
Table no.4 Impact of rolling material replacement on railway transportation productivity
y Employees/ km of rail km+T. net km/ Passengers employee
Tons km/ km of network
Tons km/
employee Passengers km/ km of network
x Rolling material replacement
-0,1886 50,27 86,57 21,67 23,28
7,0386 309,11 838,93 88,51 1750
Prob.(a) 0,6942 0,229 0,640 0,350 0,9039
0,055 0,0345 0,05 0,0043 0,065
Pearson correlation
coefficients 0,10 0,31 0,12 0,24 0,03
continuation
y km/ employee Passengers passengers km/ Tons net km + km of network
Tons gross km/ locomotive Tons net km/ waggon Passenger train km + freight train km/ km of
network
x Rolling material replacement
28,58 63,31 13941 111,5 0,483
220,65 2589 -24356 1481,2 20,358
15
0,0396 0,062 0,2168 0,056 0,059
Pearson correlation
coefficients 0,16 0,07 0,52 0,10 0,08
References
[1] A Vision For Railways in 2050
INNOVATION. Unleashing the www.internationaltransportforum.org
[2]Alexa C., (2001), , Editura ASE;
[3] Annual Report 2012, Community of European Railway and Infrastructure Companies (CER).
www.cer.be
[4] ATLAS of ERTMS Worldwide Implementation, International Union of Railways (UIC),
http://www.uic.org
[5]Bahuguna, R., K., (2010), ICT for Efficient Railway Infrastructure, www.irse.org;
[6] World Development Indicators, www. data.worldbank.org/indicator
[7] -Motyl A., (2010), Railway passenger transport decreased slightly at the beginning of 2009, Eurostat, Statistics in Focus 15/2010, http:// epp.eurostat.ec.europa.eu;
[8] Sisteme de management al traficului feroviar -feroviar.ro
[9]Callaghan P., (2006), A review of the use of information and communication technology to achieve transport policy goals, Forum for the Future, www.forumforthefuture.org;
[10]Caraiani Gh., (2001), Tratat de transporturi, Vol.
[11] stadiul punerii în aplicare al
Planului de implementare al ERTMS, SWD(2014) 48 final, Brussels, 14.2.2014, http://ec.europa.eu
[12] ei privind stadiul punerii în aplicare al
Planului de implementare al ERTMS, SWD(2014) 48 final, Brussels, 14.2.2014, and Commission Implementing Regulation (EU) 2017/6 of 5 January 2017, on the European Rail Traffic Management System European deployment plan http://ec.europa.eu/ transport
[13]
pentru Europa (UNECE), http://www.unece.org;
[14] Digital Agenda for Europe Annual Progress Report 2011, 22 December 2011,
www.eu.europa.eu
[15] Faza de modernizare a infrastructurii sistemului IRIS, S&T România, www.snt.ro
[16] Global Transport Scenarios 2050, World Energy Council, 2011, www.worldenergy.org
16
[18] Plan Strategic în Domeniul Transporturilor, www.mt.ro
[19]Porter D., (2002), Implementing ETMS in UK: Human Factors implications for Trein Drivers, http://www.intlrailsafety.com
[20] Railway Statistics,2014-2016 Synopsis, International Union of Railways, www.uic.org
[21] -SA, 2012-2016, www. cfr.ro
[22] Transport Feroviar
[23]Stancu M., (2005), Integrarea europeana a transportului feroviar din România, www.agir.ro
[24] Statistici Eurostat, www.eu.europa.eu
[25] Statistici UIC, www.uic.org
[26] Strategic Rail Research Agenda 2020 (SRRA), www,ec.europa.eu/.../rail/research
[27] Synopsis with 2014-2016 data, International Union of Railways http://uic.org
[28]The United Nations Economic Commission for Europe, Inland Transport Committee, Working Party on Rail Transport, Productivity in Rail Transport (ECE/TRANS/SC.2/2012/5 and (ECE/TRANS/SC.2/2014/6): www.unece.org
[29] White Paper,
144 final, http://eur-lex.europa.eu
[30]Whiteing T., Menaz B., (2009), Rail Transport Thematic Research Summary, European Commission DG Energy and Transport, Transport Research Knowledge Centre, www. transport-research.info;