Optimization of Ticket Sales for Tehran Azadi stadium with the Approach of Simulating Queuing Systems and MCDM
Ali Jamshidi* 1
M.Sc. Student of Sport Management, Faculty of Physical Education and Sport Sciences, Allameh Tabataba'i University, Tehran, Iran
Javad Shahlaee
Associate Professor of Sport Management, Faculty of Physical Education and Sport Sciences, Allameh Tabataba'i University, Tehran, Iran
Gholamali Kargar
Associate Professor of Sport Management, Faculty of Physical Education and Sport Sciences, Allameh Tabataba'i University, Tehran, Iran
Received: Noember 05, 2019; Accepted: March 01,2020
doi:10.22054/nass.2019.10760
Abstract
The purpose of the present study was to optimize and improve the status of ticket sales at Tehran Azadi Stadium and reduce customer waiting times in queues using methods Simulation and Multi-criteria decision making (MCDM). First, using objective observation and time-out, the waiting time for spectators in the ranks of the ticket and presentation and physical examination calculations and then using the simulation software, The entire service process has been simulated from the moment the ticket is purchased until the moment they enter the stadium, and the average waiting time for spectators in the queue for the provision of services is calculated. And then we look at the problems with ticket sales. Also, using interviews with elite and expert people, there are some ways to reduce waiting times for customers in the queue. And each of these views was examined using the simulation software; then scenarios were developed to improve the status quo and then, using multi-criteria decision-making methods, we ranked the scenarios and selected the best scenario.
Keywords: Ticket sale, Simulation, Azadi Stadium
1 * Author’s e-mail: [email protected] (Corresponding Author);
INTRODUCTION
Waiting in the queue, though unpleasant, is, unfortunately, part of the inevitable reality of life. In their daily lives, people are confronted with different types of queues that lead to the loss of their time, energy and capital. Time wasted in bus lines, dining and shopping and the like are tangible examples of this kind of waste in life. In today's societies, there are more important queues whose economic and social costs are far more than the simple examples above. These include urban traffic queues as well as queues at airports, ports, telecommunications establishments, and behind manufacturing processes. Overall, it can be argued that waiting in line is no longer an exception and has become a rule. But in today's competitive environment, organizations are successful in making efforts to improve their organization (Modiri & Anvari, 2013). Improving the quality of sports facilities is one of the issues that has always been of interest to the leading countries in the field of sports. In today's competitive world, customers and their satisfaction with the organization and its products are one of the important factors for the success and survival of organizations.
important factor in the growth and success and sustainability of organizations and as a strategic, effective and pervasive issue is on the management agenda of organizations.
This is because organizations have found that the lack of sufficient information about customer expectations and feedback on customer service perceptions will cause problems (Beheshtirad, 2012). Due to the high popularity of the sport of football and the Football lovers around the world and the high capacity of the stadiums, the quality of service in this field is very important. In this regard, (Florez, Muniz & Portugal, 2014), in a study of spectators at the Maracana Stadium in Rio de Janeiro, Brazil, during the 2013 Confederations Cup, found that the characteristics and factors affecting the quality of service to on-foot spectators. Includes: accessibility, convenience, reliability, ease of use, security, security and socialization; Also, (Bakhtiari, Sajadi, Heidary & Emami, 2011) examined the satisfaction of Iranian Premier League audiences, stating that spectators who use stadium services are dissatisfied with the service and consider it poor. (Theodorakis, Alexandris, Rodrigues & Sarmento, 2004), in their study, found that the aspects of service delivery demanded by users of sports centers focused more on equipment, facilities, abilities, and attitudes of staff, on the cost of attending centers and Points to the planning and tabulation of services provided.
A study examined the relationship between service quality with customer satisfaction and loyalty of public and private indoor sports sites in Urmia; their findings indicated that there was a significant relationship between service quality and its subscales including "program quality, The quality of the facilities, the quality of the interaction "with customer satisfaction and loyalty (Seyed Ameri, Bahrami & Sayadi, 2013). One of the components of service at stadiums is the ticket section, where a large number of fans arrive at the stadium at the same time for a match at a specified time. So in the ticketing section of the stadiums we will have a huge crowd of passionate fans who want to use the ticketing service in person. Service delivery has a significant impact on customer satisfaction and in the meantime customers' waiting times in service queues affect their satisfaction with the service (Jones & Peppiatt, 1996).
has always been one of the major topics in applied mathematics and research in operations. Almost all of us have experienced waiting in line. Investigating queuing systems and reducing the expected adverse effects has always been one of the major topics in applied mathematics and research in operations. Almost all of us have experienced waiting in line. Unfortunately, this phenomenon in our urban society, which is increasing in terms of population density and crowding, has caused customer dissatisfaction with these interpretations, which can be due to over-demand for inadequate service and other equipment. Due to lack of proper management and deployment of appropriate service systems.
waiting time of customers in the queue and to increase the efficiency of the clients and the number of outgoing customers.
METHOD
This article is applied in terms of information analysis. This research is a direct observation in terms of data collection methods. The research community also includes all the Premier League stadium matches in the Premier League in 1996-95 as well as the national team games in a total of 45 matches. The method of sampling in this study was Cochran's formula with 90% confidence level and 0.1 error level of which 16 matches were evaluated. For the purpose of this study, the data collected from the target stadiums include a set of data as follows:
Distributing spectators' arrival time to the stadium
Distribution of time between two arrivals
Distribute the accountability of servants
Pay rates for servants by miscellaneous jobs
Number of servants
The method of collecting data is a type of direct observation by the researcher. To simulate the system the required parameters of the problem are determined by timer and timer recording by stopwatch. But in the simulation section it should be noted that simulation is an example of a real operating system using a computer that tries to have all the features and parameters. Using simulation science makes studying on real systems much easier and easier to understand. The purpose of this work is to summarize a real model on a computer to find out what the results will be if the actual model is repeated several times in the future and how to improve it. It may be very costly for real systems whose replication function to study to identify its removable points, but it can be simulated using the computer and simulating the data without realizing it. We got the system working. The simulation software defines a unique atom in the software for each ticketing system component. These atoms (as shown in Figure 1) schematically represent the various parts of the stadium ticket:
Product atoms
Source atoms
Queue atoms
Sink Atom (Model Output)
A proper statistical test is now needed to check the normality of the data explaining the data, which is a good test for this purpose (Kolmogorov-Smirnov test). The results and findings of the research are presented in full. Once the validity of the simulated model has been verified and verified, it is time to present scenarios to improve the actual system process. Improvement scenarios come from experts in the field, but what's important in defining scenarios is that the scenario being defined must be enforceable and not far from the facts.
After the improvement methods or the same scenarios are presented, the changes are applied to the simulated model and the model is executed with new changes N times. Average results of model implementation with new changes are compared with average results of model implementation with previous status to determine to what extent the ticketing system process is improved in terms of costs and waiting times to introduce a superior scenario. But the point to note is that each scenario has its own advantages and disadvantages, for example a scenario that is very good in terms of reducing customer waiting time in the queue for ticketing may not be appropriate and costly to the organization. Be costly. Multi-criteria Decision Making (MCDM) methods can be used to solve this problem. In this study, two methods Analytical Hierarchy Process (AHP) and (TOPSIS) are used. The AHP method can be used when the decision-making process has several competing options and decision criteria. The criteria can be quantitative and qualitative. The basis of this method of decision-making lies in pairwise comparisons. The decision maker begins by providing the hierarchy tree of decision. The decision hierarchy tree shows the comparative factors and competing options evaluated in the decision. Then a pair of comparisons is made. These comparisons determine the weight of each factor in terms of competitor options. Finally, the AHP logic combines matrices from pairwise comparisons to make the optimal decision.
Yoon in 1981. This is one of the best multi-criteria decision making methods. In this method, in addition to considering the distance of an Ai option from the ideal point, it also considers the distance from the negative ideal point. This means that the chosen option should have the shortest distance from the ideal solution and at the same time have the shortest distance from the ideal negative solution.
RESULTS
Information on the data collected is from the average customer turnover time and average time served by ticket agents and law enforcement officers.
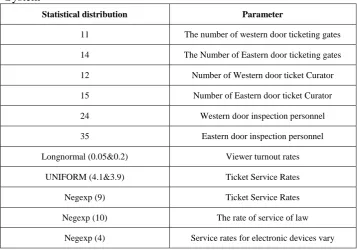
Table 1: Statistical Distribution of Information about the Games Ticket
System
Statistical distribution Parameter
11 The number of western door ticketing gates
14 The Number of Eastern door ticketing gates
12 Number of Western door ticket Curator
15 Number of Eastern door ticket Curator
24 Western door inspection personnel
35 Eastern door inspection personnel
Longnormal (0.05&0.2) Viewer turnout rates
UNIFORM (4.1&3.9) Ticket Service Rates
Negexp (9) Ticket Service Rates
Negexp (10) The rate of service of law
Negexp (4) Service rates for electronic devices vary
Figure 1: Simulated model of Azadi Stadium ticketing system in both east and west
We will now proceed to the validation of the simulation model, which at this stage aims to validate the model to ensure at one level that the output of the simulation model is equal to the output of the real world. That is, the real model is designed with the correct real world.
Table 2: Comparison of outputs of the simulation model with the actual
model over the remaining one hour until the start of the race
Simulated Model Output Output of desired paths in the real world
20098 14345
17870 263451
23251 13354
15985 23454
17870 15345
19645 25354
15120 14693
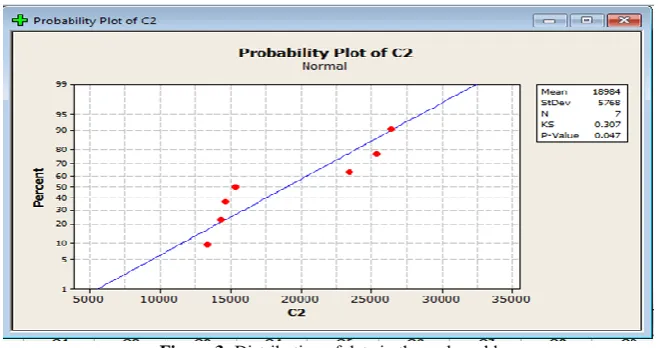
Figure 2: Distribution of data in the simulated model
Based on the output and the P-value, it can be concluded that the simulated model data follows the normal distribution.
Figure 3: Distribution of data in the real world
Given that the value of zero is in the range (-5300 and -7004), it can be concluded that the equality condition of the averages is confirmed and the model is well validated. Four benchmarks are now set to compare each of the management strategies to improve ticket status:
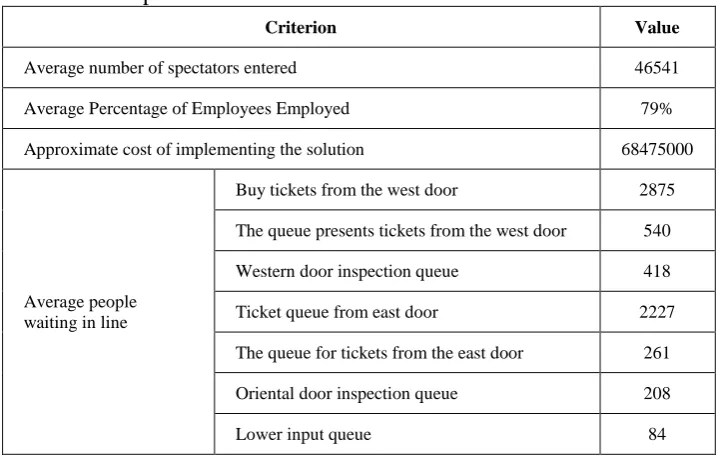
Table 3: Criteria and amounts of each of the two hours left to start the
match to compare scenarios
Criterion Value
Average number of spectators entered 46541
Average Percentage of Employees Employed 79%
Approximate cost of implementing the solution 68475000
Average people waiting in line
Buy tickets from the west door 2875
The queue presents tickets from the west door 540
Western door inspection queue 418
Ticket queue from east door 2227
The queue for tickets from the east door 261
Oriental door inspection queue 208
After determining the quantities of each criterion, the best management strategy should be selected from the strategies defined in the study. To do this, the importance of each criterion must first be determined using the experts who are the personnel of the Azadi Sport Complex. To do this, using the Questionnaire (AHP), expert opinions on the importance of each of the four criteria are identified.
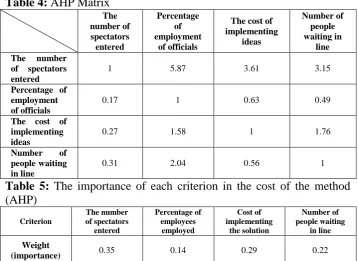
Table 4: AHP Matrix
The number of spectators entered
Percentage of employment
of officials
The cost of implementing
ideas
Number of people waiting in
line The number
of spectators entered
1 5.87 3.61 3.15
Percentage of employment of officials
0.17 1 0.63 0.49
The cost of implementing ideas
0.27 1.58 1 1.76
Number of people waiting in line
0.31 2.04 0.56 1
Table 5: The importance of each criterion in the cost of the method
(AHP)
Criterion
The number of spectators
entered
Percentage of employees
employed
Cost of implementing
the solution
Number of people waiting
in line
Weight
(importance) 0.35 0.14 0.29 0.22
We now present the following scenarios to improve processes where these scenarios can be defined and addressed in various dimensions and aspects. In order to rank the scenarios, we use (MCDM) methods and the purpose is to simulate the analysis of different scenarios and analyze them.
1- Increase the number of inspection forces
2- Adding unused capacity to ticket stadium services
3- Increase the number of ticket holders and law enforcement personnel
4- The process of buying tickets online
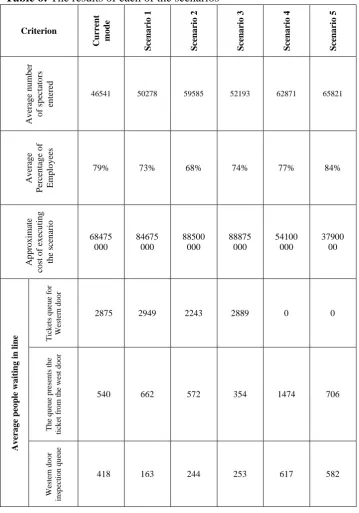
Table 6: The results of each of the scenarios Criterion Curr en t m o d e S ce n a rio 1 S ce n a rio 2 S ce n a rio 3 S ce n a rio 4 S ce n a rio 5 Av era g e n u m b er o f sp ec tato rs en tere d
46541 50278 59585 52193 62871 65821
Av era g e P erc en tag e o f Emp lo y ee s
79% 73% 68% 74% 77% 84%
Ap p ro x ima te co st o f ex ec u tin g th e sc en ario 68475 000 84675 000 88500 000 88875 000 54100 000 37900 00 Av er a g e p eo p le wa iti n g i n li n
e Tick
et s q u eu e fo r W est er n d o o r
2875 2949 2243 2889 0 0
Th e q u eu e p re se n ts t h e ti ck et f ro m t h e w es t d o o r
540 662 572 354 1474 706
W est er n d o o r in sp ec ti o n q u eu e
Ti ck et q u eu e fr o m e ast d o o r
2227 2239 2403 2154 0 0
Th e q u eu e p re se n ts t h e ti ck et f ro m t h e ea st d o o r
261 219 368 166 798 564
Ea st er n D o o r sec u ri ty l in e
208 43 118 83 349 312
D o w n st ai rs en tr an ce q u eu e
84 217 167 105 111 116
Now, we will rank the proposed solutions by the TOPSIS method. First we draw the decision matrix consisting of criteria, weight of criteria and solutions, and then the decision matrix is normalized and then we rank the solutions according to the criteria we consider. Expert opinions are taken and applied.
Table 7: Decision Matrix in TOPSIS Method
Criterion 0.35 0.14 0.29 0.22
+ + - -
The number of spectators entered
Percentage of employees employed
Cost of
implementing the solution
Number of people
waiting in
line
Solution 1 50278 73 84675000 6492
Solution 2 59585 68 88500000 6115
Solution 3 52193 74 88875000 6004
Solution 4 62871 77 54100000 3349
Solution 5 65821 84 3790000 2280
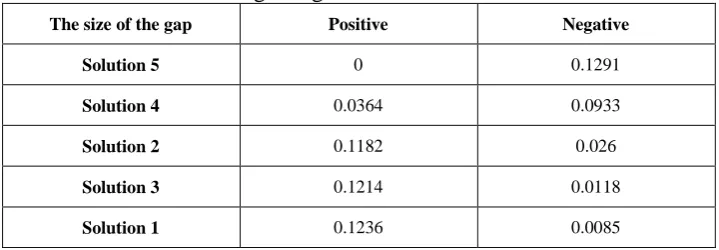
Table 8: Scenario ranking using TOPSIS method and criteria
The size of the gap Positive Negative
Solution 5 0 0.1291
Solution 4 0.0364 0.0933
Solution 2 0.1182 0.026
Solution 3 0.1214 0.0118
Solution 1 0.1236 0.0085
In the TOPSIS method, the options fall between two ideals, positive and negative. The best option is to have the least distance with the positive ideal and the maximum distance with the ideal negative. According to the results of the method shown in the table above, Solution 5 is the best solution because it has the least positive ideal distance and the highest negative ideal distance. Solution 1 also shows the least improvement in ticket sales.
DISCUSSION
The results of the Azadi Stadium ticketing system analysis showed that at 95% confidence, with 2 hours remaining on the start of important games that would draw a significant number of fans to the stadium, Capable of providing services to approximately 46500 people; But most spectators who come to the stadium for important games are not fully satisfied with the ticketing system because it takes approximately 17 minutes for each person to get the ticket, submit it, and pass the physical inspection stage.
as each solution presented should be economically viable. Overall, the results of this study showed that if the online stadium ticketing system became both financially more cost-effective and by using this approach, more and more audiences would enter the stadium during the two-hour review period. By adopting Scenario 5, that is, buying tickets online and passing through electronic gates, the process of reaching the audience from the current 17 minutes is reduced to 8 minutes.
Adopting this scenario will also make Liberty Stadium more national as a national stadium and increase the international reputation of our country. The findings of the present study also confirm the findings of (Florez, Muniz & Portugal, 2014). The present study, which focuses on the facilities of the Freedom Stadium, is in line with the results of (Florez, Muniz & Portugal, 2014) on accessibility, proximity, and convenience. They found that the features that do not bother walking the stadium are the stadium's location characteristics, its surroundings, and its social characteristics. The present study also emphasized the spatial characteristics of Azadi Stadium. The results of this study are also in line with the researches of (Faraji, Bashiri, Yavari & Khoshnevis, 2016; Fatahi & Kashef, 2016; Ramezanian, Faraji, Khoshnevis & Danesh Sani, 2013) which were related to the quality of services provided in stadiums and sports facilities. That the quality of service provided and the satisfaction of the spectators has a great impact on the attendance of the spectators in these venues, during the performance of sports competitions.
CONCLUSIONS
match. Updating the ticketing system also raises the level of the country's soccer and improves the professionalism of international football.
REFERENCES
Bakhtiari, M., Sajadi, S. N., Heidary, A., & Emami, A. (2011). A Consideration of Spectators Satisfaction Regarding Different Services in Soccer Premier
League In azadi Stadium-tehran-iran. Procedia-Social and Behavioral
Sciences, 15, 1777-1779. doi:10.1016/j.sbspro.2011.04.001
Beheshtirad, Roghayeh (2012). [Investigating the Quality of Educational
Services through SERVQUAL Model and Its Relationship with the Evaluation of Faculty Members' Performance from the Viewpoint of the Students of the University of Urmia and Faculty of Nursing and Midwifery of Medical Sciences] (Master's thesis of educational management), Faculty of Literature and Humanities, Urmia University, Urmia, Iran, 6-12. [In Persian]
Chung, C. A. (Ed.). (2003). Simulation modeling handbook: a practical
approach. CRC press.
Faraji, Rasoul; Bashiri, Mahdi; Yavari, Yousef; & Khoshnevis, Farhad (2016). [Assessment of Customers’ Perception and Expectation of University’s Sports Facilities Service Quality using SERVQUAL Model (Case study:
Azarbaijan Shahid Madani University)]. Journal of Research in
Educational Sport, 4(11), 97-114. doi:10.22089/res.2016.847 [In Persian] Fatahi, Hooshyar; & Kashef, Mir Mohammad (2016). [An Investigation of the Effect of Intellectual Capital on Service Quality of Sport Facilities based on the Servqual Model with Mediating Role of Organizational Performance (Case Study: Sport and Youth Staff of West Azerbaijan
Province)]. Journal of Sport Management, 8(3), 421-437. Retrieved from
https://jsm.ut.ac.ir/?_action=article&au=340401&_au. [In Persian] Florez, J., Muniz, J., & Portugal, L. (2014). Pedestrian quality of service:
Lessons from Maracanã Stadium. Procedia-Social and Behavioral
Sciences, 160(Cit), 130-139.
Hwang, C. L., & Yoon, K. (1981). Methods for multiple attribute decision
making. In Multiple attribute decision making (pp. 58-191). Springer,
Berlin, Heidelberg.
Jones, P., & Peppiatt, E. (1996). Managing perceptions of waiting times in
service queues. International Journal of Service Industry Management.
7(5), 47-61. doi:10.1108/09564239610149957
Kleinrock, L. (1975). Queueing systems. Volume I: theory.
Kordnaij, Assadollah; Delkhah, Jalil. (2004). Customer Orientation and Customer Satisfaction Measurement Pattern (Banking Industry Pattern);
Modiri, M.; & Anvari, N. (2013). [A Desirable Model for Optimizing the Policy of Service to Customers with Simulation Queue and MCDM Approach].
Journal of Development & Evolution Mnagement, 5(12), 65-73. Retrieved from http://www.iaujournals.ir/article_398.html. [In Persian]
Mohammadi, K.; & Mohammadi, S. (2018). [Balance of production line and production system optimization with the help of hybrid simulation method and meta-heuristic algorithms (Case Study: Lavan Island Reservoir Project
at MFS Factory)]. In: National Conference on Industrial Engineering and
Management, 2018, December 12, Isfahan City Center, Isfahan, Iran.
Retrieved from
https://www.civilica.com/Paper-CHEMCONG01-CHEMCONG01_027. [In Persian]
Panico, J. A. (1969). Queueing Theory: A Study of Waiting Lines for Business,
Economics, and Science. USA: Prentice-Hall. 8-14.
Pardo, M. J., & De la Fuente, D. (2008). Optimal selection of the service rate
for a finite input source fuzzy queuing system. Fuzzy Sets and Systems,
159(3), 325-342. doi: 10.1016/j.fss.2007.05.014
Ramezanian, Mohammadrahim; Faraji, Rasool; Khoshnevis, Farhad; Danesh Sani, Kazem (2013). [A survey on service quality in university sports’ facilities based on SERVQUAL model (Case study: University of Guilan)]. Quarterly Journal of Sport Management and Development, 2(1),
65-83. Retrieved from
https://jsmd.guilan.ac.ir/index.php?_action=article&au=7279&_au. [In
Persian]
Seyed Ameri, Mir Hasan; Bahrami, Soran; & Sayadi, Mohammad Amin (2013). [surveyed relation between service quality with satisfaction and clientele’s loyalty of private’s and government’s sport locations in Urmia
city]. Applied Research in Sport Management, 1(3), 11-18. Retrieved from
http://arsmb.journals.pnu.ac.ir/?_action=article&au=10325&_au. [In
Persian]
Sharma, B., & Gadenne, D. (2001). An investigation of the perceived
importance and effectiveness of quality management approaches. The
TQM Magazine, 13(6), 433-443. doi:10.1108/EUM0000000006180 Silic, E., & Jadric, M., & Cukusic, M. (2010). Discrete Semulation and
Optimization of a Queuing System in a Bank. Sarajevo Business and
Economics Review, 30, 709-722.
Solomon, M., Bamossy, G., Askegaard, S., & Hogg, M. (2002). Consumer
behaviour: a European perspective (2nd ed.). UK: Prentice-Hall, 275-284. Theodorakis, N., Alexandris, K., Rodrigues, P. M. M., & Sarmento, P. J. (2004). Measuring customer satisfaction in the context of health clubs in Portugal.
International Sports Journal, 8(1), 44-53.
West, E. (2001). Management matters: the link between hospital organisation
and quality of patient care. BMJ Quality & Safety, 10(1), 40-48.
doi:10.1136/qhc.10.1.40
Zanakis, S. H., Solomon, A., Wishart, N., & Dublish, S. (1998). Multi-attribute
decision making: A simulation comparison of select methods. European