* Corresponding author: Mohammad Reza Monazzam, Email: [email protected]
Department of Environmental Science, Graduate School of the Environment and Energy, Science and Research Branch, Islamic Azad University, Tehran, Iran; 2Department of Occupational Hygiene, School of Public Health and Center for Air Pollution Research (CAPR), Institute for Environmental Research (IER), Tehran University of Medical
Sciences, Tehran, Iran.
Received June 11, 2013; Revised August 17, 2013; Accepted September 4, 2013
This paper is available on-line at http://ijoh.tums.ac.ir
ABSTRACT
Environmental noise pollution is among the most urban problems which can be caused due to real sources like traffic, train and virtual sources provided by rigid surfaces. One of the urban structures in which can perform as a virtual noise source are the installed gutters alongside highways. These structures are mostly used to pass the wastewater or the rainfall. In this research, the acoustical performance of a gutter when the receivers are located on the top surface of gutter or in its shadow zone is investigated. To compute the acoustical efficiency of gutters, a 2D Boundary Element Method (BEM) is used. Investigation on the top surface of a simple gutter has shown that the total sound pressure has been changed and results in some disturbance. Various shapes have been studied to decline such disturbance. It was found that sound pressure of the model with curved basement was scattered steadier and the sound pressure for gutter models with wide basement was lower than the ones with narrow basement. Efficiency of some designed models was also compared in the shadow zone. Increase in depth and wide of gutter models either on the top or bottom surface has enhanced the performance of simple reference model. Considering the insertion loss computations, the amount of overall improvement in models with higher depths was more than widen models because of shifting effective performance toward lower frequencies.
Keywords:Total Field, Insertion Loss, Gutter models, Boundary Element Method, Barrier efficiency
INTRODUCTION
In most recent studies, roadside noise barriers are considered as an effective structure to reduce the noise pollution in urban areas. Those structures used for other purposes in urban design can also be applied for noise reduction, although mostly they act as an imaginary source of noise. Median barriers are the common example of such structures. Median barrier are installed in the middle of highways to decrease the car accidents
between two opposite lanes. However they can be considered as a noise control measure, if they well designed. In this case, different configurations were tested to improve their performance [1]. Such improvement can also be increased employing various treatments such as reactive or absorptive surface [2]. However, if a median barrier will be erected near a roadside noise barrier, it should be studied as an extra surface that will reduce the efficiency of roadside barrier.
Gutters compared with noise barriers not only occupy any area, but also do not make any problems for urban designers from aesthetic point of view. Gutters with their edges can also act as a negative role for residents near highways. If these U-shaped structures behaved as an imaginary noise source, same as previous studies for acoustic barriers it is possible to decline their negative effect changing their shapes. Studies on gutter near roads were more noticed in waste researchers [3], while no study has been found in acoustic viewpoint.
Buildings as well as median barriers and gutters are the inseparable part in cities. Depending on the distance between building and highway, depth of building, standing on one side or both sides of highways, etc. the sound levels can be varied [4]. Multiple reflections and diffusive energy of sound waves between two sides of buildings increase the sound levels of traffic.
These three types of surfacees consist of buildings, median barriers and gutters are some kinds of virtual sourcesin open area in which they are different form real sources such as transportation noise (Train, car, aircraft) and construction machineries. Passive or active controls for real sources and passive and reactive control for virtual sources can be applied to decrease the emitted sound from them.
In this study, the acoustical effects of gutters on the receiver position and on the top field were tested to find out, whether a simple U- shape gutter have negative impact or not and also to find the appropriate shapes to diminish its negative effect.
MATERIALS AND METHODS
Boundary Element Method
Boundary Element Method (BEM) as an accurate and precise model, tested and verified in different studies, was used to calculate the performance of designed gutters [5-10]. This two dimensional method can be adjusted to a three dimension environment where the infinite coherent line source is parallel to the gutters.
Two parameters are used to predict the sound levels around roadside gutters including Total field and Insertion Loss.
1. Total field is computed by:
inc t p p TF 20log
(1)
Where
p
tis total sound pressure andp
inc isincident sound pressure.
As energy scatter pattern in shadow zone is not existed actually, the total area above the gutter especially close to model is considered to describe the top surface behavior of different shapes.
2. Insertion Loss Index is predicted by:
(2)
Where
p
gthe sound is pressure at the receiver withonly the flat rigid ground and
p
bis the pressure inpresence of both ground and gutter.
Roadside Gutter Models
Rigid gutters were divided into four groups in which all of them were compared with a simple common gutter; called reference model (model H). The first group consisted of simple gutters with similar width and depth compared with the reference model but different bottom shape (models A, B, C), the second group consisted of gutter with similar width, but lower depth and curved bottom configuration (model U), the third group with similar width and depth compared to reference model but wide bottom size (models D, E, F, G) and the last one had different widths and depths (models I, J). The detailed description of gutter models is defined in Table 1. To have an accurate comparison, most of the gutters have the same depths except for model I and U due to other purposes and except from model J, the width of top surface of gutter models are 0.4 m.
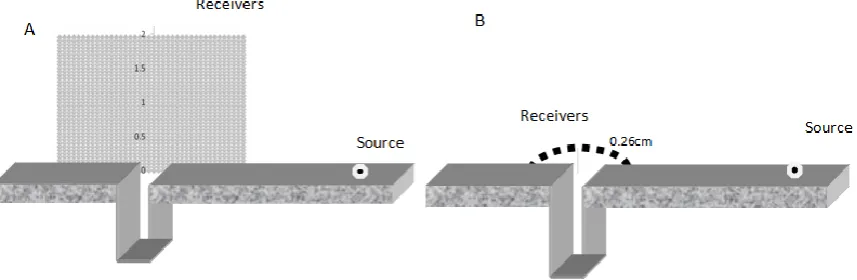
Fig 1. Schematic plan of gutter model H along with source and square receivers (A), hemicycle receivers (B)
The source is placed on the rigid floor with the distance of 4 meters from the gutter center except for those models that the ground is meshed; in this case source was located at coordinate 4, 0.02. To find the trend of sound pressure above gutter, receivers in total field computations are arranged in two different formats; 180 points and 1600 points on the top surface of gutter with hemicycle and square ornaments, respectively (Fig 1).
Note that in all computations the ground surface was assumed to be rigid. Receivers in IL calculations were arranged 1.5 and 3 m on the opposite side of source from the gutter and at heights of 1.5 and 3 m. The results for IL was computed over the range 50–4000 Hz while for Total Field the total sound pressure level were only tested from 200 to 400 Hz due to importance of low frequencies.
RESULTS
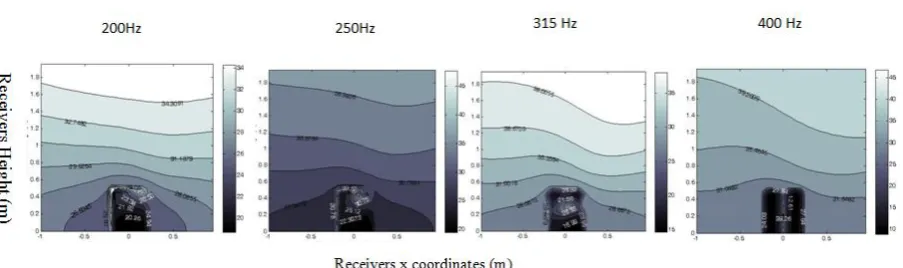
According to Fig 2, the performance of the simple gutter at different frequencies was varied and was in agreement with the previous studies on welled surfaces, where it was shown that the efficiency of such surfaces are frequency dependent [11]. The highest and the lowest resonant of well surface was occurred at frequency 400 Hz (1/3 octave band higher than resonant frequency of 315 Hz) and 250 Hz, respectively in which can be explained by the incident angle of wave with the well [12]. It is expected that if the source was located at the top of well; the angle of incident wave is normal, the highest resonant level will be occurred at 315 Hz.
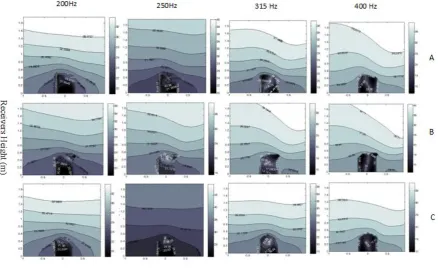
Fig 3 reveals the sound pressure propagation pattern above top surfaces of gutter models A, B and C at four various low frequencies. The resemblance between the
structure of model A and reference gutter makes similar scatter pattern. As model A is sloped toward source, most of waves are redirected toward source while the scatter pattern of sound pressure in model C was shaped upward at all frequencies. The presented structure in model C does not lead the waves to other sides. Although the constructive effect on the top surface of model A presents the positive effect of this model at frequency 315 Hz, amplification of various waves at all frequencies has led to an increase in sound pressure where the same decline in sound pressure was seen for model B at 200 and 250 Hz and model C at frequency 315 Hz. In all models, it can be observed that the sound pressure level at higher depths is decreased from low to high frequencies. Totally, in comparison to reference Fig 3. Contour plot of total field (dB) at 1600 receivers above models A, B and C at frequencies 200, 250, 315 and 400 Hz
model as there was no considerable change in structure of models, no significant improvements on the top surface of gutters is detected.
If the bottom of Ref model will be changed to a curved shape, a different scatter pattern can be seen (Fig 4). No significant resonant effect is seen in this particular shape, which can be explained by the curvy shape of the well's bottom.
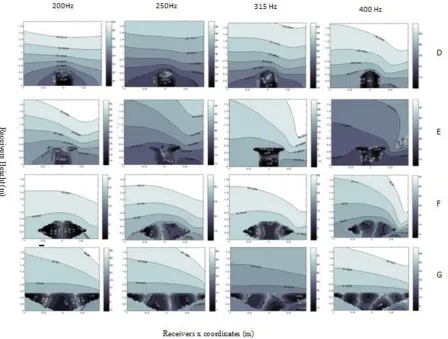
In this section, sound pressure distribution at structures with wider basement; models D, E, F and Gat four frequencies lower than 500 Hz in 1/3 octave band is discussed (Fig 5). Model D similar to model C redirects the incident wave upwards in which the only difference is an extra edge at the bottom part of model D. Existence of circle loop above model D at frequencies 250 and 315 Hz indicate that a constructive effect similar to what it was seen in model C was occurred. The sound pressure difference above both models was between 1 and 2 dB in which the reason for such low value is the structure of model D. Although change with surface impedance and environmental sound propagation has made some disturbances, decrease in sound pressure owing to constructive effect was also observed at some points. In both models G and
F, the numbers of loops was enhanced by an increase from low to high frequencies in which the constructive effect has declined the sound pressure and congestion subsequently.
The overall inside surface area is higher in these models compared with the previous stated models. Wider bottom provides more surfaces for wave reflection and outward wave time delay compared with the plain wells, which provided extended resonance areas especially for gutter models F and G.
One similar trend among all tested models is that the sound pressure propagation follows the gutter shapes and size at the very close areas above the gutter surfaces.
areas are covered with disturbance doubling the width. Totally, the effect of an increase in depth has shown better performance than widening the gutter on the top surface of gutter.
Besides, to provide better understanding of efficiency of gutter models, the gutter model F as an example of an effective gutter was compared with reference model H at 200 Hz in Fig 7. As it was stated earlier the high performance of gutters with wide bottom was because of their larger surfaces. Although no improvement can be seen on the heights higher than 0.5 m, the amount of sound pressure difference below 0.5 m above model F has been reached by 28 dB. In the mid shape of model F, the constructive effects between waves has made lower values in which in the worsen condition lowest values was equal to 2 dB. Totally, the sound pressure has been decreased in a wide area compared to model H.
Total Field Computations - Polar Response The polar response of some designed models was also calculated at 200 Hz in Fig 8. In most of the models the sound pressures similar to model H is propagated uniformly. As it was explained before, non existence of any edge in model U has made homogeneous condition. In other words, as it was found previously the wave reflection mostly follows the edge and angles of the bottom of gutter. In models F and G, the sound pressures are reflected upward in a small area. Comparison between models H and I also revealed that increase in depth of gutter can redirect part of the waves into the source position.
Insertion Loss computations
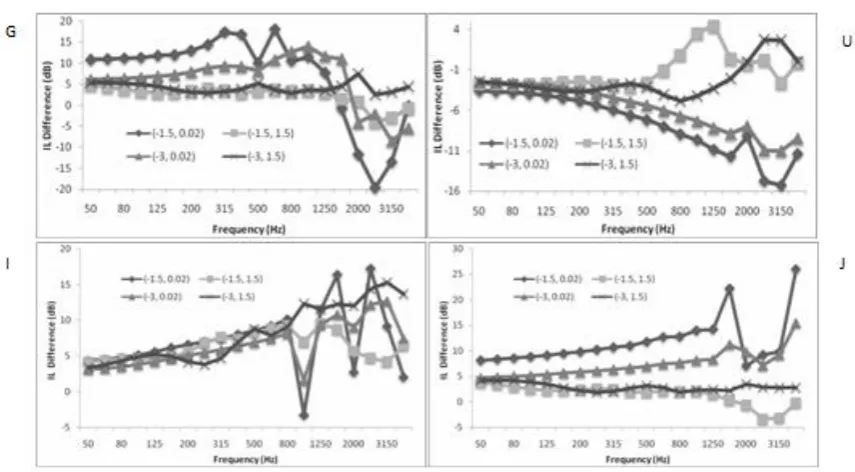
The performance of designed gutters when the receivers are located at the opposite side of the wells was also investigated in 1/3 octave band. The insertion loss difference in some designed models compared to model H is presented in Fig 9.
As there was no considerable change in insertion loss for models A, B, C, D, E and F compared to reference model, the performance of these figs was not presented. The wide basement of model G makes more insertion loss at the shadow zone as the waves moved through more distances and their energy is declined subsequently. In other words, it can be stated that the high effect of widening can be an appropriate method to increase the efficiency of gutters.
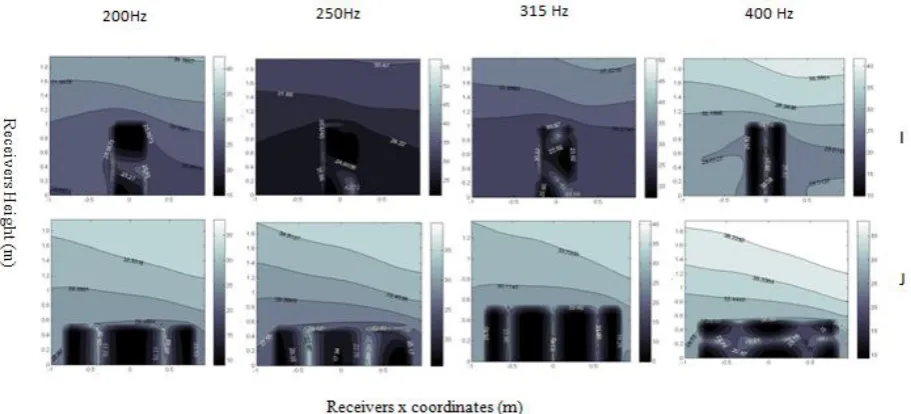
Fig 6. Contour plot of total field (dB) at 1600 receivers above models I and J at frequencies 200, 250, 315 and 400 Hz
Meanwhile, the effect of increasing the depth and widening the opening of gutters should not be neglected. There was an upward trend till 800 Hz in model I while it was accompanied with max and min points after this frequency in which except from one point, positive IL has been achieved. In comparison to model G, The designation of model I has covered the negative efficiency of model G at high frequencies. Also, considering model J it can be observed that the highest IL difference was 25 dB in which the trend of difference was smoother than other designed models. As the depth of model U was half of the reference model negative effect was achieved in most frequencies especially in receivers located on the ground and It is expected that if the depth of model U was same as model H, better efficiency could be achieved. The existence of peaks and valley at some frequencies in
presented figs was because of the constructive and deconstructive between incident and reflective waves.
DISCUSSION
This study predicts the acoustic efficiency of various gutters using two parameters of Total Field and Insertion loss. Considering the total field computations, when a simple gutter is located alongside the highways, some resonances were occurred on the top surface of gutter and caused an in increase in the sound pressure at this area. Thus to consider such resonant new shapes was designed. It was found that the efficiency of models with widen basement compared with narrow models was higher. Besides, the model with hemicycle bottom (model U) has shown low disturbance compared to other designed models due to its curved shape at the bottom. When the width of a simple gutter (model H) Fig 8. Polar response of some designed models at 200 Hz
Fig 9. The amount of reduction in insertion loss of designed gutter models compared to the model H in 1/ 3 octave band
was seen in barrier investigations [1] can enhance the efficiency. Model G with its wide basement hereof are among the appropriate models. In other words, if there were limitations for the depth and width of gutter, model G can be applied while in the case of no restrictions models with higher depths and wide structure are preferred such as model I or J. One of the negative points in model I in which can be criticized is the high depth of this model. This model is only designed to show the efficiency of depth and with an increase from 0.5 m to the ideal depth, more improvement obviously can be reached.
Although the level of occurred disturbance on the top of model J is higher than model I, this model was more effective than model I in the receiver zone. The amount of disturbance was varied depends on the depth of models. After passing the mentioned depth on the top surface of gutter, a steady sound pressure pattern was almost formed in which the lowest disturbance was at model U with its curved bottom shape.
CONCLUSION
Application of correct shapes of gutters can help to restrain the acoustic waves to get to receiver side. Although the amount of IL in gutters is not similar to barriers, it is possible to change the gutter's design acoustically when the municipality has decided to change the gutter or in the case of urban design. On the other hand, modifying the shapes of gutters is not the only way to increase the efficiency of gutters; other treatments such as installing two parallel gutters which can act like wells in diffusers or application of perforated sheets on the top surface of gutters are among other ways that should be investigated. Finally,
interest.
REFERENCES
1. Monazzam M R, Fard M B S.An investigation on the noise reduction performance of profiled rigid median barriers at highways. Noise and Health2011; 14(59): 135-139.
2. Monazzam M R, Fard, S M B.Performance of passive and reactive profiled median barriers in traffic noise reduction. J Zhejiang Uni. Sci. A (Appl. Phys & Eng) 2011; 12(1): 78-86. 3. Wahab M M A, Wang C, Vanegas-Useche L V, Parker G A.
Experimental determination of optimum gutter brush parameters and road sweeping criteria for different types of waste. Waste Manag 2011; 31(6):1109-20.
4. Chew C H.The influence of inclined buildingson road traffic noise. Appl Acoust 1995;45 (1): 29-46.
5. Watts G R, Crombie D H, Hothersall D C. Acoustic performance of new designs of traffic noise barriers: full scale tests. J Sound Vib 1994; 177: 289–305.
6. Crombie DH, Hothersall DC, Chandler-Wild SN, Multiple-edge noise barrier. Appl Acoust 1995; 44(4): 353–67.
7. Fujiwara K,Hothersall D C, Chul-hwan K. Noise barriers with reactive surfaces. Appl Acoust 1998; 53(4):225-72.
8. Baulac M, Defrance J, Jean P. Optimisation with genetic algorithm of the acoustic performance of T-shaped noise barriers with a reactive top surface. Appl Acoust 2008; 69:332-42. 9. Duhamel D. Shape optimization of noise barriers using genetic
algorithms. J Sound Vib 2006; 297: 432-43.
10. Baulac M, Defrance J, Jean P. Optimization of multiple edge barriers with genetic algorithms coupled with a Nelder–Mead local search. J Sound Vib 2007; 300:71–87.
11. Monazzam MR, Lam YW, Performance of profile single noise barriers covered with quadratic residue diffusers. Appl Acoust 2005; 66: 709-30.