301 International Journal of Transportation Engineering,
Comparing Methods of Ramp Metering for On-Ramps to
Improve the Operational Conditions at Peak Hours
Babak Mirbaha1, Ghodrat Eftekhari2, Sajjad Hasanpour3 Received: 07. 12. 2016 Accepted: 05. 06. 2017
ABSTRACT
This paper aims to evaluate and compare the effects of different methods of ramp metering on the operational conditions of traffic flow at three levels: the network level (including the freeway and its connected ramps), the entrance ramp, and the upstream segment of the entrance. To achieve this aim, one of the most important urban freeways in the metropolis of Isfahan was selected. The traffic volume passing through this freeway and its connected ramps were determined during peak hours (7 to 9 am), and the south band flows were simulated using microscopic analysis in AIMSUN software. After calibration and validation of the model, a specific on-ramp (the entrance ramp of Samadiyeh) was reviewed as the selected ramp, by using the fixed-time plan and ALINEA algorithm at demand levels of 100%, 110% and 80%. The results indicate that for normal demand level (100% demand), ramp metering does not have a significant effect on traffic flow. Further, ramp metering significantly improved upstream traffic flow in the freeway at high demand levels (110% demand), indicating its usefulness at high demand levels. At this demand level, ramp metering leads to traffic flow deviation. At low demand (80% demand), ramp metering increased the delay time of both the freeway and the ramp, indicating the ineffectiveness of ramp metering at low demands.
Keywords: Ramp metering, ALINEA algorithm, fixed-time plan
\
Corresponding author E-mail: bmirbaha@gmail.com
1- Assistant Professor, Dept. Civil Engineering, Imam Khomeini International University, Qazvin, Iran
Comparing Methods of Ramp Metering for On-Ramps to Improve the Operational …
1.
Introduction
In recent decades, population growth has caused a continuous increase in travel demand, resulting in traffic congestion of transport infrastructures and excessive safety problems. In addition, because of the high costs of land acquisition and construction of infrastructure, the negative impact of construction on the environment, and economic and political obstacles, building new facilities is not always feasible. In these conditions, transportation engineers look for ways by which they can achieve optimal use of existing facilities. Accordingly, with the development of new technologies, a new branch of transportation planning called Intelligent Transportation Systems (ITS) was created. Freeway Incident Management System (FIMS) is a subset of ITS and was designed for limited access facility to improve the movement of passengers and goods. The FIMS include field equipment (such as traffic detectors, variable message signs (VMS), and ramp metering controllers), telecommunication networks, traffic control centers, and operational personnel [Neudorff et al. 2003]. Therefore, a ramp metering controller is one of the useful tools in freeway and incident management system. Ramp control or ramp metering is one of the most effective methods widely used in freeway management system [Li et al. 2014]. It can improve performance in freeway traffic networks or sometimes it can reduce congestion and traffic emissions [Pasquale et al. 2016].The ramp controller is a set of traffic lights that are placed at the freeway on-ramp to adjust the movements of vehicles [Arnold, 1998; Hasan and Ben-Akiva, 2002]. Freeway ramp metering can be defined as a way to improve performance by limiting, regulating and timing the entrance of vehicles into the main line of the freeway [Papageorgious, 1991]. The aim of ramp metering is to optimize the freeway capacity by adjusting the demand of on-ramps in a way that the volume of the freeway is kept close to its capacity [Winyoopadit, 2007]. Some studies found out that it can work with
Babak Mirbaha, Ghodrat Eftekhari, Sajjad Hasanpour
303 International Journal of Transportation Engineering, methods, the metering rates are determined based
on field observations and traffic data so that the rate is constant during the whole predicted period of time. But in the traffic responsive control methods, the metering rates are determined by the current condition of the freeway [Papageorgious, 1991; Winyoopadit, 2007; Hoel, Garber and Sadek, 2011].
Based on the operational level, ramp metering methods can be classified into three groups: local (isolated) ramp metering, area-wide (coordinated) ramp metering, and hierarchical control [Papageorgious, 1991; Winyoopadit, 2007; Hasan and Ben-Akiva, 2002]. The local ramp metering is the process of selection based on the current conditions in the vicinity of a single on-ramp, regardless of the circumstances in the freeway segment. In this method, the most important priority is improving the conditions of the freeway at the corridor level [Jacobson, 2006].
The hierarchical control methods are a combination of local and area-wide methods. In this method, a system-wide optimization model exists at a higher level, which calculates the ideal situation of the network. Also, a local controller exists at a lower level, which modifies the metering in order to minimize the difference between the actual and ideal states of the network [Hasan and Ben-Akiva, 2002]. Some of the most important algorithms of ramp metering are Asservissement Linéaire d'Entrée Autoroutière (ALINEA), percentage-occupancy strategy and demand-capacity strategy. The most important algorithms of area-wide are: FLOW, SWARM, METALINE, Bottleneck, Zone Algorithm, HELPER and Fuzzy Logic Controllers (FLC) [Khaled Shaaban et.al 2016].
In Iran, no comprehensive study has been done to evaluate the effects of ramp controllers and the necessary conditions to implement them until now. Thus, paying more attention to the traffic management methods, including management of ramps and freeways, is necessary. The ALINEA algorithm which uses real-time occupancy measurements from the ramp flow merging area,
can be applied for local ramp metering. The merging area may be at most a few hundred meters downstream of the metered on-ramp nose [Yuheng Kan et al. 2016]. Therefore this algorithm has been used by many recent theoretical and simulation studies such as [Ismail M. Abuamera & Hilmi Berk 2017]
The aim of this study is to investigate the effects of the conventional methods of ramp metering on the operating conditions of traffic flow at three levels: network level (including the freeway and the ramps connected to it), on-ramp level, and the upstream segment of the freeway from the ramp. Because of high costs, time consumption and uncontrollable factors, such as weather conditions and accidents, the field study is very difficult, maybe even impossible. So, in this study, the micro-simulation method for traffic flow was used. The north-south flow of Kharazi freeway was chosen as the case study for the simulation model. The traffic inventory was obtained by field observations and the necessary data were determined. Then, the network was modeled, calibrated, and validated in AIMSUN software. Considering the necessary conditions for the implementation of ramp metering, the on-ramp of Samadiyeh was chosen, and it was controlled by using the fixed-time control method and the ALINEA algorithm for demand levels of 100%, 80% and 110%. The results were compared to the condition without the controllers.
2.
The Criteria for Ramp Metering
Design
Ramp metering will fulfill the intended purposes only if the on-ramp provides a sufficient length. Determining the minimum length of the ramp, which ensures optimal, efficient and secure performance, requires accurate calculation of several components. They are as follows [Chaudhary et al., 2004 and Jain, 2004]:
Comparing Methods of Ramp Metering for On-Ramps to Improve the Operational …
Figure 1.The design criteria for ramp metering (Jain, 2004)
These three components are shown in Figure 1. As Figure 1 shows, acceleration distance is the minimum length needed for the vehicle to reach the desired speed. In ramp metering, acceleration distance is the minimum length needed for vehicles that have stopped behind the traffic light of the ramp controller to speed up and achieve the safe convergence speed [AASHTO, 2006]. To determine acceleration distance, the tables provided by AASHTO were used.
Sight stopping distance and storage length are determined based on the geometry of the ramp, the installation location of the controller light, and the installation location of the detectors for queue elimination [Chaudhary et al., 2004]. Safe stopping distance is the minimum distance that a vehicle needs to safely stop at the end of the ramp and join the queue.
The Texas Transportation Institute suggests 250 ft. (76.1 m) as the minimum safe stopping
distance [Chaudhary et al., 2004]. To calculate the stopping distance, AASHTO suggests the following equation [AASHTO, 2006]:
3.
Location Selection
Suitable locations must be selected for data gathering in order to establish, calibrate, and validate the model. After reviewing the transportation network of Isfahan city, the third ring of the traffic network in the city was chosen for the study. Figure 2 shows the map of the third ring in Esfahan which the position of the studied freeway (Shahid Kharrazi Freeway) is shown in that and also it shows the details of ramps in the studied freeway. The data collection for the study was done on 12th October, 2013. Figure 3 shows the segments from which data collection was performed and also the access ramps to the under studied freeway.
Ramp controller Freeway
Adjacent Street
Babak Mirbaha, Ghodrat Eftekhari, Sajjad Hasanpour
305 International Journal of Transportation Engineering,
5235
The North-South Direction of Shahid Kharrazi Freeway
500
300
1552
845
1114
908
1446
1232
20
(A)
4694
1316 1238 1236 537 1323 677 1315 300 500
The North-South Direction of Shahid Kharrazi freeway
(B)
Figure 3.Traffic from the North-South Direction of Shahid Kharrazi Freeway and Its Connected Ramps (Passenger car); A: 7 to 8 am, B: 8 to 9 am
Figure 2.A: The third ring of the traffic network in Esfahan and the position of studied freeway in the ring, B: the details of different ramps in the studied freeway
Comparing Methods of Ramp Metering for On-Ramps to Improve the Operational …
Table1.The necessary conditions for implementing ramp metering
Peak-hour Volume (veh/h) Acceleration
Length (m) Storage
Length (m) Stopping Sight
Distance (m) Name of on-ramp
1342 98
202 44
Emam Khomeini
1422 105
205 44
Samadiyeh
871 90
161 44
Kohandezh
830 105
156 44
Atashgah
Table 2.Ramps physical characteristics
Length (m) Length of Acceleration
Lane (m) Name of on-ramp
78 69
Emam Khomeini
137 85
Samadiyeh
110 166
Kohandezh
93 100
Atashgah
The North-South Direction of Shahid Kharrazi Freeway
Vahid Bridge
Babak Mirbaha, Ghodrat Eftekhari, Sajjad Hasanpour
307 International Journal of Transportation Engineering,
3.1 The Chosen On-Ramp
Before using ramp metering, it is necessary to control the necessary conditions for its implementation in order to choose the proper ramp for the ramp metering. As shown in Figure 2, the last two on-ramps have low traffic flow; so, using ramp metering on these ramps is not logical. The required conditions to run the ramp metering is controlled on four other ramps. The results are shown in Table 1, and the position of the ramp can be seen in Figure 4.
According to Table 1 and 2, it is clear that none of the ramps has sufficient length to accommodate the queue; so, if ramp metering is implemented, the resulting congestion will get to the deceleration lane of the freeway. On the other hand, the conditions of the deceleration lanes in Kohandezh and Atashgah on-ramps do not meet the conditions for a queue. Because, these ramps are located after Ashrafi Isfahani and Jahad intersections respectively, the traffic jam in the ramps will impair the performance of the intersections. Because Emam Khomeini on-ramp is located at the beginning of the freeway and deceleration lane, it has especial conditions.
Table 2 contains the properties of the ramps
mentioned in the previous table for the
purpose of comparison
The data and the trip information from the network traffic assignment show that more than 90 percent of the flow exited from the Emam Khomeini Street, entering the freeway through this on-ramp. The deceleration lane is used by only 10 percent of flow. Although the conditions are suitable for implementing ramp metering, because of the special geometry of the deceleration lane (the ramp is exactly after a hazardous turn) and the high speed vehicles on this segment of the side street, lining up on the ramp can cause safety issues. For the Samadiyeh on-ramp, 100 m of its deceleration lane was widened to 12 m (the width of the rest of this deceleration lane is 7 m). In this geometry, the queue can be made to reach 55 m upstream of the ramp. Thus, the Samadiyeh on-ramp was chosen to implement the ramp metering.For simulated model calibration, 7 to 8 am observed volumes of different sections including upstream and downstream and ramps were applied. The volumes of model were compared with real data collected in the field. After running scenarios, the results investigated based on 3 methods including: Theil's U-Statistics, GEH Statistic and Root Mean Square Error (RMS), revealed the outperformance of the model. For the model validation, traffic data of 8 to 9 am applied in the simulation and outcomes of the simulation compared with observed volumes. The results indicated that the model meet the thresholds of three mentioned methods.
4.
Evaluating the Effects Of Ramp
Metering
As mentioned earlier, the on-ramp of Samadiyeh was chosen for the implementation of the ramp metering, and two methods of ramp metering, including fixed-time control and ALINEA methods, were used. Considering the lowest acceleration length of the vehicles that stopped behind the traffic signal controller along the ramp, the lights should be installed at a distance of 20 m from the gore area of the ramp to ensure 1.5 m of acceleration length. In this case, the storage length of the queue and the safe stopping distance will be 172 m and 44 m respectively.
4.1
Ramp Metering using the
Fixed-Time Control Method
As previously mentioned, in this method, the metering rates will be determined on the basis of previous observations and traffic data so that the rate is fixed throughout the whole period of forecasting.
Comparing Methods of Ramp Metering for On-Ramps to Improve the Operational … the upstream traffic volume, entrance volume of
the ramp, and downstream capacity [Hoel, Garber, and Sadek, 2011]. As shown in Figure 5, the metering rate should satisfy Equation 4:
Metering rate + upstream volume ≤ downstream capacity
(4)..
Other factors such as the existence of sufficient length on the ramp to accommodate the queue and prevent congestion on the deceleration lane as well as sufficient capacity of the whole network for servicing the deviated traffic flow should be taken into account in determining the metering rate [Jacobson, 2006].
If the purpose of ramp metering is to improve safety, the metering rate will be determined according to the merging condition at the end of the rampIf a procession of vehicles try to enter the freeway by the ramp, there will be a high probability of some types of accidents, such as rear-end collision and lane-changing collision, at the junction of the ramp to the freeway. Ramp metering can reduce the probability of such accidents by lowering the number of vehicles in the queueIn this case, the metering rate depends on the geometry of the freeway and the
acceptable gaps of traffic flow [Hoel, Garber, and Sadek, 2011; Jacobson, 2006].
The fixed-time control methods can be divided into the three following classifications [Chaudary et al. 2004]:
1- Single-lane one car per green: Operationally, the minimum cycle length in this case is 4 s, including 2 s for green and 2 s for red time. It provides a capacity of 800 to 900 vehicles per hour.
2- Single-lane multiple cars per green: The most common form of this method allows two vehicles enter the freeway in each cycle. In this case, the cycle length is approximately between 6 to 6.5 s, with 4 second green time and 2 to 2.5 seconds red time. It provides a capacity of 1100 to 1200 vehicles per hour.
Figure 5.Ramp metering by Fixed-time control method [Hoel, Garber, and Sadek 2011]
Babak Mirbaha, Ghodrat Eftekhari, Sajjad Hasanpour
309 International Journal of Transportation Engineering, 3- Dual-lane metering (two abreast
metering): This procedure is used for ramp metering in a situation where the ramps have two passing lanes and each has a separate installed controller. The dual-lane metering can provide a capacity of 1600 to 1700 vehicles per hour for the ramp.
4.1.1 Calculating the Metering Rate
Due to the free-flow speed of the understudied freeway (100 km/h) and according to Highway Capacity Manual [HCM, 2010], the basic capacity of the freeway was determined as 6900 pc/h (2300 pc/h/ln). According to Equation 4, the metering rate can be calculated as follows:
6900-5144=1756 pc/h = metering rate As the Samadiyeh on-ramp has one passing lane, the maximum metering rate for this ramp is 1200 vehicles per hour. This metering rate is 6 s based on the cycle length, including 4 s for green time and 2 s for red time. This time is enough to allow two vehicles entry per cycle.
4.2
Ramp Metering using the Alinea
Algorithm
The ALINEA algorithm is a closed-loop algorithm, which was introduced by Papageorgiou et al. in 1991. This algorithm is categorized in traffic sensitive and local algorithms group [Papageorgiou, 1991]. ALINEA algorithm adjusts the flow of vehicles entering the ramp in a way that the occupancy rate at the downstream of convergence area does not exceed the optimal occupancy rate (occupancy rate corresponding to the capacity). In this algorithm, the metering rate can be calculated using the following equation [Papageorgiou, 1991; Abdel-Aty, Dhindsa, and Gayah, 2007]: r (k) = r (k-1) + KR [O-OOut (k-1)] (5)
r(k) is the metering rate of the kth period, r (k-1) is the metering rate of the previous period, KR is the adjusting parameter, O is the percentage of occupancy corresponding to the capacity, and OOut (k-1) is the percentage of occupancy rate measured at the downstream area of convergence for the previous period.
The metering rates calculated by Equation 5 will be modified based on a predetermined range [rmin, rmax], where rmin represents the minimum admissible ramp flow and rmax corresponds to the capacity of the ramp [Smaragdis, Papageorgiou, and Kosmatopoulos, 2004]. In this study, rmax and rmin were taken as 2000 pc/h and 700 pc/h respectively.
4.2.1 Key Parameters in Alinea Algorithm
The ALINEA algorithm has three main parameters that should be calibrated according to the traffic conditions of the location [Chu et al., 2004] which include:
The position of the downstream installed detectors,
The occupancy rate corresponding to the capacity of the downstream detectors’ location, and
The adjusting parameters.
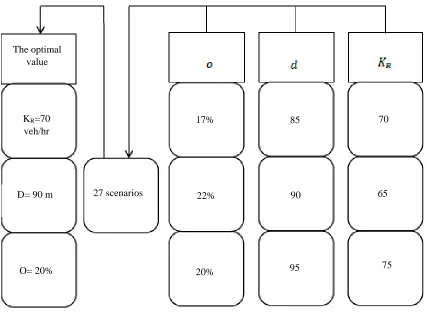
In this study, several scenarios were simulated in order to calibrate the ALINEA algorithm. Parameters evaluated in these scenarios are shown in the following figure.
As shown in Figure 6, to calibrate the main parameters of the ALINEA algorithm, 27 scenarios were defined; each consists of 10 replications. A comparison of the results showed that the scenario with the values of 70 veh/h, 90 m, and 20% for the adjusting parameter, location of the downstream detectors, and occupancy rate corresponding to the capacity respectively was the nearest scenario.
Comparing Methods of Ramp Metering for On-Ramps to Improve the Operational … In this section, the results of the implementation
of ramp metering using fixed-time control method and ALINEA algorithm are presented and compared.
.
Figure 6.The essential parameters in the ALINEA algorithm
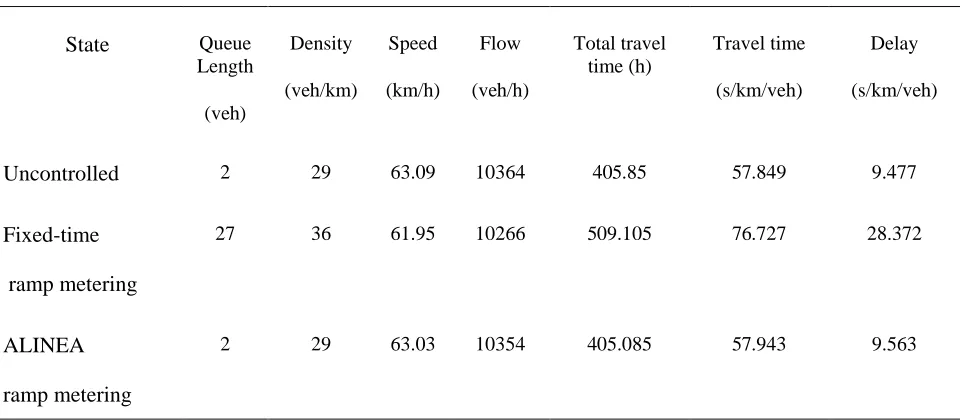
Table 3 shows the running of a ramp metering on an on-ramp using the fixed-time control method. The delay at the network level is 3 times more than that of an on-ramp without any controller According to Table 4, it is understood that this increase in delay is the result of the high delay imposed on vehicles entering through the on-ramp. Table 4 also shows that the traffic flow through the Samadiyeh on-ramp (the ramp with ramp metering controllers) is lower than its capacity. So, it is clear that ramp metering with fixed-time control will deviate the traffic flow of the ramp at the 100% level of demand.
Further, Table 4 shows that ramp metering using the ALINEA algorithm will increase the delay of vehicles entering the ramp; as this increase in delay is negligible in comparison with the fixed-time method, the traffic flow condition at the network level is not significantly different from the normal condition (without ramp metering controllers). Additionally, Table 4 shows that in ramp metering using the ALINEA algorithm, traffic flow through the ramp is equal to the demand of the ramp.
The optimal value
KR=70
veh/hr
D= 90 m
O= 20%
17% 85
22% 90 65
20% 95 75
70
Babak Mirbaha, Ghodrat Eftekhari, Sajjad Hasanpour
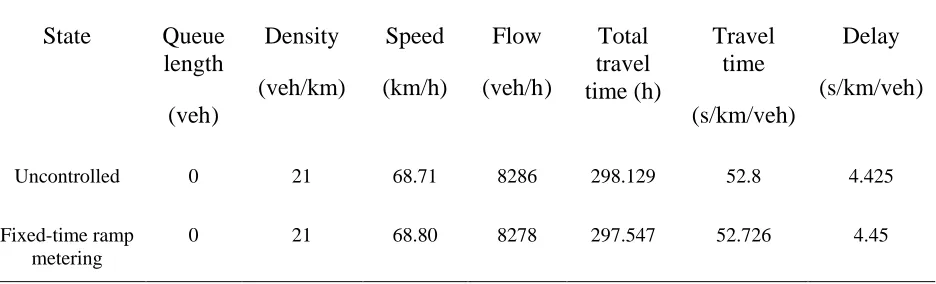
311 International Journal of Transportation Engineering, Table 5 shows that despite the ramp metering,
there is no significant difference in traffic flow
through the upstream segment of the freeway in the on-ramp of Smadiyeh.
Table 3.Comparing the results at the network level and at the demand level of 100%
Delay (s/km/veh ) Travel time (s/km/veh) Total travel time (h) Flow (veh/h ) Speed (km/h) Density (veh/km ) Queue Length (veh ) State 9. 477 57 .849
405 . 85 10364 63.09 29 2 Uncontrolled 28.372 76 . 727
509. 105 10266 61.95 36 27 Fixed-time ramp metering 9.563 57 .943 405. 085 10354 63.03 29 2 ALINEA ramp metering
Table 4.Comparing the results at the ramp level on Samadiyeh and at the demand level of 100%
Delay
(s /veh ) Travel time (s/km/veh) Total travel time (h) Flow (veh/h ) Speed (km/h) Density (veh/km ) Queue Length (veh ) State 1.089 8.802 12735.862 1446 53.95 28 0 Uncontrolled 300.435 308.141 419394.149 1367 13 112 20 Fixed-time ramp metering 1.439 9.163 36 . 13250 1446 97.51 29 0
ALINEA ramp metering
Table 5.Comparing the results at the freeway upstream segment level and at the demand level of 100%
Delay
(s/ veh ) Travel time (s/km/veh) Total travel time (h) Flow (veh/h ) Speed (km/h) Density (veh/km ) Queue
Comparing Methods of Ramp Metering for On-Ramps to Improve the Operational …
0.938 10.182
52310.984 5132
70.46 25
0 Fixed-time ramp
metering
0.962 10.204
52394.781 5133
70.32 25
0 ALINEA ramp
metering
Table 6.Speed and headways of vehicles passing through the Samadiyeh on-ramp at the Demand Level of 100%
Speed (km/h)
Headway (s)
State
40.62
1.265
Uncontrolled
32.06
1.336
Fixed-Time Control
39.55
1.256
Controlled by ALINEA
To study the effects of ramp metering in more
detail, the speed and headway of vehicles
passing
through
the
on-ramp
were
investigated at the demand level of 100%.
The results are shown in the Table 6.
Table 6 shows that ramp metering by ALINEA method at the demand level of 100% has little impact on the headway of vehicles passing through the ramp and on their speed when passing through the ramp gore. It can be interpreted that in ramp metering using ALINEA method at the demand level of 100%, no vehicle stopped behind the control light but slowed down before reaching it. The effects of this speed reduction will be compensated for after crossing the light so that vehicles passing through the ramp gore will reach high speed at the same time as the normal condition (without metering controllers). However, for the ramp metering using fixed-time
control, regardless of the freeway condition, vehicles must stop behind the controller light and move again when the light turns green. Thus, in this case, the headways will be longer when speeds are lower in comparison with the normal condition (without controller).
5.1 At the Demand Level Of 110%
In this study, in order to consider the future traffic flow, the current condition (demand at peak hour) was increased by 10% and the effect of ramp metering was investigated at the three levels of the network, the entrance ramp of Samadiyeh, and the upstream segment of the freeway. The results are presented in the Table 7.
Table 7 shows that even in the normal state without controllers, Shahid Kharrazi freeway and its connected ramps cannot service 110% of the demand (the total flow is 1400 veh/h).
Table 7.The results at the network level for the demand level of 110%
Delay Travel time
Total travel time (h) Flow
Speed Density
Babak Mirbaha, Ghodrat Eftekhari, Sajjad Hasanpour
313 International Journal of Transportation Engineering, (s/km/veh ) (s/km/veh)
(veh/h ) (km/h)
(veh/km ) (veh )
91.405 135.254
955.436 11026
42.99 69
61 Uncontrolled
91.177 139.419
955.388 10967
51.11 69
43 Fixed-time
ramp metering
94.066 142.296
955.51 10918
54.1 69
38 ALINEA ramp metering
At the first glimpse, it seems there is no significant difference between the states with and without controllers, but in the case of ramp metering using ALINEA and fixed-time control methods, less vehicles will be serviced; thus, resulting in reduction of queue length for the ramp metering state.
According to Table 8, it is clear that because of the traffic flow in the convergence area, the Samadiyeh on-ramp cannot satisfy the demand of 111% (1590 veh/h)This table also shows that for ramp metering using fixed-time control and ALINEA algorithm, the delay of vehicles entering the ramp increased 4.4 and 5.2 times respectively for each method in comparison with the normal state. This large increment in delays resulted from the number of vehicles which could not enter the freeway and stayed behind the light until the end of simulation. So, at the demand level of 100%, ramp metering leads to traffic flow deviation, and this is more critical in the controllers using the ALINEA algorithm.
Table 9 shows that in the normal state, because of the conditions in the convergence area and the traffic volume entering the Samadiyeh on-ramp, accommodating 110 percent of the demand (5658 veh/h) from the upstream segment of freeway is impossible. But in the case of ramp metering control, it will be possible for the upstream
segment of freeway to accommodate 110% of the demand because they restrict the entrance of vehicles into the ramps. Paying attention to the table, it can be seen that the operational conditions will be enhanced considerably at the upstream segment of the freeway. If ramp metering is used, the delay imposed on the vehicles through the upstream segment of the freeway will decrease by 91% and 64% for fixed-time control method and ALINEA algorithm respectively in comparison with the normal state.
5.2 At the Demand Level of 80%
In this study, in order to consider the traffic flow during off-peak hours, peak hour demand was reduced by 20%, and the effect of ramp metering was investigated. The results are shown in Table 10.
Table 10 shows that ramp metering for the demand level of 80% does not have significant effects on operational conditions at the network level.
Comparing Methods of Ramp Metering for On-Ramps to Improve the Operational …
Table 8.The results at the ramp level in Samadiyeh for the demand level of 110% Delay (s/ veh ) Travel time
(s/km/veh) Total travel
time (h) Flow (veh/h ) Speed (km/h) Density (veh/km ) Queue length (veh ) State 293.929 301.135 443558.79 1479 12.07 132 23 Uncontrolled 1293.812 1346.57 1507846.05 1166 10.11 121 24 Fixed-time ramp metering 1520.626 1528.749 1702251.46 1114 8.77 136 23 ALINEA ramp metering
Table 9.The results at the freeway upstream segment for the demand level of 110% Delay (s/ veh ) Travel time (s/km/veh) Total travel time (h) Flow (veh/h ) Speed (km/h) Density (veh/km ) Queue length (veh ) State 26.83 36.062 194909.584 5459 26.22 92 10 Uncontrolled 9.44 18.68 106915.236 5663 49.68 50 1 Fixed-time ramp metering 2.4 11.639 659596.745 5654 53.01 65 0 ALINEA ramp metering
Table 10.The results at the network level for the demand level of 80%
Babak Mirbaha, Ghodrat Eftekhari, Sajjad Hasanpour
315 International Journal of Transportation Engineering,
4.469 52.692 298.656 8297 68.85 21 0 ALINEA ramp metering
Table 11.The results at the ramp level in Samadiyeh for the demand level of 80%
Delay
(s/ veh )
Travel
time
(s/km/veh)
Total
travel
time (h)
Flow
(veh/h )
Speed
(km/h)
Density
(veh/km )
Queue
length
(veh )
State
0.143 7.862 9093.34 1157 59.367 20 0 Uncontrolled 0.799 8.926 10316.153 1157 55.79 21 0 Fixed-time ramp metering 0.726 8.836 10227.166 1158 55.71 21 0 ALINEA ramp meteringTable 12.The results at the freeway upstream segment for the demand level of 80%
Delay
(s/ veh )
Travel
time
(s/km/veh)
Total
travel
time (h)
Flow
(veh/h )
Speed
(km/h)
Density
(veh/km )
Queue
length
(veh )
State
0.403 9.642 39529.399 4099 73.82 19 0 Uncontrolled 0.44 9.683 39776.458 4108 73.51 19 0 Fixed-time ramp metering 0.428 9.664 39701.589 4108 73.51 19 0 ALINEA ramp meteringTable 12 shows that even with ramp metering, the operational conditions of the upstream segment at the demand level of 80% will not be enhanced, but the delay of vehicles passing through the segment will be increased.
The amount of increase in delay is 9.1% and 6.2 % for the fixed-time control and ALINEA
Comparing Methods of Ramp Metering for On-Ramps to Improve the Operational …
6. Conclusions
This study aimed to investigate the effects of ramp metering at three levels: the network level (including the freeway and the ramp connected to it), the on-ramp level, and the upstream segment of the ramp in the freeway. In order to achieve this aim, one of the most important urban freeways in the metropolis of Isfahan was selected. The traffic volume passing through this freeway and its connected ramps were determined during peak hours (7 to 9 am), and the north-south traffic flows was simulated in a microscopic manner using the AIMSUN software. After calibration and validation of the model, a specific on-ramp (the entrance ramp of Samadiyeh) was reviewed as the selected ramp, by using the fixed-time plan and ALINEA algorithm at the demand levels of 100%, 110% and 80%. The main parameters of ALINEA algorithm were calibrated due to the traffic conditions. The adjusting parameter, installation location of the downstream detectors, and occupancy percentage corresponding to the capacity are 70 veh/h, 90 m downstream of the on-ramp gore, and 20% respectively.
The results of this study are given below:
1) At the demand level of 100% (Traffic to 7 pm to 8 am), ramp metering using ALINEA algorithm does not have much impact on operational conditions of traffic flow. However, ramp control with fixed-time control would make the operational conditions of traffic flow at the network level and the entrance ramp worse.
2) At the demand level of 110%, ramp metering leads to traffic flow deviation. This is because of the increase in the delay of vehicles passing through the on-ramp. However, ramp metering enhances the operational conditions at the upstream segment of the freeway considerably. The delay imposed on the vehicles in this segment will decrease by 91% and 64.8% for ramp metering using fixed-time control and ALINEA algorithm respectively. So, it can be
interpreted that ramp metering works quite well at high demand levels.
3) For the demand level of 80%, ramp metering does not have a significant effect at the network level. Both the vehicles passing through the ramp and those in the upstream segment face longer delays. Thus, it can be said that at low demand levels, ramp metering does not have operational efficiency as it causes the vehicles to enter the freeway at lower speeds in comparison to the uncontrolled state.
7. Acknowledgment
The authors would like to thank Mr.Y. Mahyapour for his cooporation in providing the data used in our analysis.
8. References
- AASHTO (2006) "A policy on geometric design of highways and streets", 5th Edition, Washington D.C: American Association of State Highway and Transportation Officials.
- Abdel-Aty, M., Dhindsa, A. and Gayah, V. (2007) "Considering various ALINEA ramp metering strategies for crash risk mitigation on freeways under congested regime", Transportation Research Part C: Emerging Technologies, Vol. 15, pp. 113-134.
- Arnold, E.D. (1998) "Ramp metering: a review of the literature", Technical Assistant Report, Virginia Department of Transportation, Charlottesville, Virginia, USA.
Babak Mirbaha, Ghodrat Eftekhari, Sajjad Hasanpour
317 International Journal of Transportation Engineering, - Chu, L., Liu, H.X., Recker, W. and Zhang, H.
M. (2004) "Performance evaluation of adaptive ramp metering algorithms using microscopic traffic simulation model", Journal of Transportation Engineering, Vol. 130, No.3, pp. 330-338.
-Dongyan, S., Xiao-Yun, L., Roberto, H. and Zhongren, W. (2014) "Coordinated ramp metering and intersection signal control", International Journal of Transportation Science and Technology, Vol. 3, No. 2, pp. 179–192. - Haj-Salem, H., Farhi, N. and Lebacque, J. P. (2014) "Combining ramp metering and hard shoulder strategies: Field evaluation results on the ILE the France Motorway Network", Transportation Research Procedia, Vol. 3, pp. 1002-1010
-Hasan, M., Jha, M. and Ben-Akiva, M. (2002) "Evaluation of ramp control algorithms using microscopic traffic simulation", Transportation Research Part C: Emerging Technologies, Vol. 10, pp. 229-256.
-Hoel, L. A., Garber, N. J. and Sadek, Adel W. (2011) "Transportation infrastructure engineering: a multi-modal integration SI Edition", Cengage Learning, Stamford, USA. -Ismail, M. A. and Celikoglu, H. B. (2017) " Local ramp metering strategy alinea: microscopic simulation based evaluation study on Istanbul freeways", Transportation Research Procedia, Vol 22, pp. 598–606.
-Jacobson, L., Stribiak, J., Nelson, L. and Sallaman, D. (2006) "Ramp management and control handbook", Washington D.C: Office of Transportation Management Federal Highway Administration.
-Jain, A. (2004) "Ramp metering", Term Paper Report, Transportation Systems Engineering, Civil Engineering Department, Indian Institute of Technology Bombay, India.
- Khaled, S., Muhammad Asif, K.and Hamilaa, R., (2016) "Literature review of advancements in adaptive ramp metering", Procedia Computer Science Vol.83, pp.203 – 211.
-Li, D., Ranjitkar, P. and Ceder, A. (2014b) “Integrated approach combining ramp metering and variable speed limits to improve motorway performance”, Paper Presented at the Transportation Research Board 93rd Annual Meeting, No. 14-3781.
-Neudorff, L. G., Randall, J. E., Reiss, R. and Gordon, R. (2003) "Freeway management and operations handbook", Washington D.C: Office of Transportation Management Federal Highway Administration.
-Papageorgiou, M. (1991) "Concise encyclopedia of traffic & transportation systems", First Edition, UK: Pergamon Press plc. - Pasquale, Sacone, S., Siri, S. and De Schutter, B. (2016) "A multi-class ramp metering and routing control scheme to reduce congestion and traffic emissions in freeway networks", IFAC-PapersOnLine, Vol. 49, No.3, pp. 329–334. -Roess, R. P., Prassas, E. S. and Mcshane, W. R. (2004) "Traffic engineering", Third Edition, USA: Pearson Prentice Hall.
-Smarragdis, E., Papageorgiou, M. and Kosmatopoulos, E. (2004) "A flow-maximizing adaptive local ramp metering strategy", Transportation Research Part B: Methodological, Vol. 38, pp. 251-270.
-Winyoopadit, S. (2007) "Development and comparative evaluation of ramp metering algorithms using microscopic traffic
simulation", Journal of Transportation Systems Engineering and Information Technology, Vol. 7, pp. 51-62.
Comparing Methods of Ramp Metering for On-Ramps to Improve the Operational … Part F: Traffic Psychology and Behaviour,
Vol.10, pp.61-75.
-Yuheng, K., Yibing W., Papageorgiou and Ioannis Papamichail, M. (2016) "Local ramp