57 International Journal of Transportation Engineering,
Envelopment Analysis
Seyed Ali Sarkeshikian1, Arefeh Lotfi2, Morteza Bagheri3
Received: 22. 02. 2017 Accepted: 12. 08. 2018
Abstract
Study of various transportation indicators could be an appropriate criterion in evaluating the performance of the existing railways throughout the globe. This study was carried out to investigate the performance of rolling stock of Iranian railway using productivity analysis. In order to solve the problems, some solutions were provided by productivity management cycle steps. At the first step, it was tried to find how appropriate the rolling stock used in Iranian railway is. To evaluate productivity of rolling stock, data envelopment analysis method was used; besides railways specific indicators and partial indicators of rolling stock were measured. Consequently, during 1390-1394(2011-2015), the performance of rolling stocks was inefficient; however, rolling stocks were efficient in 1395(2016). At the next step, rolling stock productivity and its bottlenecks were analyzed according to railway performance, railway expert’s opinions, and previous studies. Questionnaires were answered by 20 experts. Cronbach's alpha reliability with measured value of 0.899 was proven. Productivity improvement strategies are extracted from the results of these analyses and will be used to prioritize on the basis of comparing the importance and the current situation.
Keywords: Rolling stock productivity, productivity management cycle, railway productivity indicators,
strategies for improving productivity
Corresponding author E-mail: [email protected]
1 . PhD. Student, School of Railway Engineering, Iran University of Science and Technology, Tehran, Iran
2 . MSc. Student, School of Railway Engineering, Iran University of Science and Technology, Tehran, Iran
International Journal of Transportation Engineering, 58
1.
Introduction
Throughout the history, railway has played a prominent role in most of societies as a safe, green and economical mode of transportation. Iran has more than 10 thousand kilometer of railway track; and during last 10 years, 280 million passengers and 400 million tones freight have been averagely carried by this means of transportation. Unfortunately, the trend of passenger carriage was descending; while the ascending trend of cargo shipment is not a reliable criterion to mention the positive performance of railway; as the outputs should considered beside inputs and the resources should be properly allocated to enhance the productivity.
Productivity is one of the most important factors in development of countries; it means more and better application of available tools and resources. Accordingly, productivity reflects the management thinking, innovation and quality in organizations and countries. Based on previous studies, with efficiency of 51%, Iranian railway is placed in 23rd rank across 66 countries of the world. Its rank is 9th among 14 countries in the Middle East and Central Asia with efficiency of 55%. The efficiency of Iran railway wagons is low and the annual ton-km can be increased from 22604 to 41136 [Mohri and Haghshenas, 2017].
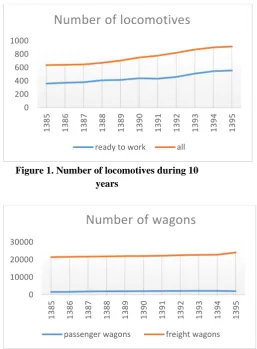
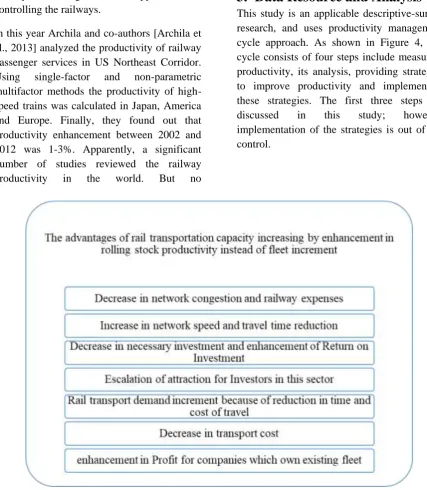
According to figure 1 and 2, in addition to railway manager’s attitude toward the opinion supporting the increase in the number of fleet, the productivity evaluation of existing fleet of Iranian railway is obviously necessary. So, the first exquisite point to be answered is "Is the existing fleet of railway used properly?” After that, the study should seek for some solutions to improve the productivity of Iranian railway fleet. To answer these questions, the concept of “productivity management cycle” has been used. At the first step, specific indicators of railways productivity along with rolling stock productivity indicators are measured (only indices with sufficient available information for
measurement were studied). Then, the productivity and effective factors of rolling stock are analyzed. The final step involves validation of productivity improvement strategies and their prioritization. It is important to mention the limitations of this study such as lack of indicators to evaluate the productivity of railway fleet; hence, we used available data to carry out this study.
Figure 1. Number of locomotives during 10 years
Figure 2. Number of Wagons during 10 years
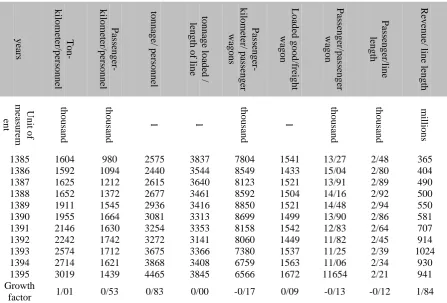
To increase the capacity of rail transport fleet, productivity improvement strategies have numerous advantages over buying new fleet (Figure 3).
2.
Literature Review
In 1999 Qum et al [Qum et al. 1999] investigated the evaluation methods of railways productivity. One of the most important results of their study was common opinion of all
0 200 400 600 800 1000
1385 1386 1387 1388 1389 1390 1391 1392 1393 1394 1395
Number of locomotives
ready to work all
0 10000 20000 30000
1385 1386 1387 1388 1389 1390 1391 1392 1393 1394 1395
Number of wagons
59 International Journal of Transportation Engineering,
researchers on positive impacts of competition enhancement on the railway productivity elevation. After that in 2003, Mizutani and Uranishi [Mizutani and Uranishi, 2003] studied the changes in productivity after railway privatization and variables affecting the productivity growth and capital changes in Japan by total factor productivity. The result indicated that annual growth in productivity was 2.97% after privatization, and privatization caused an annual 0.59% increase in productivity. One year later, In Spain, Ibáñez [Gómez-Ibáñez, 2004] conducted a study to select the best choice in changing the railway management system and specifying its impact on Spain railways. This study compared three different methods and concluded that simultaneous use of decentralization and privatization is the best option, while privatization should be more and decentralization should be less.
Hilmola [Hilmola, 2007] conducted a research on the productivity of freight carrying by railways in Europe. The purpose of this study was to prevent the decline in demand and market share through increase of productivity. This study used data envelopment analysis (DEA) to analyze the productivity in Europe from 1980 to 2003. Also, to confirm the data envelopment analysis, partial productivity analysis was used. According to DEA, countries with high productivity levels in 1980, met a productivity decline in 1990. Performance analysis showed that countries possessing high productivity in the rail freight must determine targets to improve their rolling stock productivity. Jain et al [Jain et al. 2008] analyzed the relationship between ownership structure and technical productivity in urban railway. In this study, DEA was used for comparative analysis of 15 urban railway system samples. Among the different models of control, privatization has direct and positive role in promoting efficiency.
NTC committee [(NTC), MARCH 2008] evaluated the productivity of Australia’s
railroads and events influences in the past two decades. The conclusion was that Australian railways need policies and objectives clarification and the important productivity measures should be included in these policies. Also, an increase in staff skills should be considered. The methodology of this report was based on research, analysis and presenting favorable recommendations. Movahedi and co-authors [Movahedi et al. 2011] conducted a study to measure the productivity of Iranian railway compared to other countries. In this study, DEA method was used to analyze productivity in the years between 1980 and 2003. Also, the partial productivity analysis was applied to verify the value of the DEA method.
Kriem [Kriem, 2011], at MIT, summarized and represented the variation of the rail freight industry in US during last 30 years. The context of these changes includes the operational, managerial, technical and scientific aspects. These changes have been documented according to various aspects of productivity. Moreover, three mathematical analysis methods were employed to estimate data. The results showed that productivity growth in US rail sector is about 48% over the period between 1987 and 1999 (12 years. Wolff and Spoorwegen in 2013 conducted a performance analysis on the framework and operation of railway network in Europe to determine the effects of their structural and functional changes.
In this study, the standard parametric analysis (regression) of scientific, technical and economic data were used. The analysis indicated structural errors, especially in the train operations; hence, larger networks and data of longer intervals were recommended [Hansen et al. 2013].
International Journal of Transportation Engineering, 60
performance and differences between railways in different countries, it can be concluded that structure control, effective technologies, appropriate customer relationship and automating processes can improve productivity. Generally, differences in productivity of different countries can be the consequence of government approaches in controlling the railways.
In this year Archila and co-authors [Archila et al., 2013] analyzed the productivity of railway passenger services in US Northeast Corridor. Using single-factor and non-parametric multifactor methods the productivity of high-speed trains was calculated in Japan, America and Europe. Finally, they found out that productivity enhancement between 2002 and 2012 was 1-3%. Apparently, a significant number of studies reviewed the railway productivity in the world. But no
comprehensive study has been conducted on productivity of rolling stock; and most studies have evaluated the productivity of the whole railway system. Thus, this study is an attempt to fill out the lack studies on fleet productivity in Iran.
3.
Data Resource and Analysis
This study is an applicable descriptive-survey research, and uses productivity management cycle approach. As shown in Figure 4, this cycle consists of four steps include measuring productivity, its analysis, providing strategies to improve productivity and implementing these strategies. The first three steps are discussed in this study; however, implementation of the strategies is out of our control.
61 International Journal of Transportation Engineering,
In order to evaluate the productivity and analyze the performance of fleet in Iranian railway, the data of rolling stock of Iranian railway from 2006 to 2016 were employed. In case of submitting main solutions to improve the productivity and also to approve and prioritize them, the opinions of managers and experts on public and private sectors were applied. The first step is to measure the productivity by two types of indicators, firstly specific indicators for comparing the productivity of different units of railroad; and secondly, the partial productivity indicator to measure and compare the productivity of the railway rolling stock in a specified period of time. Survey paper in railway productivity indicates that partial indicators have been used in numerous researches to measure the productivity [Oum et al., 1999].
Figure 4. Productivity Management Cycle (Source: Strategic Planning and supervision department of Iran President, Iran National
Productivity Organization)
this measurement method is particularly useful in the creation of knowledge, discussing current problems, guidance to determine productivity problems, comparison between companies with similar operating environment and for a company over specified time period (when the operation and input prices are constant) [Oum et al., 1999]. Indices of this article are extracted from the review article by Qum et al, entitled "the measurement of productivity in rail transport". Also, indicators used by large-scale rail industries such as British Rail and
Association of American Railroads, as well as Rail productivity measures of UN, UIC reports, the World Bank report [UN, 2012; Oum et al., 1999] were applied. It must be mentioned that the indicators were selected in such a way that there were relevant statistics to measure them. After selecting the indicators, to evaluate the efficiency of each unit (25 years as units from 1991-2016), nonparametric method of data envelopment analysis (DEA, output-oriented) was used.
In the second step, an analysis of the major bottlenecks in rolling stock productivity was accomplished. The third step involved prioritization of extracted productivity improvement strategies by means of experts’ ideas. In order to prioritize these strategies, the importance of each strategy and its current situation in the country were separately surveyed from the rail industry experts.
4.
Data Envelopment Analysis
International Journal of Transportation Engineering, 62
on their weight or importance [Emamimeybodi, 2005].
Due to constant resources of the railway such as length of the lines, the number of freight wagons, and the number of locomotives (inputs), this study employed a modified Output-oriented BCC model. Output-oriented models are used to test if evaluated DMU can increase its outputs while keeping the inputs at
their current levels.
0 1
m j jk j
Min
v x
v
(0.1)1
1 1, 2,...,
n i ik i
u y i n
(0.2)(0.3)
0
1 1
1, 2,...,
n m
i il j jl
i j
u y
u
v x
j
m
, 0 1, 2,...,
i j
u v l k (0.4)
Equation 1. Output-Oriented BCC Model
Failure to apply the following relationship causes many units to be placed on the efficiency boundary; hence the model resolution will decrease [Pourkazemi and Soltani, 2007].
3 ( )
Units inputs outputs
5.
Step One: Measuring the
Productivity
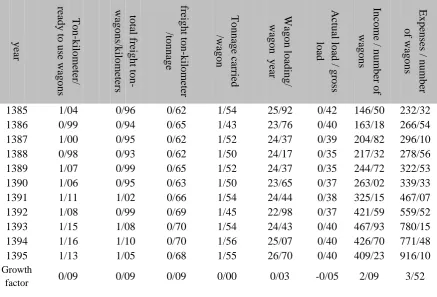
Firstly, the productivity indicators of the railway were examined by specific and partial indicators of the railways. According to Table1, specific indicators of railway productivity show that the main challenge of railway transport productivity in Iran is related to the rail fleet. All fleet-related indicators are negative or almost zero. This Table shows that the productivity of passenger fleet is lower than freight one. Also Rolling stock productivity declined, in the period of 2006-2016.
Table 1. Productivity analysis by specific indicators of railways productivity
year s To n -kilometer/ per sonnel Passen ge r-kilometer/ per sonnel tonnage/ pe rsonn el tonnage loa de d / le ng th of line Passen ge r-kilometer/ pass eng er wago ns Loa ded go od /f reig ht wago n Passen ge r/pass eng er wago n Passen ge r/li ne le ng th Re venue/ li ne leng th Un it of measu rem ent thousa nd thousa nd 1 1 thousa nd 1 thousa nd thousa nd mil li on s
1385 1604 980 2575 3837 7804 1541 13/27 2/48 365
1386 1592 1094 2440 3544 8549 1433 15/04 2/80 404
1387 1625 1212 2615 3640 8123 1521 13/91 2/89 490
1388 1652 1372 2677 3461 8592 1504 14/16 2/92 500
1389 1911 1545 2936 3416 8850 1521 14/48 2/94 550
1390 1955 1664 3081 3313 8699 1499 13/90 2/86 581
1391 2146 1630 3254 3353 8158 1542 12/83 2/64 707
1392 2242 1742 3272 3141 8060 1449 11/82 2/45 914
1393 2574 1712 3675 3366 7380 1537 11/25 2/39 1024
1394 2714 1621 3868 3408 6759 1563 11/06 2/34 930
1395 3019 1439 4465 3845 6566 1672 11654 2/21 941
Growth
63 International Journal of Transportation Engineering,
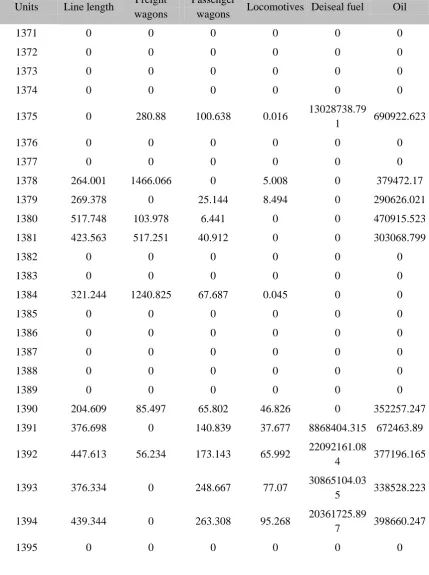
Table (2) shows the partial performance indicators and their trends from 1385 to 1395 (2006_2016). It is obvious that there is no growth in some indicators like ton-kilometer per wagon, ton per wagon and loading per wagon. Consequently, it is obvious that the Iranian rail fleet is not in good condition and needs further research and study. In this section, productivity measurement is performed using the productivity management cycle by measuring the specific railroad indicators as well as reliable indicators concerning the fleet efficiency. In order to present the DEA analysis, we need to introduce variables at first. DEA model variables are presented in Table 3.
Table 2. DEA model variables
variables Type of variables
Line length Input Freight wagons Input Passenger wagons Input
Locomotives Input Deiseal fuel Input
Oil Input
Actual tonnage Output
Passenger Output
The results of the DEA model analysis (output- oriented) for Iranian railway during a 25-year period are provided in Table 4. Unfortunately, the performance of the rail fleet transportation was inefficient in the last 5 years from 1390-1394.
6.
Step Two: Analysis and
Evaluation of Productivity
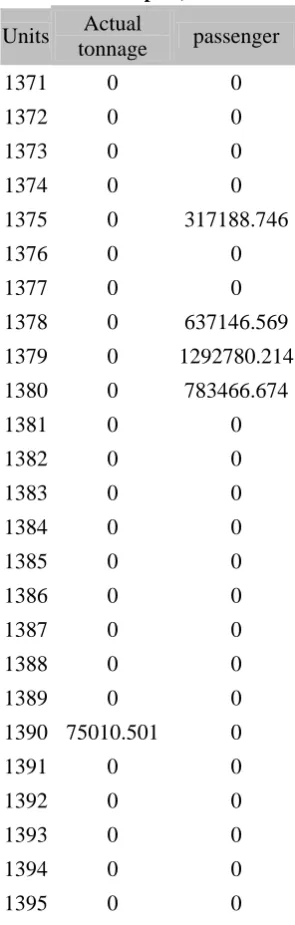
In the previous section, productivity was measured and now the results are analyzed in the second step to follow the productivity management cycle. The values shown in Table 5 are the values proposed by the output-oriented approach to make inefficient units effective. If the inputs are reduced to the size of the visible
Table 3. Rolling Stock partial productivity indicators
year To n -ki lo me ter/ ready to u se wa go ns to tal freig ht t on -ki lo me ters / wago ns freigh t to n -ki lometer to nn age / To nn age carried wago n / Wago n lo adi ng / wago n y ear Actual lo ad / g ro ss lo ad In
come / n
umb er o f wago ns Ex pen ses / number of wago ns
1385 1/04 0/96 0/62 1/54 25/92 0/42 146/50 232/32
1386 0/99 0/94 0/65 1/43 23/76 0/40 163/18 266/54
1387 1/00 0/95 0/62 1/52 24/37 0/39 204/82 296/10
1388 0/98 0/93 0/62 1/50 24/17 0/35 217/32 278/56
1389 1/07 0/99 0/65 1/52 24/37 0/35 244/72 322/53
1390 1/06 0/95 0/63 1/50 23/65 0/37 263/02 339/33
1391 1/11 1/02 0/66 1/54 24/44 0/38 325/15 467/07
1392 1/08 0/99 0/69 1/45 22/98 0/37 421/59 559/52
1393 1/15 1/08 0/70 1/54 24/43 0/40 467/93 780/15
1394 1/16 1/10 0/70 1/56 25/07 0/40 426/70 771/48
1395 1/13 1/05 0/68 1/55 26/70 0/40 409/23 916/10
Growth
International Journal of Transportation Engineering, 64
values in Table 5, the function of the unit will be efficient, so that the minimum output is needed. For example, in 1375 (1996), to make the fleet efficient, there should be a reduction in the number of freight and passenger wagons, locomotives, and the amount of diesel fuel and oil consumed in accordance with the numbers mentioned in the Table 5. In addition to reducing the resources, this approach suggests some changes in the output to optimizing the efficiency (Table 6). For example, in 1375 (1996), in addition to the decrease in some entries, more passengers should be carried to consider this year as an efficient one.
Table 4. DEA Model results
Units productivity Output- oriented
1371 1 Efficient
1372 1 Efficient
1373 1 Efficient
1374 1 Efficient
1375 0.99 Inefficient
1376 1 Efficient
1377 1 Efficient
1378 0.934 Inefficient
1379 0.986 Inefficient
1380 0.998 Inefficient
1381 0.976 Inefficient
1382 1 Efficient
1383 1 Efficient
1384 0.991 Inefficient
1385 1 Efficient
1386 1 Efficient
1387 1 Efficient
1388 1 Efficient
1389 1 Efficient
1390 0.992 Inefficient
1391 0.99 Inefficient
1392 0.931 Inefficient
1393 0.962 Inefficient
1394 0.97 Inefficient
1395 1 Efficient
6.1
Proper Targeting Towards
Productivity
The most important step for productivity improvement in organizations is appropriate targeting for planning, directing and controlling resources which is managers’ duty. For example, reducing the number of seats in a wagon or increasing the number of crew per compartment may enhance customer satisfaction, but will also decrease productivity. Similarly, excess track development may provide access for more people, but it could reduce track productivity, so that many countries have eliminated their inefficient rail track.
6.2 Legislative Solutions to Improve
Productivity
Railways are always influenced by governance legislations. Thus, providing an accurate view for sovereignty towards legislation is always helpful in development of these systems. Most of studies have revealed that creation of appropriate structures such as adjustment and regulation institutions can enhance the productivity. Survey paper in railway productivity indicates that most studies confirm that enhanced competition in the railway industry will promote the productivity [Oum et al., 1999].
6.3 Proper Allocation of Financial
Resources
65 International Journal of Transportation Engineering, Table 5. Excessive amounts of input (slack on inputs)
Units Line length Freight wagons
Passenger
wagons Locomotives Deiseal fuel Oil
1371 0 0 0 0 0 0
1372 0 0 0 0 0 0
1373 0 0 0 0 0 0
1374 0 0 0 0 0 0
1375 0 280.88 100.638 0.016 13028738.79
1 690922.623
1376 0 0 0 0 0 0
1377 0 0 0 0 0 0
1378 264.001 1466.066 0 5.008 0 379472.17
1379 269.378 0 25.144 8.494 0 290626.021
1380 517.748 103.978 6.441 0 0 470915.523
1381 423.563 517.251 40.912 0 0 303068.799
1382 0 0 0 0 0 0
1383 0 0 0 0 0 0
1384 321.244 1240.825 67.687 0.045 0 0
1385 0 0 0 0 0 0
1386 0 0 0 0 0 0
1387 0 0 0 0 0 0
1388 0 0 0 0 0 0
1389 0 0 0 0 0 0
1390 204.609 85.497 65.802 46.826 0 352257.247
1391 376.698 0 140.839 37.677 8868404.315 672463.89
1392 447.613 56.234 173.143 65.992 22092161.08
4 377196.165
1393 376.334 0 248.667 77.07 30865104.03
5 338528.223
1394 439.344 0 263.308 95.268 20361725.89
7 398660.247
International Journal of Transportation Engineering, 66 Table 6. Deficient amount of outputs (slack on
out puts)
Units Actual
tonnage passenger
1371 0 0
1372 0 0
1373 0 0
1374 0 0
1375 0 317188.746
1376 0 0
1377 0 0
1378 0 637146.569
1379 0 1292780.214
1380 0 783466.674
1381 0 0
1382 0 0
1383 0 0
1384 0 0
1385 0 0
1386 0 0
1387 0 0
1388 0 0
1389 0 0
1390 75010.501 0
1391 0 0
1392 0 0
1393 0 0
1394 0 0
1395 0 0
This section proposes railway productivity improvement by budgeting based on prioritizing different solutions for enhancing the carriage capacity of the railway company. In the other words, comparing and prioritizing new track constructions, purchasing fleet and productivity improvement strategies must be followed to "achieve the maximum capacity of cargo and passengers at the lowest cost".
6.4 Cost Management
Management of railway company expenditures is also another important duty of the managers. Cost management will impact cost and revenue as well as service quality and price. Numerous solutions exist to reduce the costs but they need more powerful management tools. For example, some weaknesses in management like cost monitoring in each area of railway can be mentioned. As a real case, in earlier years, there was not any tool to "predict the expenses and spare requirement of railway areas” and” monitor them after distribution ".
6.5 Wagon Circulation Period
Due to the differences between cargo types and distances in various countries, wagon circulation period comparison between different countries is not a reliable analysis. But comparing circulation period during different years in a country is relatively logical. According to Figure 5 and loading numbers per wagon in these years, wagon circulation Period in Iran has increased from 11.9 days in 1382 (2003) to 14.9 days in 1391 (2012). Enhancement of circulation period is mostly because of increased waits at stations during the trip. This means that the majority of wagons life time is spent in stations and terminals. In case of increasing the car number without productivity, the wagons tarriance in stations will escalate.
67 International Journal of Transportation Engineering, Figure 5. Wagons circulation period from 1382
to 1391
6.6 Train Delays
Train delays also reduce the productivity of rolling stock, increases wagons circulation period and decreases cargo capacity. Also because of rail transport limitations, any delay can cause network disturbance, disrupt planning and postpone the operations of many other trains in the network. Delays due to buffer time in timetable or other weaknesses in planning are scheduled. Unscheduled delays take place stochastically because of different factors coming to plan and postponing the operation from its planed program.
Any chaos can change all programs and will create many delays in the network. The higher the use of a line and the closer to theoretical capacity, the more likely the disruption will be. As a result, these delays will escalate with the increasing in cars number without productivity. Based on [Dingler et al. 2010], rolling stock increasing which causes enhancement of network traffic volume in a fixed capacity situation will increase delays and reduce the service level.
6.7 Rolling Stock Readiness to Work
According to investigations by the author, only in 1393 (May 2013), a train spent more than 6012 minutes time in Tehran-Mashhad passenger line because of specific maintenance. This is for one month and only in one line. The
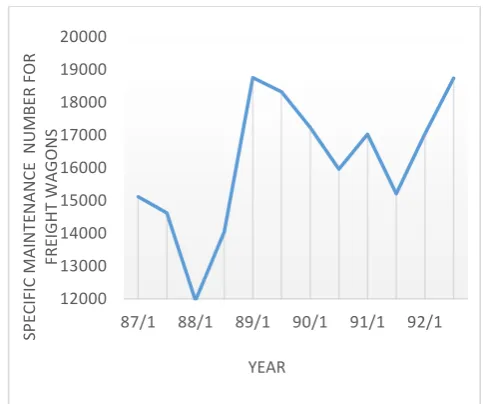
weakness of fleet readiness to work declines the productivity of rail fleet industry in two aspects. One is delay in planning of railway operation and time required for maintenance or fleet separation; while the second one is the time needed for specific maintenance which makes cars circulation period longer. So the number of these repairs should be reduced as much as possible. In addition to quality, the effects of overhaul intervals on the number of ongoing and specific maintenance are highly significant. In the past, overhaul of cargo fleet was accomplished once in two years in Iran railway. Then overhaul and the semi-major repairs were being done every three years and every 18 months, respectively. Afterward, overhaul and semi-major repairs intervals become 4 and 2 years, respectively. In the second half of 1388 (2009), semi-major repairs were also removed. Figure 6 exhibits significant increase of special maintenance in these years (numbers 1 and 2 represent the first and second half of each year, respectively). This increasing in maintenance numbers shows that optimum planning and scheduling of overhauls needs to be studied more carefully.
Figure 6. Specific maintenance number for freight wagons from 1387 to 1392
12000 13000 14000 15000 16000 17000 18000 19000 20000
87/1 88/1 89/1 90/1 91/1 92/1
SPE
CIFI
C MAINTENANC
E NUM
BER FOR FRE IG H T W AG ONS YEAR 11.9512.28 13.9814.08 15.3614.98 15.1014.98 15.44 14.93 10.00 11.00 12.00 13.00 14.00 15.00 16.00
1382 1383 1384 1385 1386 1387 1388 1389 1390 1391
International Journal of Transportation Engineering, 68
6.8 Line Readiness to Work and its
Closure Decrease
In the previous sections, the factors directly increasing circulation of cars were examined. In this section, the effect of railway tracks on rolling stock productivity will be discussed. Total hours of line unavailability in the network of Iran railway due to line closure and failure was 625 hours in 1393(April 2014). Rail tracks could be closed for several reasons. Two main reasons are repairing tracks and signals as well as their maintenance. When the line is closed, trains will be stopped and not allowed to move. Thereby reducing line closure time will increase the application of existing rail fleet.
6.9 Utilization System of Rail Network
One of the most important factors of low productivity in railway is absence of fundamental transformation in movement mechanism of trains, in the other words, aged utilization system and old signaling system of rail network. Development of rail operation systems and signaling will increase capacity and speed of blocks, as well as reducing non-value-added times.
6.10 Bottlenecks in Rail Tracks
Load distribution is not uniform in rail network, it means that most of the rail cargoes pass through limited number of lines and rail network bottlenecks are identified. So investing on increasing the capacity of these lines will increase the total network speed and rolling stock productivity. For example, in case of closed stations reopening along Badrud- Ardakan route in Iran railway, the present usage of this line can be doubled.
6.11 Loading and Unloading Equipment
Received data indicate that in freight part during 1393 (2013), only 56% of “being loaded" wagons were loaded from loading sources; also for the same year, only 49% of “waiting for transfer and under unloading" cars
were discharged on their destinations (Iran Railway report, 2014). This Information mentions disproportion between loading and unloading equipment and cargo capacity in the network. So incompatibility between operation practice volume and loading and unloading equipment is one of the major current bottlenecks in railway utilization. This major bottleneck has reduced railway productivity due to increased wagons sedimentation (enhancement in wagon circulation period without any reason).
6.12 Information Technology and
Making System Smart
At the end of this section, smart system and information technology are proposed as one of the most important and in some cases the most cost-effective strategies for increasing productivity of rolling stock and even rail transport in general. For instance, use of technology and information technology allowed U.S railroads to reduce their work force from more than 500,000 to less than half from 1980 to 2010 [Kriem, 2011].
7.
Step Three: Suggestions for
Improvement of Rolling Stock
Productivity
69 International Journal of Transportation Engineering,
current situation of factors were obtained by using Likert spectrum and average result of experts’ responses. Comparing the importance and current status, that factors priority was determined. In the other words, if a factor importance is more and its current situation in Iran is worse, its priority for follow-up and relative actions will be higher. Extracted factors were classified in four groups of managerial, operational, fleet-relevant and rail infrastructure-related. Classification and prioritization of factors are presented in Table
7. Conclusions and Discussions
Taking all the aforementioned points into account, it can be concluded that productivity of existing Iranian railway fleet has not been in a good condition in recent years. Railway specific indicators showed that the main challenge of the Iran's railway productivity is rolling stock. So valid rolling stock indices were extracted and measured.
Table 7. Priority of effective factors on rolling stock productivity for improvement
Classification Factor priority
Infrastructure Reduce difference between line capacity in bottlenecks and other parts 1
Managerial Implementation of ideas, innovations and creativity related to fleet 2
Rail
Infrastructure Sufficient length and number of track in marshalling yards 3
Fleet Supervision on maintenance quality and Consumable parts of fleet 4
Operational marketing for railway transportation 5
Rail
Infrastructure Comprehensive systems for line maintenance 6
Fleet Existence of rolling stock maintenance system in railway companies 7
Operational Tracking vehicles in rail network 8
Managerial Attracting innovation, knowledge and technology to organization 9
Operational
Gathering rolling stock performance information such as average speed, delays, waiting time in origin, destination and terminals and loading and unloading
10
Managerial Rules Setting in order to create competition in rail transport 11
Operational Use of transport Container and Pallet 12
Operational More coordination in stations and loading and unloading ports 13
Managerial Improve education, creativity and ability of manpower 14
Fleet Suitable time determination for overhaul and semi-major repairs of fleet 15
Operational Daily or medium-term planning for wagons 16
Operational Using mechanized methods for Loading and unloading 17
Operational Preventive actions from unscheduled delays because of line failure,
Vandalism and theft, natural disasters, etc. 18
Operational Planning for Prevention from uncharged travels or with less than capacity 19
Operational Planning for car assembly 20
International Journal of Transportation Engineering, 70
Managerial Productivity consideration in each strategic or operational targeting 22
Rail
Infrastructure Improve signaling systems 23
Rail
Infrastructure Stations locating in population and freight centers 24
Operational Exact planning of trains and wagons movement 25
Operational Record of train delay causes and analyzing them 26
Managerial Approach changing from investment for infrastructure development to
investment for increase capacity 27
Rail
Infrastructure Time needed for line visit and maintenance 28
Fleet Forecast Mechanisms for Supervision on components distribution in
network 29
Operational Improve movement regulations 30
The rolling stock productivity indicators were reduced. Also the average rail journey for one unit of freight, journeys without filling whole capacity and wagons circulation period were increased. All indicators represent misuse of the existing railway fleet. Determined by experts, our analysis showed that the most important factors affecting the productivity of fleet was monitoring the quality of maintenance and consumable parts of fleet and sufficient length and number of track in marshalling yards. But the most prior factor for action in Iran was reduction of the track capacity differences between bottlenecks and other parts and blocks. To expand this research, future works should be conducted on simulation of the strategies and evaluation of the effects. This studies will assist the managers in decision making and implementing the strategies.
9. References
-Archila, Andres- Felipen, Sakamoto, Ryusuke, Fearing, Rebecca Cassler and Sussman, Joseph M. (2013) "Productivity of passenger rail transportation services in the northeast corridor", Presentation at the 2014 Annual Meeting of the Transportation Research Board.
-Beck, Arne, Bente, Heiner and Schilling, Martin (2013) "Railway efficiency: An overview and a look at opportunities for improvement", International Transport Forum Discussion Paper, No. 2013-12, International Transport Forum, Paris,
-Dingler, Mark, Koenig, Amanda, Sogin, Sam, and Barkan, Christopher P. L. (2010) "Determining the causes of train delay", Paper presented at the AREMA 2010 Annual Conference Proceedings.
-Emamimeybodi, Ali (1384) "Principles of measuring performance and productivity". institute for business studies and research publishing (In Persian)
-Gómez-Ibáñez, José. A (2004) "Railroad reform: an overview of the options", Paper presented at the Conference on Railway Reform Rafael del Pino Foundation, Madrid, September 18-19, 2004
71 International Journal of Transportation Engineering,
at the WCTR 2013: 12th World Conference on Transport Research, Rio de Janeiro, Brazil, 15-18 July 2013.
-Hilmola, Olli-Pekka (2007) "European railway freight transportation and adaptation to demand decline: Efficiency and partial productivity analysis from period of 1980-2003", International Journal of Productivity and Performance Management, Vol. 56, Issue.3, pp 205-225.
-INPO: Iran National Productivity Organization (1387 SH) "Productivity Indexes in Iran ."
-IR: Iran Railways (2014) "Fleet performance data report”.
-Jain, Priyanka, Cullinane, Sharon. and Cullinane, Kevin (2008) "The impact of governance development models on urban rail efficiency", Transportation Research Part A: Policy and Practice, Vol. 42, Issue.9, pp 1238-1250.
-Kriem, Youssef (2011) "Productivity of the US freight rail industry: A review of the past and prospects for the future", Submitted to the Department of Civil and Environmental Engineering in partial fulfillment of the requirements for the degree of Master of Science in Civil and Environment Engineering at Massachusetts Institute of Technology.
-Mizutani, Fumitoshi and Uranishi, Shuji. (2003) "The Effects of privatization on TFP growth and capital adjustments", Kobe
University Discussion Paper Series, Japan", Vol. 3.
-Mohri, S. Sina and Haghshenas, Hossein (2017) "Evaluation of Iran rail freight transportation efficiency in comparison between the world countries and the middle east and Central Asia", International Journal of Transportation Engineering, Volume 5, No 18, Autumn 2017, pp. 103-117
-Movahedi, M. M., Abtahi, S.Y. and Motamedi, M. (2011) "Iran railway efficiency analysis, using DEA: An international comparison", International Journal of Applied Operational Research-An Open Access Journal, No. 1, pp 1-7.
-NTC: National Transport Commission report (2008) "Rail poductivity information paper, Australia’s rail industry”.
-Oum, Tae Hoon, Waters, W. G, and Yu, Chunyan (1999) "A survey of productivity and efficiency measurement in rail transport", Journal of Transport Economics and Policy, Vol. 33, No. 1, pp. 9-42.
- Pourkazemi, M. H. and Soltani, H. A. (1386) "Assessment of productivity in Iranian Railway compared to Asian and Middle East Countries” Economic Research Journal", No 78. Spring 86, pp.87-121
International Journal of Transportation Engineering, 72
Appendix
Figure 7. Importance and current situation of effective factors on rolling stock productivity
0 0.5 1 1.5 2 2.5 3 3.5 4 4.5 Education, creativity and ability of manpower
Implementation of ideas, innovations and creativity Attracting innovation, knowledge and technology
Supervision on components distribution Planning for car assembly Suitable time determination for repairs
Supervision on maintenance quality Existence of rolling stock maintenance system
Tracking wagons in rail network Daily or medium-term planning for wagons Gathering rolling stock performance information Prevention from travels with less than capacity Rules setting in order to create competition in rail…
Use of transport container and pallet More coordination in stations and loading and… Improve planning of trains and wagons movement
Improve movement regulations Record of train delay causes and analyzing them Improve signaling systems Transfer of rail network utilization to the private sector Stations locating in population and freight centers Sufficient length and number of lines in marshalling yards Comprehensive systems for line maintenance Reduce time needed for line visit and maintenance Reduce difference between line capacity in bottlenecks…
Productivity Consideration in each targeting Approach changing for investment to increase capacity Using mechanized methods for Loading and unloading…
Marketing for railway transportation Preventive actions from unscheduled delays
73 International Journal of Transportation Engineering, Figure 8. ton-kilometer carried to the ready to work wagons per day
Figure 9. ton-kilometer carried to all wagons
0.96 0.98 1.00 1.02 1.04 1.06 1.08 1.10 1.12 1.14 1.16 1.18
1384 1386 1388 1390 1392 1394 1396
Million ton-kilometer carried per wagons
0.9 0.92 0.94 0.96 0.98 1 1.02 1.04 1.06 1.08 1.1 1.12
1384 1386 1388 1390 1392 1394 1396
International Journal of Transportation Engineering, 74
Figure 10. ton-kilometer carried per tonnage carried
Figure 11. tonnage carried per wagon
Figure 12. loading number per wagon in a year
0.61 0.62 0.63 0.64 0.65 0.66 0.67 0.68 0.69 0.7 0.71
1384 1386 1388 1390 1392 1394 1396
Million ton-kilometer per Thousand tons
1.42 1.44 1.46 1.48 1.5 1.52 1.54 1.56 1.58
1384 1386 1388 1390 1392 1394 1396
Thousand of tons per wagon
22.5 23 23.5 24 24.5 25 25.5 26 26.5 27
1384 1386 1388 1390 1392 1394 1396
75 International Journal of Transportation Engineering, Figure 13. total actual load (ton-kilometer) divided to total gross load (ton-kilometer)
Figure 14. ratio of income (expenses) to number of wagons
0 0.05 0.1 0.15 0.2 0.25 0.3 0.35 0.4 0.45
1384 1386 1388 1390 1392 1394 1396
Actual tonnage per gross tonnage
0 100 200 300 400 500 600 700 800 900 1000
1384 1386 1388 1390 1392 1394 1396
Millions of Rials to wagons