Open Access
Research article
Microarray analysis of RNA extracted from formalin-fixed,
paraffin-embedded and matched fresh-frozen ovarian
adenocarcinomas
Grazyna Fedorowicz
1, Steve Guerrero
2, Thomas D Wu
2and Zora Modrusan*
1Address: 1Department of Molecular Biology, Genentech, Inc., 1 DNA Way, South San Francisco, CA 94080, USA and 2Department of
Bioinformatics, Genentech, Inc., 1 DNA Way, South San Francisco, CA 94080, USA
Email: Grazyna Fedorowicz - [email protected]; Steve Guerrero - [email protected]; Thomas D Wu - [email protected]; Zora Modrusan* - [email protected]
* Corresponding author
Abstract
Background: Gene expression profiling of formalin-fixed, paraffin-embedded (FFPE) samples represents a valuable approach for advancing oncology diagnostics and enhancing retrospective clinical studies; however, at present, this methodology still requires optimization and thus has not been extensively used. Here, we utilized thorough quality control methods to assess RNA extracted from FFPE samples and then compared it to RNA extracted from matched fresh-frozen (FF) counterparts. We preformed genome-wide expression profiling of FF and FFPE ovarian serous adenocarcinoma sample pairs and compared their gene signatures to normal ovary samples.
Methods: RNA from FFPE samples was extracted using two different methods, Ambion and Agencourt, and its quality was determined by profiling starting total RNA on Bioanalyzer and by amplifying increasing size fragments of beta actin (ACTB) and claudin 3 (CLDN3) by reverse-transcriptase polymerase chain reaction. Five matched FF and FFPE ovarian serous adenocarcinoma samples, as well as a set of normal ovary samples, were profiled using whole genome Agilent microarrays. Reproducibility of the FF and FFPE replicates was measured using Pearson correlation, whereas comparison between the FF and FFPE samples was done using a Z-score analysis.
Results: Data analysis showed high reproducibility of expression within each FF and FFPE method, whereas matched FF and FFPE pairs demonstrated lower similarity, emphasizing an inherent difference between the two sample types. Z-score analysis of matched FF and FFPE samples revealed good concordance of top 100 differentially expressed genes with the highest correlation of 0.84. Genes characteristic of ovarian serous adenocarcinoma, including a well known marker
CLDN3, as well as potentially some novel markers, were identified by comparing gene expression
profiles of ovarian adenocarcinoma to those of normal ovary.
Conclusion: Conclusively, we showed that systematic assessment of FFPE samples at the RNA level is essential for obtaining good quality gene expression microarray data. We also demonstrated that profiling of not only FF but also of FFPE samples can be successfully used to identify differentially expressed genes characteristic of ovarian carcinoma.
Published: 8 May 2009
BMC Medical Genomics 2009, 2:23 doi:10.1186/1755-8794-2-23
Received: 28 October 2008 Accepted: 8 May 2009
This article is available from: http://www.biomedcentral.com/1755-8794/2/23
© 2009 Fedorowicz et al; licensee BioMed Central Ltd.
Background
According to the American Cancer Society, ovarian cancer is the fifth leading cause of cancer deaths in women in the United States. The most common, epithelial, type of ovar-ian cancer can be divided into several subtypes including: serous, endometrioid, mucinous, clear cell and undiffer-entiated. Serous adenocarcinoma comprises majority of cases and exhibits a poor 5-year survival rate. Up to 90% of ovarian cancers might be cured if identified in an early stage. When diagnosed in later stages, the rate drops sig-nificantly to a range of 30–50%. Detection of ovarian can-cer is often delayed or missed because of a lack of clear symptoms and absence of reliable diagnostic methods. Cancer marker 125 (CA125), the product of mucin 16, is currently used for testing patients with elevated risk of ovarian cancer. However, this marker alone does not pro-vide the required sensitivity or specificity to detect all cases [1]. Another gene, claudin 3 (CLDN3), has been found to be highly expressed at gene and protein levels and thus has been suggested as a reliable marker of ovar-ian cancer [2-5].
Large repositories of formalin-fixed, paraffin-embedded (FFPE) samples are available and could be used to identify markers for diagnosis of many diseases. While tissue integrity in FFPE specimens is often better preserved than in matched fresh-frozen (FF) counterparts, the quality of nucleic acids in FFPE samples is far from optimal due to chemical crosslinking and nucleic acid fragmentation [6-8]. Despite the detrimental effect of the fixative, numerous studies using archived FFPE samples have generated satis-factory reverse-transcriptase polymerase chain reaction (RT-PCR) data [9-13]. Recently, a number of genome-wide microarray studies has been conducted to investigate gene expression in FFPE samples or to compare the per-formance of FFPE samples with their matched FF counter-parts [14-23]. While the results of some studies are discouraging [16,19], many archived FFPE samples have been successfully used to identify prognostic and diagnos-tic gene signatures for numerous diseases, including vari-ous carcinomas [21-24].
Methods
Samples
Matched FF and FFPE samples were obtained from five ovarian serous adenocarcinoma patients. Samples 3136, 3138, 3194 and 3207 were collected on 11/2004, 11/ 2004, 05/2005, and 06/2005, respectively. A portion of each sample was either frozen at -80°C until extraction or fixed within 30 minutes of surgery by incubation in 10% neutral-buffered formalin (NBF) for 4–18 hours at 4°C. Patient sample 390 was collected on 01/2005 and was either frozen or fixed for 24 hours at room temperature in 10% NBF within 30 minutes of surgery. Only tumor sam-ples containing minimal necrosis (<10%) and consisting
of 70% or more tumor cells were used in this study. A set of normal ovary samples was obtained from different patients by dissecting normal tissue adjacent to tumors. All tumor and normal ovary samples were acquired com-mercially by the Human Tissue Lab at Genentech.
RNA extraction methods
FF samples
Three 10-micron sections were homogenized individually and RNA was extracted using the RNeasy Lipid Tissue Mini Kit (Qiagen, San Diego, CA). Replicate RNA preps were pooled to obtain sufficient amounts of starting mate-rial. For normal ovary samples, RNA was extracted using Qiagen's ALLPrep method that included on-column DNase treatment.
FFPE samples
After evaluating four FFPE RNA extraction methods (Inv-itrogen PureLink, Ambion RecoverAll, Ambion Optimum and Agencourt FormaPure; data not shown), the Opti-mum FFPE RNA Isolation Kit (Ambion, Austin, TX) and the FormaPure Kit (Agencourt, Beverly, MA) were selected for this study based on their potential to generate the most abundant population of high molecular weight RNA frag-ments. The two methods were used to extract RNA from five archived FFPE ovarian serous adenocarcinoma sam-ples. Up to eight 10-micron FFPE sections were processed per patient. Ambion's RNA extraction procedure was opti-mized for maximum RNA recovery (Susanna Stinson, Genentech, Inc., personal communication) by elevating the temperature of the first 10 min deparaffinization to 55°C and digesting the samples for 3 hours at 55°C. After adding a fresh aliquot of Proteinase K, the samples were digested for an additional hour at 55°C. The Agencourt protocol was followed without any modifications. DNase treatment was applied to both FF and FFPE samples and was followed by phenol:chloroform:isoamyl alcohol purification and ethanol precipitation.
Quality control methods
The quantity of RNA and labeled cRNA was measured using Nanodrop ND-1000 UV-spectrophotometer (Nano-Drop Technologies, Wilmington, DE). Specific activity of cRNA, calculated as picomoles of Cy5 dye per microgram (μg) of cRNA, was also measured by Nanodrop. Sample integrity was evaluated by profiling both RNA and cRNA on Agilent 2100 Bioanalyzer (Agilent Technologies, Santa Clara, CA).
CAGTCG-GTTGGAGCGAGCATCC, 600 F CTCCATCGTCCACCG-CAAATGC, 800 F GGCACCACCATGTACCCTGGCA and R TCAAGTCAGTGTACAGGTAAGCC. The following 5'-3' primers were used to amplify CLDN3 [GenBank: NM_001306]: 200 F CCATCCAGCGTGCAGCCTTGC, 400 F GCTGCTCTGCTGCTCGTGTCC, 600 F CCAAGAT-CACCATCGTGGCAGG, 800 F GCCTGTGGATGAACT-GCGTGG and R AGTATTGGCGGTCACCCAGGC. Five nanograms of RNA were used as a template for reverse transcription (30 min at 50°C), followed by activation of the HotStarTaq polymerase (15 min at 95°C), 35 cycles of PCR (30 sec at 95°C, 30 sec at 60°C, and 1 min at 72°C), and final 10 min extension at 72°C. Each fragment was amplified individually; however, all of them were pooled and electrophoresed in a single lane. PCR products were visualized on 4% agarose e-gels (Invitrogen, Carlsbad, CA). SimplyLoad 100 bp DNA Ladder (Lonza, Basel, Swit-zerland) was used to determine product size.
Microarrays
Total RNA was labeled according to Agilent's Low RNA Input Fluorescent Linear Amplification Kit. The test sam-ples (i.e. RNA from FF and FFPE samsam-ples) were labeled with the Cy5 dye and the reference sample (i.e. Universal Human Reference, Stratagene, La Jolla, CA) was labeled with the Cy3 dye. Matched FF samples (5 patients, 2 rep-licates) and FFPE samples extracted using either the Agen-court method (5 patients, 3 replicates for 3136, 3138 and 3194, 2 replicates for 3207 and 390) or the Ambion method (5 patients, no replicates) were hybridized to Agi-lent Whole Human Genome 4×44K microarrays accord-ing to the manufacturer's protocol. Microarray images were analyzed using Agilent's Feature Extraction (FE) soft-ware, version 9.5.
Data analysis
Reproducibility of the FF and FFPE sample types was measured using Pearson correlations (r). Only "passing" probes were included in this analysis, where "passing" consisted of probes that were not recognized as outliers by the FE software, were significantly above background, and had a P value of the Cy5/Cy3 ratio below 0.05. We com-pared results between sample types (frozen versus fixed) by applying a Z-score analysis [25] to the four samples whose quality was adequate for microarray profiling (3136, 3138, 3194, and 3207). For small data sets, the Z-score technique provides a method for determining genes that have significantly different expression in a single sam-ple relative to other samsam-ples. These scores indicate the degree of deviation from the mean, in terms of the number of standard deviations, and they are likely to reveal well-behaving probes because they impose two requirements: a large deviation in one sample compared to the remaining samples, indicating a likely true biologi-cal difference in expression, and a small standard error, indicating that the probe set gives consistent
measure-ments in the remaining n-1 samples. Before the Z-score analyses were applied, we computed geometric means of relevant replicate measurements for the two groups: FF tumor (4 patients, excluding sample 390) and Agen-court tumor (4 patients, excluding sample 390). FFPE-Ambion tumor samples were not included in the Z-score analysis. We then computed Z-scores for each FFPE sam-ple relative to the remaining three FFPE samsam-ples with a constant factor of 1 added to the denominator to avoid situations where the standard error was spuriously close to zero. For comparison, we also computed Z-scores using the same methodology for each of the FF samples relative to the other three FF samples. We then evaluated three cri-teria for filtering data from the FFPE samples. First, we considered all probes assayed on the array. Second, we considered only those probes where the Cy5 channel had a value of 1000 or greater ("1000 Cy5"). Finally, we con-sidered top 100 differentially expressed probes that were both "1000 Cy5" and had the largest Z-scores, namely, the top 50 positive and top 50 negative Z-scores ("100 DE"). For each matched pair, we compared the selected FFPE Z-scores with corresponding FF Z-Z-scores. Furthermore, for each of these three criteria, we evaluated correlation both quantitatively and qualitatively. The quantitative compar-ison measured the Pearson correlations of the Z-scores between the FFPE and FF samples. For the qualitative comparison, we tallied the "100 DE" probes whose signs of the FFPE Z-scores were the same as or opposite of the corresponding FF scores. The reported misclassification rates reflect the number of opposite-sign probes as a frac-tion of the total 100 probes.
Identification of genes that were differentially expressed in serous adenocarcinoma compared to normal ovary was achieved by a stepwise analysis. First, probes "passing" in all replicates of the four groups including FF, FFPE-Agen-court, and FFPE-Ambion tumors (see replicate details above) and FF normal samples (5 patients, 2 replicates per patient) were selected. Replicate Cy5/Cy3 ratios for each passing probe were averaged within a method before per-forming the Cyber t-test [26]. This t-test compared Cy5/ Cy3 log10 ratios of FF tumor (n = 5) vs normal (n = 5) and FFPE tumor (n = 4) vs normal (n = 5); only probes with P values of equal to or less than 0.05 were considered fur-ther. All patient samples within a method were then aver-aged by calculating geometric means of the Cy5/Cy3 ratios for the genes that passed the two previous criteria ("passing" and t-test P value cutoff of 0.05). The resulting tumor-to-normal ratios are reported, where the ratio is at least 2-fold higher in all tumors than in all normals.
Results
Quality assessment of FF and FFPE samples
showed high quality of RNA; 18S and 28S ribosomal peaks were present in all samples giving RNA Integrity Numbers (RINs) from 6.5 to 8.5. In contrast, the land-mark ribosomal peaks were not detected in any of the FFPE samples, resulting in lower RINs. Since RINs depend on the presence of ribosomal peaks in the RNA samples, they can not accurately reflect the quality of FFPE RNA. For example, the most degraded sample 390 showed the highest RINs among all FFPE samples. RNA profiles obtained from the FFPE samples were similar for the two RNA extraction methods. FFPE samples 3138, 3194, and 3207 exhibited desirable profiles with elevated levels of high molecular weight RNAs. In contrast, small molecular weight RNAs were recognized as a sharp peak between 25 and 200 nucleotides (nt); the peak was the most promi-nent feature in samples 3136 and 390. Closer comparison between these two samples revealed that sample 3136
contained relatively low level of high molecular weight RNA fragments, while a flat electropherogram beyond 500 nt suggests absence of such RNA fragments in sample 390. Based on these results, FFPE sample 390 was classi-fied as having inadequate RNA quality; this was surprising since slide examination indicated that it contained well preserved tissue.
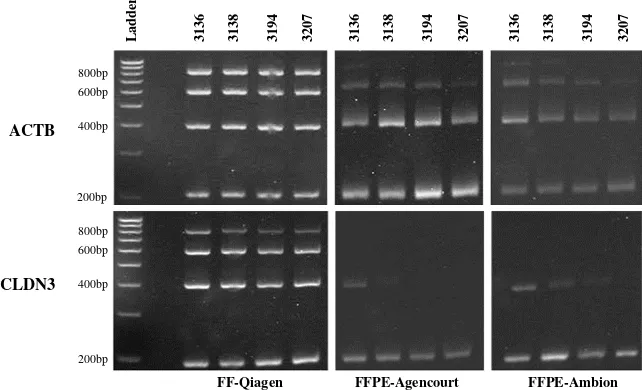
Additional quality assessment of total RNA obtained from matched FF and FFPE samples was done by RT-PCR amplification of different length fragments of ACTB and
CLDN3 genes. As expected, RNA from FF samples resulted in amplification of all fragment sizes (Figure 2). The larg-est amplicon, 800 bp, was observed only in FF samples, suggesting that intact RNA of such length was rare in FFPE samples. RNA extracted from FFPE sample 390 failed to produce any ACTB and CLDN3 fragments (data not
Bioanalyzer profiles of total RNA (A) and cRNA (B) of matched FF and FFPE ovarian serous adenocarcinoma samples 3136, 3138, 3194, 3207 and 390
Figure 1
Bioanalyzer profiles of total RNA (A) and cRNA (B) of matched FF and FFPE ovarian serous adenocarcinoma samples 3136, 3138, 3194, 3207 and 390. The method used for RNA extraction (Qiagen, Agencourt, Ambion) is indicated for each sample type. The RNA Integrity Number (RIN) is shown next to each total RNA profile.
3194 3138 3136
3207
390
FF-Qiagen FFPE-Agencourt FFPE-Ambion 3194
3138 3136
3207
390
FF-Qiagen FFPE-Agencourt FFPE-Ambion A
RIN: 7.6
RIN: 6.5
RIN: 8.5 RIN: 2.5 RIN: 2.3
RIN: 2.2
RIN: 7.2
RIN: 2.6 RIN: 2.3
RIN: 7.8 RIN: 2.6
RIN: 2.3 RIN: 2.1 RIN: N/A RIN: 2.3
shown). For the remaining four FFPE samples, amplifica-tion of 200 bp, 400 bp and 600 bp fragments was achieved for the ACTB gene. For CLDN3, the 200 bp amplicon was detected in four FFPE samples. The 400 bp fragment was detected in two samples (3136 and 3138); one additional sample that was processed with the Ambion method (3194) showed weak presence of this amplicon, suggesting that it may have more intact RNA compared to the Agencourt counterpart. In contrast to
ACTB, CLDN3 amplicons >400 bp were not detected in any of the FFPE samples.
cRNA yields from FF samples averaged at 12.5 μg, while those from FFPE samples ranged from 2.2 to 6.1 μg. This illustrates greater dependence of cRNA yield on RNA qual-ity than on quantqual-ity since equal amounts of total RNA were used to generate cRNAs. High specific activities rang-ing from 10.9 to 13.6 pmol Cy5/μg were observed for cRNAs from FF samples. The corresponding FFPE samples resulted in noticeably lower specific activities ranging from 1.6 to 7.6 pmol Cy5/μg cRNA. FFPE sample 390 had the lowest dye incorporation compared to all other sam-ples: 1.6 and 2.4 pmol Cy5/μg cRNA for Agencourt and Ambion, respectively. Based on this result, as well as on poor RNA quality described above, FFPE sample 390 was expected to perform poorly in subsequent expression pro-filing.
Similar to the quality assessment of total RNA, labeled cRNA was also examined on the 2100 Bioanalyzer (Figure 1B). The size distribution of cRNA was very different when
comparing electropherograms obtained from FF and FFPE samples. In FF samples, cRNAs showed a wide profile encompassing molecular weight size above 4000 nt, with the highest frequency of fragments in ~200 nt range. In contrast, cRNAs generated from FFPE samples had narrow profiles of up to ~1000 nt, with the highest frequency of fragments in ~100 nt range. Similar to the initial total RNA profile, cRNA for sample 390 showed a very narrow distribution range and lacked fragments above ~500 nt.
Gene expression profiling
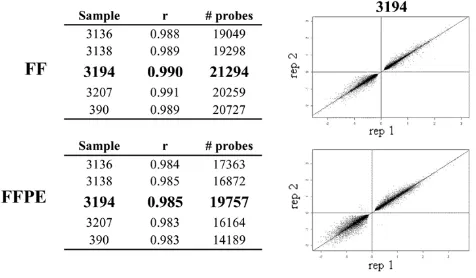
Reproducibility of genome-wide expression profiling of FF and FFPE samples was calculated using Pearson corre-lations (r). As shown in Figure 3, high reproducibility across replicates was observed regardless of the sample type. The r value for "passing" probes (see Methods) ranged from 0.988 to 0.991 within FF replicates and from 0.983 to 0.985 within FFPE replicates. Although both FF and FFPE samples displayed similar r values, scatter graphs obtained by plotting log2 ratio values of FF
repli-cates appeared tighter compared to the FFPE replirepli-cates. The lowest number of passing probes was observed in FFPE sample 390; this was not surprising since this sample was classified as inadequate for expression profiling based on the quality of RNA and cRNA. Thus, sample 390 was not taken into account in subsequent analyses.
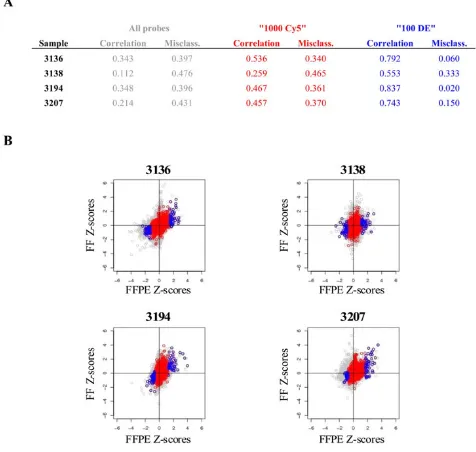
Z-score analysis was used to determine the level of con-cordance between matched FF and FFPE-Agencourt sam-ples. As shown in Figure 4A, the three selection criteria showed progressively increasing correlations and
decreas-RT-PCR amplification of different fragment sizes (200, 400, 600 and 800 bp) of ACTB and CLDN3 genes in FF and matched FFPE ovarian adenocarcinoma samples 3136, 3138, 3194, and 3207
Figure 2
RT-PCR amplification of different fragment sizes (200, 400, 600 and 800 bp) of ACTB and CLDN3 genes in FF and matched FFPE ovarian adenocarcinoma samples 3136, 3138, 3194, and 3207. The method used for RNA extraction is indicated next to each sample type.
3136 3138 3194 3207
Lad
d
er
FF-Qiagen FFPE-Agencourt FFPE-Ambion
ACTB
CLDN3 800bp 600bp
400bp
200bp
800bp 600bp
400bp
200bp
ing misclassification rates, with the "100 DE" criterion achieving the best concordance. Sample 3138 showed the lowest concordance between its FF and FFPE z-scores, achieving a correlation of 0.553 and misclassification rate of 33%. However, the remaining samples showed rela-tively high correlations ranging from 0.743 to 0.837 and misclassification rates of 2–15%. The scatter plots of FF and FFPE Z-scores (Figure 4B) indicate that the three filter-ing criteria place tighter bounds on the analyses and the Z-scores for probe sets obtained under the "1000 Cy5" and "100 DE" criteria fall close to the diagonal axes. These two criteria also produce qualitatively better results with the differentially expressed probes found predominantly in the first and third quadrants of the plots.
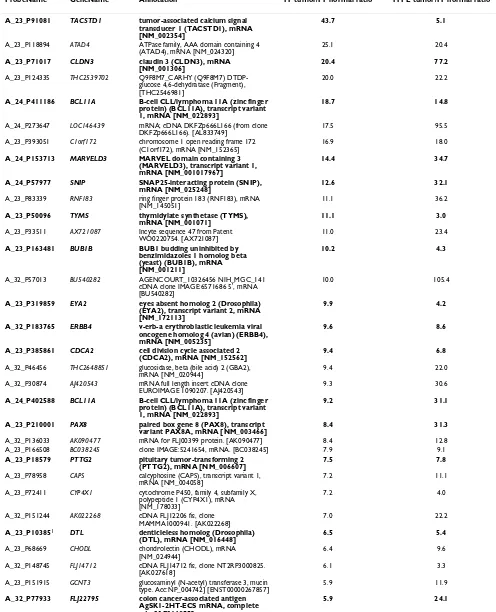
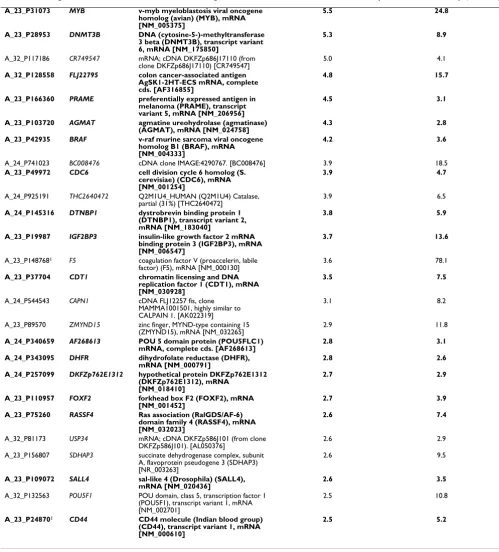
Microarray gene expression profiles from ovarian tumor samples were also compared to those of normal ovary tis-sue. The analysis of four patient samples, including FF as well as FFPE samples processed by the Ambion and Agen-court methods, identified 56 genes whose expression was at least two-fold higher in tumor than in normal ovary. Table 1 lists tumor-to-normal ratios obtained from the FF and FFPE-Agencourt samples. Thirty three out of these 56 genes have been previously associated with various can-cers and include cell cycle regulatory genes CDC6 [27],
CDT1 [28] and DTL [29]. A well known marker of ovarian serous carcinoma, CLDN3, appeared at the top of the list. In contrast, the probe for CA125 was not classified as "passing" in all of the samples and thus it is not included in the list. Several other genes, including TACSTD1 [3],
PRAME [30] and ERBB4 [31], have been linked to ovarian tumorigenesis. PAX8 has been recently reported as a use-ful marker for the differentiation between ovarian and metastasized breast carcinoma [32]. Finally, the
remain-ing genes that we identified as overexpressed in tumor samples may potentially represent some novel markers of ovarian cancer.
Discussion
FFPE samples are a desirable source of archival material for gene expression profiling studies due to their availabil-ity and the possibilavailabil-ity of retrospective studies. At present, great variability is still being observed between gene expression profiles of matched FF and FFPE samples. Sam-ple source and its classification, as well as the conditions used to fix and store samples, are some of many possible variables influencing gene expression. For example, a study relying on controlled fixation conditions to process bone marrow cells reported that FFPE samples appeared very similar to those of unfixed frozen equivalents [14]. However, controlled fixation procedure and use of cells may not represent an optimal approach to demonstrate the performance of archived FFPE tissue samples. Unsur-prisingly, we have previously observed that FFPE cell pel-lets dissociated faster during Proteinase K digestion and often resulted in better RNA quality compared to FFPE tis-sues.
FFPE samples are routinely prepared by fixing tissues in 10% neutral-buffered formalin for 12 to 24 hours at ambient temperature. The FFPE samples used in this study, except for sample 390, were fixed in formalin for 4 to 18 hours at 4°C. These samples appear to perform bet-ter than sample 390 which was fixed using routine condi-tions. Thus, it appears that shorter time and lower temperature of fixation can significantly affect FFPE sam-ple quality. Other variables such as size of collected tissue, time elapsed to fixation and storage time could have fur-ther affected this outcome [33,34]. Regarding storage time, we have noticed that ribosomal RNA peaks could be detected in FFPE samples that were stored properly for up to one year and not for longer periods of time (data not shown).
Two commercially available FFPE RNA isolation kits, Ambion Optimum and Agencourt FormaPure, were tested here for extracting RNA from five FFPE ovarian serous ade-nocarcinoma samples. Sufficient amounts of total RNA for gene expression profiling were achieved by processing two to eight FFPE sections per patient. Despite pooling multiple sections, the RNA yields from FFPE samples were always significantly lower compared to those obtained from FF samples (data not shown). In addition, the obtained RNA amount was not proportional to the sur-face area of tissues used for RNA extraction. Although sig-nificant necrosis was not detected in any of the sections, we noticed differences in tissue density and composition. For example, presence of vasculature and adipose was detected in some sections and undoubtedly affected the
Reproducibility of gene expression profiling within FF and FFPE sample type
Figure 3
amounts of recovered nucleic acids. With respect to tissue content, all FFPE samples used in this study were required to contain 70–85% tumor cells, ensuring that they truly represented ovarian serous adenocarcinomas.
Two quality control assays, the Agilent 2100 Bioanalyzer and RT-PCR, were employed to assess the integrity of RNA obtained from FF and FFPE samples. Although RNA pro-files from FFPE samples lacked well defined 18S and 28S ribosomal peaks, the method was successful in identifying inadequate samples, such as sample 390, containing pre-dominantly small molecular weight fragments (<200 nt). Our RT-PCR assay tested the RNA for the presence of dif-ferent size fragments of two genes, ACTB and CLDN3. Not surprisingly, we were not able to amplify any fragments in FFPE sample 390. Thus, the data synergy observed between the Bioanalyzer and the RT-PCR assay proved to be very useful in qualifying FFPE samples suitable for gene expression profiling on microarrays. These two assays also demonstrated that both the Ambion Optimum and the Agencourt FormaPure methods were successful in obtain-ing RNA of similar quality. Together, the combination of quality control methods used here should be effective in recognizing poor-performing FFPE samples and could be used to prevent unnecessary array hybridizations. A differ-ent method for iddiffer-entifying unacceptable FFPE samples has been described by NuGEN Technologies [35].
Gene expression profiling data of ovarian tumors demon-strated high correlations between replicate FF (≥0.988) and FFPE samples (≥0.983), illustrating good reproduci-bility of each method. Although reproducible, gene expression profiling of FFPE samples is affected by reduced number of "passing" probes (33–46% compared to 44–49% in FF) and thus detects fewer differentially expressed genes compared to FF samples. Lassmann et al. recently reported similar findings by detecting 36% and 50% of probes for FFPE and FF samples, respectively [20]. Our comparison between FF and their matched FFPE sam-ples revealed the highest concordance of 0.84 for sample 3194. Although not directly comparable, a mean concord-ance of 0.86 was reported previously when comparing matched FF and FFPE samples on a different microarray platform [17]. Haque et al. reported a correlation of 0.65 between unmatched FF and FFPE pediatric glioblastomas [23]. While the magnitude of differential expression in FFPE samples might not be accurate, our Z-score analysis indicated that the direction of the change was correct in most cases, as demonstrated by low misclassification rates.
The comparison of ovarian serous adenocarcinoma to normal ovary identified 56 genes that are overexpressed in both FF and FFPE tumor samples. Several genes among them, including CLDN3, were previously recognized for their roles in ovarian tumorigenesis, [2-5,30-32]; addi-tional genes with unknown roles were also identified. Pro-filing of archival FFPE samples has been used previously to identify gene signatures that may serve as prognostic and diagnostic markers [20-24]. Regarding ovarian can-cer, a set of 86 gene signatures that seems to predict overall survival was recently identified by microarray profiling [36]. Furthermore, 57 of these 86 genes were confirmed in an independent dataset [37]. Together, these findings sug-gest that archival FFPE samples can be successfully used to identify potentially novel disease markers. At the same time, it is recognized that gene expression profiling of FFPE samples on microarrays has some limitations. In our study, as well as in Van Deerlin et al. [38], the magnitude of differential expression was typically higher in FFPE than in FF samples, suggesting higher level of noise in the FFPE data. Therefore, the elimination of false positives and identification of subtle changes in gene expression in FFPE samples remain challenging, especially in studies lacking FF counterparts.
Technological improvements in handling FFPE samples are constantly evolving; some of them clearly lead towards better quality of microarray expression data. One such improvement entails a change in primers used during amplification. At present, commonly used procedures rely on oligo (dT) primers which introduce 3' end bias
Z-score analyses comparing FFPE and FF samples Figure 4
Table 1: List of genes whose ratios are at least two-fold higher in ovarian serous adenocarcinoma compared to normal ovary.
ProbeName GeneName Annotation FF tumor/FF normal ratio FFPE tumor/FF normal ratio
A_23_P91081 TACSTD1 tumor-associated calcium signal transducer 1 (TACSTD1), mRNA [NM_002354]
43.7 5.1
A_23_P118894 ATAD4 ATPase family, AAA domain containing 4 (ATAD4), mRNA [NM_024320]
25.1 20.4
A_23_P71017 CLDN3 claudin 3 (CLDN3), mRNA [NM_001306]
20.4 77.2
A_23_P124335 THC2539702 Q9F8M7_CARHY (Q9F8M7) DTDP-glucose 4,6-dehydratase (Fragment), [THC2546981]
20.0 22.2
A_24_P411186 BCL11A B-cell CLL/lymphoma 11A (zinc finger protein) (BCL11A), transcript variant 1, mRNA [NM_022893]
18.7 14.8
A_24_P273647 LOC146439 mRNA; cDNA DKFZp666L166 (from clone DKFZp666L166). [AL833749]
17.5 95.5
A_23_P393051 C1orf172 chromosome 1 open reading frame 172 (C1orf172), mRNA [NM_152365]
16.9 18.0
A_24_P153713 MARVELD3 MARVEL domain containing 3 (MARVELD3), transcript variant 1, mRNA [NM_001017967]
14.4 34.7
A_24_P57977 SNIP SNAP25-interacting protein (SNIP), mRNA [NM_025248]
12.6 32.1
A_23_P83339 RNF183 ring finger protein 183 (RNF183), mRNA
[NM_145051] 11.1 36.2
A_23_P50096 TYMS thymidylate synthetase (TYMS), mRNA [NM_001071]
11.1 3.0
A_23_P33511 AX721087 Incyte sequence 47 from Patent WO0220754. [AX721087]
11.0 23.4
A_23_P163481 BUB1B BUB1 budding uninhibited by benzimidazoles 1 homolog beta (yeast) (BUB1B), mRNA [NM_001211]
10.2 4.3
A_32_P57013 BU540282 AGENCOURT_10326456 NIH_MGC_141 cDNA clone IMAGE:6571686 5', mRNA [BU540282]
10.0 105.4
A_23_P319859 EYA2 eyes absent homolog 2 (Drosophila) (EYA2), transcript variant 2, mRNA [NM_172113]
9.9 4.2
A_32_P183765 ERBB4 v-erb-a erythroblastic leukemia viral oncogene homolog 4 (avian) (ERBB4), mRNA [NM_005235]
9.6 8.6
A_23_P385861 CDCA2 cell division cycle associated 2 (CDCA2), mRNA [NM_152562]
9.4 6.8
A_32_P46456 THC2648851 glucosidase, beta (bile acid) 2 (GBA2), mRNA [NM_020944]
9.4 22.0
A_32_P30874 AJ420543 mRNA full length insert cDNA clone EUROIMAGE 1090207. [AJ420543]
9.3 30.6
A_24_P402588 BCL11A B-cell CLL/lymphoma 11A (zinc finger protein) (BCL11A), transcript variant 1, mRNA [NM_022893]
9.2 31.1
A_23_P210001 PAX8 paired box gene 8 (PAX8), transcript variant PAX8A, mRNA [NM_003466]
8.4 31.3
A_32_P136033 AK090477 mRNA for FLJ00399 protein. [AK090477] 8.4 12.8 A_23_P166508 BC038245 clone IMAGE:5241654, mRNA. [BC038245] 7.9 9.1
A_23_P18579 PTTG2 pituitary tumor-transforming 2
(PTTG2), mRNA [NM_006607] 7.5 7.8
A_23_P78958 CAPS calcyphosine (CAPS), transcript variant 1, mRNA [NM_004058]
7.2 11.1
A_23_P72411 CYP4X1 cytochrome P450, family 4, subfamily X, polypeptide 1 (CYP4X1), mRNA [NM_178033]
7.2 4.0
A_32_P151244 AK022268 cDNA FLJ12206 fis, clone MAMMA1000941. [AK022268]
7.0 22.2
A_23_P103851 DTL denticleless homolog (Drosophila)
(DTL), mRNA [NM_016448]
6.5 5.4
A_23_P68669 CHODL chondrolectin (CHODL), mRNA [NM_024944]
6.4 9.6
A_32_P148745 FLJ14712 cDNA FLJ14712 fis, clone NT2RP3000825. [AK027618]
6.1 3.3
A_23_P151915 GCNT3 glucosaminyl (N-acetyl) transferase 3, mucin type. Acc:NP_004742] [ENST00000267857]
5.9 11.9
A_32_P77933 FLJ22795 colon cancer-associated antigen AgSK1-2HT-ECS mRNA, complete cds. [AF316855]
A_23_P31073 MYB v-myb myeloblastosis viral oncogene homolog (avian) (MYB), mRNA [NM_005375]
5.5 24.8
A_23_P28953 DNMT3B DNA (cytosine-5-)-methyltransferase 3 beta (DNMT3B), transcript variant 6, mRNA [NM_175850]
5.3 8.9
A_32_P117186 CR749547 mRNA; cDNA DKFZp686J17110 (from clone DKFZp686J17110) [CR749547]
5.0 4.1
A_32_P128558 FLJ22795 colon cancer-associated antigen AgSK1-2HT-ECS mRNA, complete cds. [AF316855]
4.8 15.7
A_23_P166360 PRAME preferentially expressed antigen in melanoma (PRAME), transcript variant 5, mRNA [NM_206956]
4.5 3.1
A_23_P103720 AGMAT agmatine ureohydrolase (agmatinase) (AGMAT), mRNA [NM_024758]
4.3 2.8
A_23_P42935 BRAF v-raf murine sarcoma viral oncogene homolog B1 (BRAF), mRNA [NM_004333]
4.2 3.6
A_24_P741023 BC008476 cDNA clone IMAGE:4290767. [BC008476] 3.9 18.5
A_23_P49972 CDC6 cell division cycle 6 homolog (S. cerevisiae) (CDC6), mRNA [NM_001254]
3.9 4.7
A_24_P925191 THC2640472 Q2M1U4_HUMAN (Q2M1U4) Catalase, partial (31%) [THC2640472]
3.9 6.5
A_24_P145316 DTNBP1 dystrobrevin binding protein 1 (DTNBP1), transcript variant 2, mRNA [NM_183040]
3.8 5.9
A_23_P19987 IGF2BP3 insulin-like growth factor 2 mRNA binding protein 3 (IGF2BP3), mRNA [NM_006547]
3.7 13.6
A_23_P1487681 F5 coagulation factor V (proaccelerin, labile factor) (F5), mRNA [NM_000130]
3.6 78.1
A_23_P37704 CDT1 chromatin licensing and DNA replication factor 1 (CDT1), mRNA [NM_030928]
3.5 7.5
A_24_P544543 CAPN1 cDNA FLJ12257 fis, clone MAMMA1001501, highly similar to CALPAIN 1. [AK022319]
3.1 8.2
A_23_P89570 ZMYND15 zinc finger, MYND-type containing 15 (ZMYND15), mRNA [NM_032265]
2.9 11.8
A_24_P340659 AF268613 POU 5 domain protein (POU5FLC1) mRNA, complete cds. [AF268613]
2.8 3.1
A_24_P343095 DHFR dihydrofolate reductase (DHFR), mRNA [NM_000791]
2.8 2.6
A_24_P257099 DKFZp762E1312 hypothetical protein DKFZp762E1312 (DKFZp762E1312), mRNA
[NM_018410]
2.7 2.9
A_23_P110957 FOXF2 forkhead box F2 (FOXF2), mRNA
[NM_001452] 2.7 3.9
A_23_P75260 RASSF4 Ras association (RalGDS/AF-6) domain family 4 (RASSF4), mRNA [NM_032023]
2.6 7.4
A_32_P81173 USP34 mRNA; cDNA DKFZp586J101 (from clone DKFZp586J101). [AL050376]
2.6 2.9
A_23_P156807 SDHAP3 succinate dehydrogenase complex, subunit A, flavoprotein pseudogene 3 (SDHAP3) [NR_003263]
2.6 9.5
A_23_P109072 SALL4 sal-like 4 (Drosophila) (SALL4), mRNA [NM_020436]
2.6 3.5
A_32_P132563 POU5F1 POU domain, class 5, transcription factor 1 (POU5F1), transcript variant 1, mRNA [NM_002701]
2.5 10.8
A_23_P248701 CD44 CD44 molecule (Indian blood group)
(CD44), transcript variant 1, mRNA [NM_000610]
2.5 5.2
Genes associated with cancer in previous reports are shown in bold. Fold change P≤0.05. Genes are sorted according to descending FF tumor/nomal ratios. 1Probe is represented on microarrays multiple times; average of multiple measurements is reported here.
[17,39]; consequently, most commercial microarrays have probes designed within the last several hundred bases of each transcript. A new amplification procedure, developed recently by NuGEN, utilizes random primers in addition to oligo (dT) primers, thus alleviating the 3' end bias. Initial studies suggest that such whole transcript amplification provides a significant advantage when processing FFPE samples [14,20]. Thus, this amplification method deserves further investigation and holds promise for improving the performance of FFPE samples in future microarray profiling studies.
Conclusion
Five matched FFPE and FF ovarian tumor samples were profiled on microarrays, illustrating the level of gene expression similarity between the two sample types. Ovar-ian tumor and normal samples were also compared, iden-tifying a set of differentially expressed genes characteristic of ovarian adenocarcinoma. Conclusively, our study dem-onstrates that archived clinical samples, such as FFPE ovarian adenocarcinomas, represent a valuable source for genome-wide expression profiling and can be successfully used for the identification of potentially novel carcinoma markers. Further improvements in FFPE sample handling and new amplification approaches hold promise for even better performance of FFPE samples in future microarray studies.
Competing interests
The authors declare that they have no competing interests.
Authors' contributions
GF designed and carried out microarray experiments, SG and TDW performed data analyses and ZM conceived and directed the project. GF and ZM wrote the manuscript.
Acknowledgements
We would like to thank Susanna Stinson for optimizing the FFPE RNA extraction procedure, Deepali Bhatt for extracting normal ovary RNA, Human Tissue Bank and Pathology personnel for providing matched FF and FFPE serous adenocarcinomas, and the Oligo group for synthesizing prim-ers.
References
1. Rosen DG, Wang L, Atkinson N, Yu Y, Lu KH, Diamandis EP, Hell-strom I, Mok SC, Liu J, Bast RC Jr: Potential markers that com-plement expression of CA125 in epithelial ovarian cancer.
Gynecol Oncol 2005, 99:267-277.
2. Choi YL, Kim J, Kwon MJ, Choi JS, Kim TJ, Bae DS, Koh SS, In YH, Park YW, Kim SH, Ahn G, Shin YK: Expression profile of tight junction protein claudin 3 and claudin 4 in ovarian serous adenocarcinoma with prognostic correlation. Histol His-topathol 2007, 22:1185-95.
3. Bignotti E, Tassi RA, Calza S, Ravaggi A, Romani C, Rossi E, Falchetti M, Odicino FE, Pecorelli S, Santin AD: Differential gene expres-sion profiles between tumor biopsies and short-term pri-mary cultures of ovarian serous carcinomas: Identification of novel molecular biomarkers for early diagnosis and therapy.
Gynecol Oncol 2006, 103:405-416.
4. Peters DG, Kudla DM, Deloia JA, Chu TJ, Fairfull L, Edwards RP, Fer-rell RE: Comparative gene expression analysis of ovarian car-cinoma and normal ovarian epithelium by serial analysis of gene expression. Cancer Epidemiol Biomarkers Prev 2005,
14:1717-1723.
5. Hough CD, Sherman-Baust CA, Pizer ES, Montz FJ, Im DD, Rosen-shein NB, Cho KR, Riggins GJ, Morin PJ: Large-scale serial analysis of gene expression reveals genes differentially expressed in ovarian cancer. Cancer Res 2000, 60:6281-7.
6. Krafft AE, Duncan BW, Bijwaard KE, Taubenberger JK, Lichy JH:
Optimization of the isolation and amplification of RNA from formalin-fixed, paraffin-embedded tissue: The Armed Forces Institute of Pathology Experience and Literature Review. Mol Diagn 1997, 2:217-230.
7. Masuda N, Ohnishi T, Kawamoto S, Monden M, Okubo K: Analysis of chemical modification of RNA from formalin-fixed sam-ples and optimization of molecular biology application for such samples. Nucleic Acids Res 1999, 27:4436-4443.
8. Stanta G, Mucelli SP, Petrera F, Bonin S, Bussolati G: A novel fixa-tive improves opportunities of nucleic acids and proteomic analysis in human archive's tissues. Diagn Mol Pathol 2006,
15:115-123.
9. Specht K, Richter T, Müller U, Walch A, Werner M, Höfler H: Quan-titative gene expression analysis in microdissected archival formalin-fixed and paraffin-embedded tumor tissue. Am J Pathol 2001, 158:419-429.
10. Cronin M, Pho M, Dutta D, Stephans JC, Shak S, Kiefer MC, Esteban JM, Baker JB: Measurement of gene expression in archival par-affin-embedded tissues: development and performance of a 92-gene reverse transcriptase-polymerase chain reaction assay. Am J Pathol 2004, 164:35-42.
11. Gloghini A, Canal B, Klein U, Dal Maso L, Perin T, Dalla-Favera R, Carbone A: RT-PCR analysis of RNA extracted from Bouin-fixed and paraffin-embedded lymphoid tissues. J Mol Diagn 2004, 6:290-296.
12. Pagedar NA, Wang W, Chen DH, Davis RR, Lopez I, Wright CG, Ala-gramam KN: Gene expression analysis of distinct populations of cells isolated from mouse and human inner ear FFPE tis-sue using laser capture microdissection – a technical report based on preliminary findings. Brain Res 2006, 1091:289-299. 13. Hamatani K, Eguchi H, Takahashi K, Koyama K, Mukai M, Ito R, Taga
M, Yasui W, Nakachi K: Improved RT-PCR amplification for molecular analyses with long-term preserved formalin-fixed, paraffin-embedded tissue specimens. J Histochem Cytochem 2006, 54:773-780.
14. Scicchitano MS, Dalmas DA, Bertiaux MA, Anderson SM, Turner LR, Thomas RA, Mirable R, Boyce RW: Preliminary comparison of quantity, quality, and microarray performance of RNA extracted from formalin-fixed, paraffin-embedded, and unfixed frozen tissue samples. J Histochem Cytochem 2006,
54:1229-1237.
15. Coudry RA, Meireles SI, Stoyanova R, Cooper HS, Carpino A, Wang X, Engstrom PF, Clapper ML: Successful application of microar-ray technology to microdissected formalin-fixed, paraffin-embedded tissue. J Mol Diagn 2007, 9:70-79.
16. Karsten SL, Van Deerlin VMD, Sabatti C, Gill LH, Geschwind DH: An evaluation of tyramide signal amplification and archived fixed and frozen tissue in microarray gene expression analy-sis. Nucleic Acids Res 2002, 30:e4.
17. Frank M, Döring C, Metzler D, Eckerle S, Hansmann ML: Global gene expression profiling of formalin-fixed paraffin-embed-ded tumor samples: a comparison to snap-frozen material using oligonucleotide microarrays. Virchows Arch 2007,
450:699-711.
18. Linton KM, Hey Y, Saunders E, Jeziorska M, Denton J, Wilson CL, Swindell R, Dibben S, Miller CJ, Pepper SD, Radford JA, Freemont AJ:
Acquisition of biologically relevant gene expression data by Affymetrix microarray analysis of archival formalin-fixed paraffin-embedded tumours. Br J Cancer 2008, 98:1403-1414. 19. Penland SK, Keku TO, Torrice C, He X, Krishnamurthy J, Hoadley
KA, Woosley JT, Thomas NE, Perou CM, Sandler RS, Sharpless NE:
RNA expression analysis of formalin-fixed paraffin-embed-ded tumors. Lab Invest 2007, 87:383-391.
20. Lassmann S, Kreutz C, Schoepflin A, Hopt U, Timmer J, Werner M:
micro-Publish with BioMed Central and every scientist can read your work free of charge "BioMed Central will be the most significant development for disseminating the results of biomedical researc h in our lifetime."
Sir Paul Nurse, Cancer Research UK
Your research papers will be:
available free of charge to the entire biomedical community
peer reviewed and published immediately upon acceptance
cited in PubMed and archived on PubMed Central
yours — you keep the copyright
Submit your manuscript here:
http://www.biomedcentral.com/info/publishing_adv.asp
BioMedcentral
dissected tumor cells from formalin-fixed and paraffin-embedded colorectal cancer resection specimens. J Mol Med 2009, 87:211-24.
21. Chung CH, Parker JS, Ely K, Carter J, Yi Y, Murphy BA, Ang KK, El-Naggar AK, Zanation AM, Cmelak AJ, Levy S, Slebos RJ, Yarbrough WG: Gene expression profiles identify epithelial-to-mesen-chymal transition and activation of nuclear factor-(kappa)B signaling as characteristics of a high-risk head and neck squa-mous cell carcinoma. Cancer Res 2006, 66:8210-8218.
22. Onken MD, Worley LA, Ehlers JP, Harbour JW: Gene expression profiling in unveal melanoma reveals two molecular classes and predicts metastatic death. Cancer Res 2004, 64:7205-7209. 23. Haque T, Faury D, Albrecht S, Lopez-Aquilar E, Hauser P, Garami M,
Hanzély Z, Bognár L, Del Maestro RF, Atkinson J, Nantel A, Jabado N:
Gene expression profiling from formalin-fixed paraffin-embedded tumors of pediatric glioblastoma. Clin Cancer Res 2007, 13:6284-6292.
24. Rogerson L, Darby S, Jabbar T, Mathers ME, Leung HY, Robson CN, Sahadevan K, O'Toole K, Gnanapragasam VJ: Application of tran-script profiling in formalin-fixed paraffin-embedded diagnos-tic prostate cancer needle biopsies. BJU Int 2008, 102:364-370. 25. Cheadle C, Vawter MP, Freed WJ, Becker KG: Analysis of micro-array data using Z score transformation. J Mol Diagn 2003,
5:73-81.
26. Baldi P, Long AD: A Bayesian framework for the analysis of microarray expression data: regularized t-test and statistical inferences of gene changes. Bioinformatics 2001, 17:509-519. 27. Borlado LR, Mendez J: CDC6: from DNA replication to cell
cycle checkpoints and oncogenesis. Carcinogenesis 2008,
29:237-243.
28. Liontos M, Koutsami M, Sideridou M, Evangelou K, Kletsas D, Levy B, Kotsinas A, Nahum O, Zoumpourlis V, Kouloukoussa M, Lygerou Z, Taraviras S, Kittas C, Bartkova J, Papavassiliou AG, Bartek J, Hala-zonetis TD, Gorgoulis VG: Deregulated overexpression of hCdt1 and hCdc6 promotes malignant behaviour. Cancer Res 2007, 67:10899-10909.
29. Sansam CL, Shepard JL, Lai K, Ianari A, Danielian PS, Amsterdam A, Hopkins N, Lees JA: DTL/CDT2 is essential for both CDT1 reg-ulation and the early G2/M checkpoint. Genes Dev 2006,
20:3117-3129.
30. Giordano TJ, Shedden KA, Schwartz DR, Kuick R, Taylor JM, Lee N, Misek DE, Greenson JK, Kardia SL, Beer DG, Rennert G, Cho KR, Gruber SB, Fearon ER, Hanash S: Organ-specific molecular clas-sification of primary lung, colon, and ovarian adenocarcino-mas using gene expression profiles. Am J Pathol 2001,
159:1231-1238.
31. Gilmour LM, Macleod KG, McCaig A, Gullick WJ, Smyth JF, Langdon SP: Expression of erbB-4/HER-4 growth factor receptor iso-forms in ovarian cancer. Cancer Res 2001, 61:2169-2176. 32. Nonaka D, Chiriboga L, Soslow RA: Expression of Pax8 as a
use-ful marker in distinguishing ovarian carcinomas from mam-mary carcinomas. Am J Surg Pathol 2008, 32:1566-1571. 33. Gruber AD, Moennig V, Hewicker-Trautwein M, Trautwein G: Effect
of formalin fixation and long-term storage on the detectabil-ity of bovine viral-diarrhoea-virus (BVDV) RNA in archival brain tissue using polymerase chain reaction. Zentralbl Veteri-narmed B 1994, 41:654-661.
34. Macabeo-Ong M, Ginzinger DG, Dekker N, McMillan A, Regezi JA, Wong DT, Jordan RC: Effect of duration of fixation on quanti-tative reverse transcription polymerase chain reaction anal-yses. Mod Pathol 2002, 15:979-987.
35. The NuGEN website [http://www.nugeninc.com/tasks/sites/ nugen/assets/File/technical_documents/
techdoc_wt_ov_ffpe_rep_01.pdf]
36. Crijns AP, Fehrmann RS, de Jong S, Gerbens F, Meersma GJ, Klip HG, Hollema H, Hofstra RM, Meerman GJ, de Vries EG, Zee AG van der:
Survival-related profile, pathways, and transcription factors in ovarian cancer. PLoS Med 2009, 6:e24.
37. Dressman HK, Berchuck A, Chan G, Zhai J, Bild A, Sayer R, Cragun J, Clarke J, Whitaker RS, Li L, Gray J, Marks J, Ginsburg GS, Potti A, West M, Nevins JR, Lancaster JM: An integrated genomic-based approach to individualized treatment of patients with advanced-stage ovarian cancer. J Clin Oncol 2007, 25:517-525. 38. Van Deerlin VM, Gill LH, Nelson PT: Optimizing gene expression
analysis in archival brain tissue. Neurochem Res 2002,
27:993-1003.
39. Srivastava PK, Küffer S, Brors B, Shahi P, Li L, Kenzelmann M, Gretz N, Gröne HJ: A cut-off based approach for gene expression analysis of formalin-fixed and paraffin-embedded tissue sam-ples. Genomics 2008, 91:522-529.
Pre-publication history
The pre-publication history for this paper can be accessed here: