R E S E A R C H A R T I C L E
Open Access
CDCOCA: A statistical method to define
complexity dependence of co-occuring
chromosomal aberrations
Nitin Kumar
1, Hubert Rehrauer
2, Haoyang Cai
1, Michael Baudis
1*Abstract
Background:Copy number alterations (CNA) play a key role in cancer development and progression. Since more than one CNA can be detected in most tumors, frequently co-occurring genetic CNA may point to cooperating cancer related genes. Existing methods for co-occurrence evaluation so far have not considered the overall heterogeneity of CNA per tumor, resulting in a preferential detection of frequent changes with limited specificity for each association due to the high genetic instability of many samples.
Method:We hypothesize that in cancer some linkage-independent CNA may display a non-random co-occurrence, and that these CNA could be of pathogenetic relevance for the respective cancer. We also hypothesize that the statistical relevance of co-occurring CNA may depend on the sample specific CNA complexity. We verify our hypotheses with a simulation based algorithm CDCOCA (complexity dependence of co-occurring chromosomal aberrations).
Results:Application of CDCOCA to example data sets identified co-occurring CNA from low complex background which otherwise went unnoticed. Identification of cancer associated genes in these co-occurring changes can provide insights of cooperative genes involved in oncogenesis.
Conclusions:We have developed a method to detect associations of regional copy number abnormalities in cancer data. Along with finding statistically relevant CNA co-occurrences, our algorithm points towards a generally low specificity for co-occurrence of regional imbalances in CNA rich samples, which may have negative impact on pathway modeling approaches relying on frequent CNA events.
Background
Genetic alterations are an absolute requirement for malignant neoplasias in humans [1,2]. Both kind of genetic alterations and order of occurrence are impor-tant for cancer development and progression [3]. Addi-tionally to sequential event models, large scale analysis of genomes from patient’s tumors have shown that mul-tiple genetic abnormalities can promote the develop-ment of one cancer entity [4]. Alterations in cancer genome can range from subtle sequence changes (e.g. point mutations) over structural alterations with func-tional impact on the coding sequence (e.g. generation of fusion genes by chromosomal translocations) to regional
or whole-chromosome copy number abnormalities (see e.g. [5-7]).
Through a gene dosage effect, genomic copy number alterations (CNA) may lead to insufficient expression of tumor suppressors or overexpression of proto-oncogenes, respectively. Recurrent CNA have been identified in nearly all cancer entities [8-10]). Comparative Genomic Hybridization (CGH) [11,12] is a genome wide CNA screening technology which has been widely applied throughout the last two decades. Building on the reverse in situ hybridization principle developed for chromoso-mal CGH [13], genomic microarray technology (aCGH; [14,15]) now utilizes intensity values from up to millions of short DNA sequences to derive regional copy number estimates.
Large data sets from copy number screening experiments should provide a powerful resource for oncogenomic data * Correspondence: [email protected]
1
Institute of Molecular Life Sciences, University of Zurich, Winterthurerstrasse 190, Zurich, Switzerland
Full list of author information is available at the end of the article
mining studies. In contrast to expression data, copy num-ber data arises from the projection of discrete values into the experimental space. As such, a reduction of the (a) CGH data can result in the minimal information of seg-mental status (gain/loss/normal) and genomic position. This facilitates efforts to integrate data across large num-bers of experimental series and derived from diverse tumor entities. So far, most of these efforts have been of descrip-tive nature [10,16] or have been aimed at the definition of disease-specific genomic patterns and useful pattern descriptors ("markers”, e.g. [17]). Other publications have attempted the reconstruction of relation and temporal order of oncogenetic events [18-20].
For some cancers types such as subsets of colorectal adenocarcinoma, presence of a limited number of genetic events including several CNA is critical for can-cer development [21]. Other neoplasias such as chronic lymphocytic leukemia (CLL) display a paucity of CNA, which however may be correlated to patient survival [22]. These examples illustrate that the presence of cer-tain CNA is not a chance phenomenon, but may either be necessary for cancer development or give a selective edge to affected clones. Previous publications have tried to address the cooperative nature of co-occurring CNA [23,24]. So far, these approaches have not considered the high variability in the complexity of CNAs among individual malignant tumors. Here, we develop an algo-rithm CDCOCA for analysis of co-occurring oncoge-nomic CNA events which considers the geoncoge-nomic complexity of the individual samples. We use our approach for detection of CNA events in real-world example data sets. Furthermore, we compare the results from CDCOCA to a previously published method [23] (which we call “analysis 3” in this paper) and also to a modified version of CDCOCA which does not include the adjustment for genomic complexity.
Methods Data
Annotated copy number and associated data was selected from our Progenetix (a)CGH database ([25]: http://www.progenetix.net; status as of 2010-03-01). For model development and testing, we choose one hemato-poietic (MCL) and one solid tumor entity (BLCA) due to their overall intermediate genomic complexity, with-out consideration of their previously established geno-mic imbalance profiles or CNA subset analysis.
For analysis, copy number status data was determined for 320 genomic intervals based on corresponding cyto-genetic bands. Sex chromosomes were removed due to possible bias in some of the published series (e.g. use as normalization control in (a)CGH experiments), resulting in 303 genomic intervals. For analysis by CDCOCA/ CICOCA, gain and loss status of all genomic intervals
were considered separately, leading to a data matrix with 606 categories. Only genomic intervals showing change in at least one sample were considered for analy-sis resulting in a CDCOCA/CICOCA input matrix with 593 categories for BLCA and 571 for MCL. For analysis 3, the original data matrix containing 303 genomic intervals was used. As a surrogate score for genomic complexity, a case specific score was calculated by add-ing each type of genomic imbalances (gain and/or loss) occurring on a chromosomal arm [26].
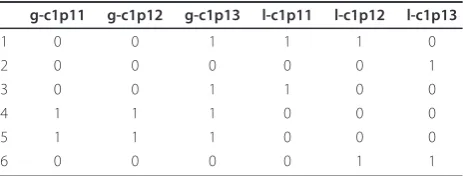
From now onwards we will use the term “genomic interval” for genomic interval status. A gain and loss association on same chromosome (e.g. -1p and + 1q) will be referred as“bidirectional” change. The modified structure of the data matrices is exemplified in Table 1. Any gain/loss status of a genomic interval is represented by the value 1.
Model
LetDbe the data matrix of dimension nxm, where n is the number of samples and m is the number of genomic intervals. Di,j= 1, if a CNA is present in genomic inter-val j in sample i elseDi,j= 0.Fjrepresents the number of sample having CNA at genomic intervalj, Fjis given
by Dij
i n
=
∑
1 . Pw Pw Pwn
=( 1... ) represents the vector of probability weights given to samples. The prior probabil-ity weight for any sample r isdefined by the number of CNAs in patient rover total number of CNA across all samples P D D wr rj j m t j j m i n = = = =
∑
∑
∑
0 1 0 ,Simulation of any genomic interval j is achieved by redistribution of the CNA status over all samples. For genomic intervalj, we define D*i=(D*...D*jn)
11 as the
cor-responding vector representing the CNA status of simu-lated data. D*j is obtained in a way so that F F
j j
*≈ .
Overlay between two genomic intervals is computed using Jaccard’s index [27]. Jaccard’s index gives a value
Table 1 Binary matrix derived from CGH data
g-c1p11 g-c1p12 g-c1p13 l-c1p11 l-c1p12 l-c1p13
1 0 0 1 1 1 0
2 0 0 0 0 0 1
3 0 0 1 1 0 0
4 1 1 1 0 0 0
5 1 1 1 0 0 0
6 0 0 0 0 1 1
between 0 and 1, where one represents a perfect overlap and zero, no overlap. The Jaccard’s index between any two genomic intervals j and k is computed as
J N
N N N
jk jk
jk jk jk
=
+ +
11 10 01 11
N11jk number of samples with CNA in genomic inter-vals status, j and k.
N10jk number of samples with CNA in genomic inter-val status j but not k.
Njk01 number of samples with CNA in genomic inter-val status k but not j.
The overlap obtained on permutation is represented
by J∗jk Frequency of a co-occurrence is computed as
F N
n
jk jk
= 11
Fjkfrequency of an overlap between genomic intervals
status i and j.
N11jk number of samples having change in both geno-mic interval status i and j. ntotal number of samples in the data.
CDCOCA Algorithm
Let S be the number of simulations and C is the counter measuring the number of times the expected (i.e. per-muted) overlap is greater than or equal to the observed overlap. We set the counter of C = 0.
1. Initialize C = 0.
2. Calculate Jaccard’s overlap Jjk between genomic
intervaljandk.
3. For genomic interval jsimulate the data to obtain
D*j as
a. Obtain a sample index rof size 1, from N = (1,....,n) using Pwi such that sample with maxi-mum weight given has a higher probability of
get-ting a change on permutation, update D*jr = 1. b. Update N = N[-r].
c. Update P P P P
P P
P P
wi wi wi w
i
wi i
wi w
i
wi
= − = =
=
∑
[ r], ,
1 .
d. Repeat step 3a and 3bFjtimes to obtain simu-lated vector D*j.
4. For genomic interval ksimulate the data using step 3 to obtain D*k.
5. Recompute Jaccard’s overlap J*jk, if J*jk≥ jjk
increaseC=C+ 1.
6. Repeat step 3, 4 and 5 for S times.
7. At the end of S (5000 in our case) permutations
calculatepvalue as, p C S
= .
The p-value obtained after step 7 represent the prob-ability of co-occurrence of two CNAs in absence of any other CNA in sample. A lowp-value cut off will help in enriching for CNAs which occur together even in less heterogenous samples.
Results and Discussion
We here propose a methodology named CDCOCA (Complexity dependence of co-occurring chromosomal aberrations) that defines highly correlated pairs of CNA in cancer samples while correcting for the overall degree of genomic instability.
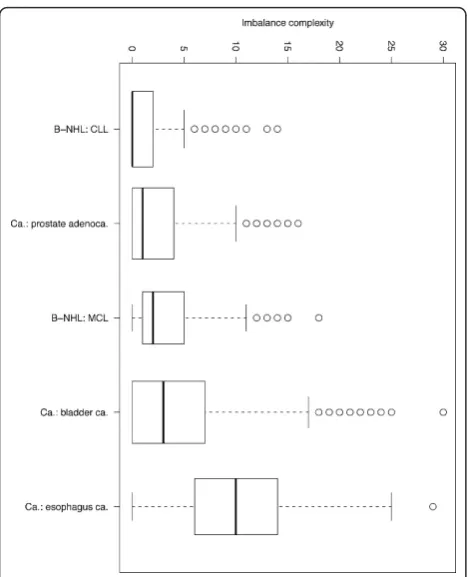
We determine CNA complexity based on the number of segmental CNA in a sample while accounting for variations introduced through different resolutions and/or segmenta-tion algorithms [10]. A sample is called“CNA complex”if it has acquired a high number of CNA, and conversely “CNA simple”if a low number of segmental imbalances have been detected. In Figure 1 the distribution of copy number complexities is presented for data from selected tumor entities, extracted from the Progenetix database.
The performance of CDCOCA depends on the number of tumor samples, number of genomic intervals and num-ber of iterations. CDCOCA produces a matrix of p values for all possible associations in the data matrix which are then used to enrich for associations dependent on sample complexity. The algorithm is implemented in the R statis-tical framework and is available through R package “CDCOCA”provided on the Progenetix website [25].
from genetic changes which occur in CNA complex samples (hence high p values). Associations presenting with high Jaccard’s indices and low p-values represent CNA with high probability of specific co-occurrence (i.e. frequent co-occurrence independent of high sam-ple CNA comsam-plexity).
Our results show that most of the CNA data for both cancers are derived on a background of multiple and extended CNA. The total number of genetic associations in both cancer types remains beyond scope of the
Figure 1Complexity boxplot of CNA in some selected cancers. Box plot for the overall CNA complexity in selected cancer entities. As a surrogate marker for genomic complexity, each cytogenetic arm was scored independently for gains and losses (i.e., max. score of 4 for a chromosome with both gains and losses on both arms), and chromosome scores were summarized for each case.
Figure 2Log of p value plotted against log of Jaccard’s index for BLCA. For simplicity reasons all the associations involving only 4 chromosomal changes are shown here. Each color dot reprent an association of that particular chromosome with some other chromosomal band. Most of the associations have a low Jaccard’s index and very high p values (upper left side of plot) these associations represent CNA in CNA complex samples. Few associations have a high Jaccard’s index and low p values (lower right side of plot); these associations are present in“CNA simple” samples.
Figure 3Log of p value plotted against log of Jaccard’s index for MCL. Most of the associations have a very high CNA complex background (upper right side of plot) whereas a associations with high Jaccard’s index and low p value (lower right side) are also present for all chromosomes.
current analysis. However, with CDCOCA we are able to focus on a defined set of statistically relevant, specific changes.
For estimating the performance of our methodology in relation to otherwise discussed models we compared CDCOCA to a modified version“CICOCA”(see supple-ment) and a previously published method [23]. Both the later algorithms do not include an estimate of sample complexity and primarily identify associations with a high frequency. CICOCA and analysis 3 use different methods to compute overlap resulting in slightly differ-ent but overall concordant results.
With CICOCA, a high number of co-occurring changes were obtained after p value cut off (Figure 1 and 2 in additional file 1). In contrast, introduction of complexity estimation leads to a focus on changes aris-ing on a low complexity background (Figure 4 and 5). With analysis 3 (Figure 3 and 4 in additional file 1) a very low number of associations was obtained in our sample data set. As expected these only involved high frequent changes. We could show that most of the CNA
obtained by analysis 3 (Figure 3 and 4 in additional file 1) were also detected using CDCOCA (Figure 4 and 5) and CICOCA (Figure 1 and 2 in additional file 1). CICOCA and analysis 3 can be used to describe fre-quent associations, while CDCOCA additionally allows to test the specificity of associations and to apply thresholds accordingly. Compared to frequency based thresholding, one advantage of CDCOCA is its indepen-dence from arbitrary cut-off values. The algorithm scores every association. The p value obtained assigns a statistical significance to the associations which is inde-pendent of the frequency of the association in the data but takes the complexity of the sample into account.
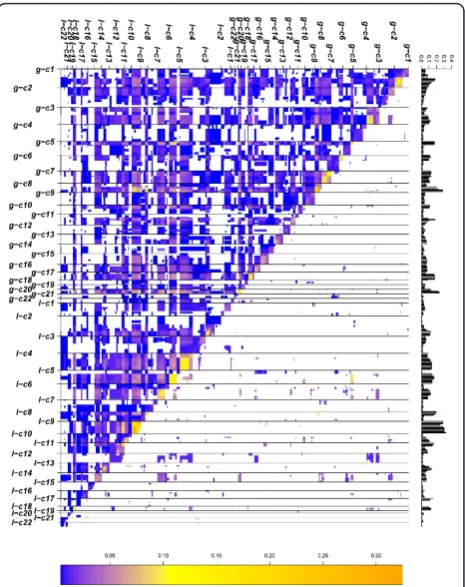
Figure 5Matrix plot showing results obtained for MCL with CDCOCA. The diagonal lower half of the image represents all the possible associations in BLCA data where as diagonal upper half represents associations obtained after p value cut off. Frequency of genomic intervals is represented by histogram at the top. Color code represents the value of Jaccard’s overlap between associations. The high correlation throughout the diagonal confirms shows the strong connection between CNA co-occurrence and close genetic linkage.
Table 2 Statistic of associations in BLCA
Analysis method
Total associations
No. intra-chromosomal associations
p-value FDR Associations obtained
No. intera-chromosomal associations
1 CDCOCA 96436 4786 0.02 0.275 6991 3619
2 CICOCA 96436 4786 0.02 0.096 20089 3891
2 Analysis 3 40284 2577 0.02 0.7211 321 152
Figure 6Matrix plot showing frequency of associations in BLCA. Associations are shown similar to figure 4 but here
Bladder carcinoma
An overview of the most frequent genomic imbalances in urinary BLCA can be found in e.g. [10]. Most fre-quent gains in BLCA include regions on 1q, 5p, 8q,17, 19 and 21q, while the most frequent losses occur on 2q, 4, 5q, 6q, 8p, 9, and 13q (Figure 1 and 3 in additional file 1 and Figure 4 barplot). Due to the high degree of aneuploidy in BLCA, CNA data is highly complex (Figure 4 matrix plot) resulting in a very high number of total associations (Table 2).
A large proportion of associations combine a low fre-quency with a high Jaccard’s index (Figure 4 and 6 matrix plots). We applied a p-value cut off of 0.02 resulting in a false discovery rate (FDR) of 27.5%. At this p-value cut off, 75% of intra-chromosomal associations passed the threshold, confirming the correlation between genetic linkage and involvement in CNA events. Table 2 contains the information about the comparison of results for all three analysis. For simplicity reasons here we limit the display to the 100 most frequent inter-chromosomal changes obtained after p-value cut off.
According to CDCOCA, specific pairs of genomic imbalances in bladder carcinoma include concurrent
“bidirectional” losses on 8p and gains on 8q (Figure 7). In the comparative analysis, gains involving chromo-some 8q were detected with all three methods (Figure 5 and 6 in additional file 1 and Figure 7). However, with CDCOCA the frequent co-occurrence of these CNA on the background of a low genomic complexity became more apparent. This observation may point to an early appearance of these CNA during tumorigen-esis, with a possible role as cancer initiating event. While gains on distal 8q are the most consistent copy number change in epithelial neoplasias with MYC con-sidered a predominant target, recently deletions on 8p23.3 have been associated with aggressive clinical behavior in BLCA [28]. Another observation concerned changes involving concurrent gains on 5p and losses on 5q which were also associated with losses on chro-mosome 4q and distal 6q (6q22). These co-occurrences (Figure 5 and 6 in additional file 1 and Figure 7). Although one may assume that“bidirectional” changes involving both chromosomal arms are based on simple cytogenetic events, e.g. isochromosome formation, the limitation of this pattern to distinct chromosomes points at an evolutionary advantage of both gain and
loss accumulation for the malignant clone. Other event pairs obtained by CDCCOA include gains on 8q23 along with gains on 3q, as well as gain on 20q11 with loss on 18q23.
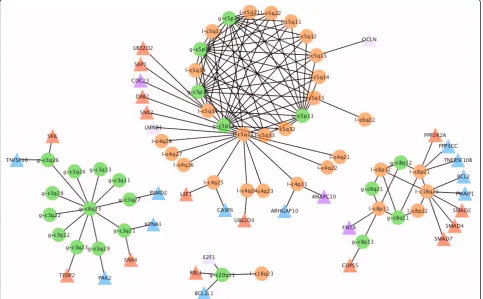
The abundance of 8p losses, 8q gains, 5q losses, 5p gains, 3q gains, 4q losses points towards the importance of these CNA in tumors carrying them. Genes from TGF-beta receptor signaling (blue triangles) and cellular apoptotic pathways (red triangles) located to the co-occurring changes are shown in Figure 7. The presence of genes from the same pathways on co-occurring CNA point towards a possible cooperative action of these genes. CDC23 (5q31), CASP6 (4q25) and PMAIP1 (18q21) are among TGF-receptor cascade genes with well established role in cancer [29,30] Other possible targets for genetic cooperation include PMSD2, PAK2, BCL2L1 and FNTA. Genes from apoptotic signaling pathways mapped to these regions include CDC23 (5q31), SMAD2 (18q21), SMAD4 (18q21) and SMAD7 (18q21) which have been shown defective in several can-cer entities [31]. As possible target on 5p, loss of SKP2 had been shown to cause cell senescence [32]. On 5q, loss of function mutations including copy number losses of both APC and MCC have been associated with a vari-ety of epithelial neoplasias [33-36].
Mantle cell lymphoma
For MCL, an overall p value distribution similar to that of BLCA was observed (Figure 3). Most common CNA in MCL included gains on chromosomes 3q, 6p, 7p and 8q, while most common losses involved regions on 6q, 8p, 9, 11q and 13q (Figure 7 and 8 in additional file 1 and Figure 5).
A p value cut-off of 0.04 giving a FDR of 30% was applied with CDCOCA (Table 3 and Figure 8). About 80% of intra-chromosomal associations passed this threshold, representing approx. 50% of all post cut-off associations. The 100 strongest associations obtained with CDCOCA are shown in Figure 9. As in BLCA, CDCOCA detected losses on 8p with gains on 8q, which was not described as association in the other analyses. Also, only CDCOCA selected groups of co-occurrences involving low frequency CNA (e.g. associations involving gains 7p, 6p, 12p and 18q). Other changes such as losses on highly occurring 13q along with gains on not so fre-quently occurring 7q were obtained using CDCOCA and
not with CICOCA and analysis 3 in the top 100 events (Figure 7 and 8 in additional file 1).
As candidate targets, TNF-signaling genes (red trian-gles) and T-cell receptor signaling genes (blue triantrian-gles) are marked on their corresponding band locations in Figure 9. The role of genes such as MDM2 (12p15), TNFRSF1A (12p13), MALT1 (18q21) for neoplastic transformation and/or progression has already been well established [37-39]. Other examples for cancer relevant genes mapping to those regions are STAT2 (12q13), and STAT3 (17q) [40,41].
Conclusions
We have developed a method CDCOCA to define com-plexity dependence of co-occurring CNA in cancer
Figure 8Matrix plot showing frequency of associations in MCL. Associations are shown similar to figure 7 but here displaying frequencies of associations in place of Jaccard’s overlap values. Most frequent CNA associations involve genetically linked CNA.
Associations involving high frequent changes are lost after p value cut off indicating their occurrence in a CNA complex background.
Table 3 Statistic of associations in MCL
Analysis method
Total associations
No. intra-chromosomal associations
p-value FDR Associations obtained
No. intera-chromosomal associations
1 CDCOCA 57644 3918 0.04 0.30 7513 3175
2 CICOCA 57644 3918 0.04 0.197 11673 3918
samples. In contrast to methods published previously [23] and a modified algorithm which does not include the complexity adjustment step, CDCOCA does not simply focus on the most frequent co-occurrences of regional genomic copy number changes in cancer enti-ties. Here, we determine statistically relevant
co-occur-ring CNA through accounting for the CNA
“background noise”, introduced e.g. through chromo-some scale imbalances (e.g. isochromochromo-somes, chromoso-mal aneuploidy). In theory, this procedure should highlight specific but comparatively rare CNA events.
As indicated by our analysis of BLCA and MCL, two unrelated cancer entities with overall intermediate copy number complexity, the relevant CNA associations in many specimen are obscured due to the large number and/or extension of regional CNA. When correcting for genomic background heterogeneity most of the associa-tions involving highly recurring CNA were removed. This indicates that many high frequency changes may be related to the overall genomic instability and there-fore cannot unanimously be assigned a causative role in oncogenesis. Especially regarding the large number of
genes affected by complex genomic imbalances, some of the cancer type specific CNA patterns may represent an epiphenomenon of disturbed genomic maintenance pro-cesses rather than the expression of copy number dependent target gene modifications.
However, when accounting for the overall complexity, CNA associations may point towards connected events and/or preferred pathways activated during carcinogenesis. Based on our CNA associations, we found multiple genes from single well defined cancer pathways to be a effected in sample subsets. Alteration of more than one gene in a pathway may potentiate the effect on pathway function and be responsible for a specific clonal phenotype.
CDCOCA should prove to be a powerful tool for defining mutual associations at gene level and to gain insights into cellular mechanisms relevant for oncogen-esis. Although we applied our method to CGH data at band resolution, there is no practical obstacle against use with segmented data from high resolution genomic array experiments. In fact, this should facilitate a gene centric analysis and automatic integration with func-tional data sources.
Additional material
Additional file 1: CICOCA: A method to define complexity independence of co-occurring chromosomal aberrations. The additional file contains information about the statistical method CICOCA which is compared with CDCOCA. This method (as described in text above) aims in finding co-occurring chromosomal associations independent of the sample complexity. In addition to CICOCA this file also contains all the additional figures which are referred in the paper along with a detail description of all the additional figures.
Acknowledgements
NK is supported through a grant by the Krebsliga Schweiz (Swiss Cancer League). Haoyang Cai is supported through a grant from the China Scholarship Council.
Author details
1Institute of Molecular Life Sciences, University of Zurich, Winterthurerstrasse
190, Zurich, Switzerland.2Functional Genomics Center Zurich, University of Zurich, Winterthurerstrasse 190, Zurich, Switzerland.
Authors’contributions
NK, MB, HR designed and conceived the experiments; NK implemented the software; NK, MB analyzed the data, HC, MB contributed to the data. All authors read and approved the final manuscript.
Competing interests
The authors declare that they have no competing interests.
Received: 26 July 2010 Accepted: 3 March 2011 Published: 3 March 2011
References
1. Futreal P, Coin L, Marshall M, Down T, Hubbard T, Wooster R, Rahman N, Stratton M:A census of human cancer genes.Nat Rev Cancer2004,
4(3):177-83.
2. Stratton M, Campbell P, Futreal P:The cancer genome.Nature2009,
458(7239):719-24.
3. Kinzler K, Vogelstein B:Lessons from hereditary colorectal cancer.Cell
1996,87(2):159-70.
4. Hanahan D, Weinberg R:The hallmarks of cancer.Cell2000,100:57-70. 5. Lengauer C, Kinzler K, Vogelstein B:Genetic instabilities in human cancers.
Nature1998,396(6712):643-9.
6. Stallings R:Origin and functional significance of large-scale chromosomal imbalances in neuroblastoma.Cytogenet Genome Res2007,118(2-4):110-5, [Copyright (c) 2007 S. Karger AG, Basel.].
7. Weir BA, Woo MS, Getz G, Perner S, Ding L, Beroukhim R, Lin WM, Province MA, Kraja A, Johnson LA, Shah K, Sato M, Thomas RK, Barletta JA, Borecki IB, Broderick S, Chang AC, Chiang DY, Chirieac LR, Cho J, Fujii Y, Gazdar AF, Giordano T, Greulich H, Hanna M, Johnson BE, Kris MG, Lash A, Lin L, Lindeman N, Mardis ER, McPherson JD, Minna JD, Morgan MB, Nadel M, Orringer MB, Osborne JR, Ozenberger B, Ramos AH, Robinson J, Roth JA, Rusch V, Sasaki H, Shepherd F, Sougnez C, Spitz MR, Tsao MS, Twomey D, Verhaak RGW, Weinstock GM, Wheeler DA, Winckler W, Yoshizawa A, Yu S, Zakowski MF, Zhang Q, Beer DG, Wistuba II, Watson MA, Garraway LA, Ladanyi M, Travis WD, Pao W, Rubin MA, Gabriel SB, Gibbs RA, Varmus HE, Wilson RK, Lander ES, Meyerson M:Characterizing the cancer genome in lung adenocarcinoma.Nature2007,450(7171):893-8. 8. Myllykangas S, Himberg J, Bohling T, Nagy B, Hollmen J, Knuutila S:DNA
copy number amplification profiling of human neoplasms.Oncogene
2006,25(55):7324-32.
9. Coe B, Lockwood W, Girard L, Chari R, Macaulay C, Lam S, Gazdar A, Minna J, Lam W:Di erential disruption of cell cycle pathways in small cell and non-small cell lung cancer.Br J Cancer2006,94(12):1927-35. 10. Baudis M:Genomic imbalances in 5918 malignant epithelial tumors: an
explorative meta-analysis of chromosomal CGH data.BMC Cancer2007,
7:226.
11. Kallioniemi A, Kallioniemi O, Sudar D, Rutovitz D, Gray J, Waldman F, Pinkel D:Comparative genomic hybridization for molecular cytogenetic analysis of solid tumors.Science1992,258(5083):818-21.
12. du Manoir S, Speicher M, Joos S, Schrock E, Popp S, Dohner H, Kovacs G, Robert-Nicoud M, Lichter P, Cremer T:Detection of complete and partial chromosome gains and losses by comparative genomic in situ hybridization.Hum Genet1993,90(6):590-610.
13. Joos S, Scherthan H, Speicher M, Schlegel J, Cremer T, Lichter P:Detection of amplified DNA sequences by reverse chromosome painting using genomic tumor DNA as probe.Hum Genet1993,90(6):584-9. 14. Solinas-Toldo S, Lampel S, Stilgenbauer S, Nickolenko J, Benner A,
Dohner H, Cremer T, Lichter P:Matrix-based comparative genomic hybridization: biochips to screen for genomic imbalances.Genes Chromosomes Cancer1997,20(4):399-407.
15. Pinkel D, Albertson D:Comparative genomic hybridization.Annu Rev Genomics Hum Genet2005,6:331-54.
16. Beroukhim R, Mermel C, Porter D, Wei G, Raychaudhuri S, Donovan J, Barretina J, Boehm J, Dobson J, Urashima M, Henry KM, Pinchback R, Ligon A, Cho Y, Haery L, Greulich H, Reich M, Winckler W, Lawrence M, Weir B, Tanaka K, Chiang D, Bass A, Loo A, Hoffman C, Prensner J, Liefeld T, Gao Q, Yecies D, Signoretti S, Maher E, Kaye F, Sasaki H, Tepper J, Fletcher J, Tabernero J, Baselga J, Tsao M, Demichelis F, Rubin M, Janne P, Daly M, Nucera C, Levine R, Ebert B, Gabriel S, Rustgi A, Antonescu C, Ladanyi M, Letai A, Garraway L, Loda M, Beer D, True L, Okamoto A, Pomeroy S, Singer S, Golub T, Lander E, Getz G, Sellers W, Meyerson M:The landscape of somatic copy-number alteration across human cancers.Nature2010,
463(7283):899-905.
17. Liu J, Ranka S, Kahveci T:Markers improve clustering of CGH data.
Bioinformatics2007,23(4):450-7.
18. Hoglund M, Frigyesi A, Sall T, Gisselsson D, Mitelman F:Statistical behavior of complex cancer karyotypes.Genes Chromosomes Cancer2005,
42(4):327-41, [(c) 2005 Wiley-Liss, Inc.].
19. Desper R, Jiang F, Kallioniemi O, Moch H, Papadimitriou C, Schaffer A:
Distance-based reconstruction of tree models for oncogenesis.J Comput Biol2000,7(6):789-803.
20. Gerstung M, Baudis M, Moch H, Beerenwinkel N:Quantifying cancer progression with conjunctive Bayesian networks.Bioinformatics2009,
25(21):2809-15.
21. Vogelstein B, Fearon E, Hamilton S, Kern S, Preisinger A, Leppert M, Nakamura Y, White R, Smits A, Bos J:Genetic alterations during colorectal-tumor development.N Engl J Med1988,319(9):525-32.
22. Dohner H, Stilgenbauer S, Benner A, Leupolt E, Krober A, Bullinger L, Dohner K, Bentz M, Lichter P:Genomic aberrations and survival in chronic lymphocytic leukemia.N Engl J Med2000,343(26):1910-6.
23. Bredel M, Scholtens D, Harsh G, Bredel C, Chandler J, Renfrow J, Yadav A, Vogel H, Scheck A, Tibshirani R, Sikic B:A network model of a cooperative genetic landscape in brain tumors.JAMA2009,302(3):261-75.
24. Klijn C, Bot J, Adams D, Reinders M, Wessels L, Jonkers J:Identification of networks of co-occurring, tumor-related DNA copy number changes using a genome-wide scoring approach.PLoS Comput Biol2010,6: e1000631.
25. Baudis M, Cleary ML:Progenetix.net: an online repository for molecular cytogenetic aberration data.Bioinformatics2001,17(12):1228-9. 26. Boerma E, Siebert R, Kluin P, Baudis M:Translocations involving 8q24 in
Burkitt lymphoma and other malignant lymphomas: a historical review of cytogenetics in the light of todays knowledge.Leukemia2009,
23:225-234.
27. Tan PN, Steinbach M, Kumar V:Introduction to data miningBosotn, MA, USA: Addison Wesley; 2005.
28. Eguchi S, Yamamoto Y, Sakano S, Chochi Y, Nakao M, Kawauchi S, Furuya T, Oga A, Matsuyama H, Sasaki K:The loss of 8p23.3 is a novel marker for predicting progression and recurrence of bladder tumors without muscle invasion.Cancer Genet Cytogenet2010,200:16-22, [2010 Elsevier Inc. All rights reserved.].
29. Wang Q, Moyret-Lalle C, Couzon F, Surbiguet-Clippe C, Saurin J, Lorca T, Navarro C, Puisieux A:Alterations of anaphase-promoting complex genes in human colon cancer cells.Oncogene2003,22(10):1486-90.
30. Loro L, Johannessen A, Vintermyr O:Loss of BCL-2 in the progression of oral cancer is not attributable to mutations.J Clin Pathol2005,
31. Maliekal T, Antony M, Nair A, Paulmurugan R, Karunagaran D:Loss of expression, and mutations of Smad 2 and Smad 4 in human cervical cancer.Oncogene2003,22(31):4889-97.
32. Lin HK, Chen Z, Wang G, Nardella C, Lee SW, Chan CH, Yang WL, Wang J, Egia A, Nakayama KI, Cordon-Cardo C, Teruya-Feldstein J, Pandolfi PP:Skp2 targeting suppresses tumorigenesis by Arf-p53-independent cellular senescence.Nature2010,464(7287):374-9.
33. Groden J, Thliveris A, Samowitz W, Carlson M, Gelbert L, Albertsen H, Joslyn G, Stevens J, Spirio L, Robertson M, al et:Identification and characterization of the familial adenomatous polyposis coli gene.Cell
1991,66(3):589-600.
34. Kinzler K, Nilbert M, Vogelstein B, Bryan T, Levy D, Smith K, Preisinger A, Hamilton S, Hedge P, Markham A, al et:Identification of a gene located at chromosome 5q21 that is mutated in colorectal cancers.Science1991,
251(4999):1366-70.
35. Nishisho I, Nakamura Y, Miyoshi Y, Miki Y, Ando H, Horii A, Koyama K, Utsunomiya J, Baba S, Hedge P:Mutations of chromosome 5q21 genes in FAP and colorectal cancer patients.Science1991,253(5020):665-9. 36. Ashton-Rickardt P, Wyllie A, Bird C, Dunlop M, Steel C, Morris R, Piris J,
Romanowski P, Wood R, White R, al et:MCC, a candidate familial polyposis gene in 5q.21, shows frequent allele loss in colorectal and lung cancer.Oncogene1991,6(10):1881-6.
37. Trauzold A, Roder C, Sipos B, Karsten K, Arlt A, Jiang P, Martin-Subero J, Siegmund D, Muerkoster S, Pagerols-Raluy L, Siebert R, Wajant H, Kalthoff H:
CD95 and TRAF2 promote invasiveness of pancreatic cancer cells.FASEB J2005,19(6):620-2.
38. Sugano N, Suda T, Godai T, Tsuchida K, Shiozawa M, Sekiguchi H, Yoshihara M, Matsukuma S, Sakuma Y, Tsuchiya E, Kameda Y, Akaike M, Miyagi Y:MDM2 gene amplification in colorectal cancer is associated with disease progression at the primary site, but inversely correlated with distant metastasis.Genes Chromosomes Cancer2010,49(7):620-9, [(c) 2010 Wiley-Liss, Inc.].
39. Dierlamm J, Penas EM, Bentink S, Wessendorf S, Berger H, Hummel M, Klapper W, Lenze D, Rosenwald A, Haralambieva E, Ott G, Cogliatti S, Moller P, Schwaenen C, Stein H, Loffer M, Spang R, Trumper L, Siebert R:
Gain of chromosome region 18q21 including the MALT1 gene is associated with the activated B-cell-like gene expression subtype and increased BCL2 gene dosage and protein expression in diffuse large B-cell lymphoma.Haematologica2008,93(5):688-96.
40. Konnikova L, Simeone M, Kruger M, Kotecki M, Cochran B:Signal transducer and activator of transcription 3 (STAT3) regulates human telomerase reverse transcriptase (hTERT) expression in human cancer and primary cells.Cancer Res2005,65(15):6516-20.
41. He B, Reguart N, You L, Mazieres J, Xu Z, Lee A, Mikami I, McCormick F, Jablons D:Blockade of Wnt-1 signaling induces apoptosis in human colorectal cancer cells containing downstream mutations.Oncogene
2005,24(18):3054-8.
42. Shannon P, Markiel A, Ozier O, Baliga N, Wang J, Ramage D, Amin N, Schwikowski B, Ideker T:Cytoscape: a software environment for integrated models of biomolecular interaction networks.Genome Research2003,13:2498-2504.
Pre-publication history
The pre-publication history for this paper can be accessed here: http://www.biomedcentral.com/1755-8794/4/21/prepub
doi:10.1186/1755-8794-4-21
Cite this article as:Kumaret al.:CDCOCA: A statistical method to define complexity dependence of co-occuring chromosomal aberrations.BMC
Medical Genomics20114:21. Submit your next manuscript to BioMed Central and take full advantage of:
• Convenient online submission
• Thorough peer review
• No space constraints or color figure charges
• Immediate publication on acceptance
• Inclusion in PubMed, CAS, Scopus and Google Scholar
• Research which is freely available for redistribution