Open Access
Research
Heart energy signature spectrogram for cardiovascular diagnosis
Vladimir Kudriavtsev*
1, Vladimir Polyshchuk
2and Douglas L Roy
3Address: 1Biosignetics Corporation, Toronto, Canada, 2Biosignetics Corporation, 29 Downing Ct, Exeter, New Hampshire 03833, USA and 3Department of Cardiology, Izaak Walton Killam Children's Health Center, Dalhousie Medical School, Halifax, Nova Scotia, Canada
Email: Vladimir Kudriavtsev* - info@bsignetics.com; Vladimir Polyshchuk - info@bsignetics.com; Douglas L Roy - dlroy@dal.ca * Corresponding author
Abstract
A new method and application is proposed to characterize intensity and pitch of human heart sounds and murmurs. Using recorded heart sounds from the library of one of the authors, a visual map of heart sound energy was established. Both normal and abnormal heart sound recordings were studied. Representation is based on Wigner-Ville joint time-frequency transformations. The proposed methodology separates acoustic contributions of cardiac events simultaneously in pitch, time and energy. The resolution accuracy is superior to any other existing spectrogram method. The characteristic energy signature of the innocent heart murmur in a child with the S3 sound is presented. It allows clear detection of S1, S2 and S3 sounds, S2 split, systolic murmur, and intensity of these components. The original signal, heart sound power change with time, time-averaged frequency, energy density spectra and instantaneous variations of power and frequency/pitch with time, are presented. These data allow full quantitative characterization of heart sounds and murmurs. High accuracy in both time and pitch resolution is demonstrated. Resulting visual images have self-referencing quality, whereby individual features and their changes become immediately obvious.
1.0 Background
1.1 Cardiac auscultation
Cardiac auscultation is a difficult skill to acquire and today most medical students graduate without the ability to determine whether a heart sound or murmur is normal or abnormal [1,2]. Evidence also indicates that this skill is not acquired later in practice [3,4]. There is question that despite improved heart sound teaching methods [5] whether improvement in this clinical skill has occurred. This diagnostic deficit results in, (a) certain patients with an undiagnosed organic cardiac lesion will suffer ill health or possible death at a later date, or (b) in the case of the innocent murmur, present in at least 72% of normal chil-dren [6,7], expensive cardiac investigation must be carried out to reach this diagnosis. The availability of a new
quan-titative digitally based computer method, such as herein described, and which with high accuracy can determine and quantify key heart sound variations (i.e. frequency/ pitch, intensity, timing, energy, sound split and ejection click), will present a valuable asset to the delivery of health care.
The approach used is based on spectrograms representing a dynamic graphic image of heart sound intensity in time and frequency. At present, current methods of spectral dis-play are not generally understood or even employed in clinical medicine. We propose new method and format that will enable better characterization of heart sounds and hopefully will present a new foundation for subse-quent clinical implementation and testing.
Published: 4 May 2007
BioMedical Engineering OnLine 2007, 6:16 doi:10.1186/1475-925X-6-16
Received: 24 October 2006 Accepted: 4 May 2007 This article is available from: http://www.biomedical-engineering-online.com/content/6/1/16 © 2007 Kudriavtsev et al; licensee BioMed Central Ltd.
1.2 Phonocardiograms (PCG)
The PCG is a display of the heart sound signal showing that heart sounds and murmurs can provide useful infor-mation to the physician by complementing cardiac aus-cultation. Basic methodology of distinguishing cardiac murmurs from the PCG is the same as interpreting mur-murs from auscultation. However, it provides additional information about timing of cardiac phases and events as well as serving as a digital record that can be utilized to characterize dynamic changes associated with therapy and course of the disease. PCG complements auscultation.
The major PCG clinical drawback is that it does not present information on frequency (pitch) of heart sounds and their components, one of the major deciding factors for murmur clinical interpretation. It does not have the ability to differentiate separate multiple (folded) frequen-cies of various sounds and presents no information con-cerning dynamic changes of energy (power) stored in the sound. Other deficiencies arguably include signal tion effects (change of visual representation due to filtra-tion) and presence of artifacts and noises that can visually mask weak sounds. Challenges in pinpointing start and end points of certain sounds have been reported. End point positions will also depend on the applied filter, which add additional uncertainty. Manual segmentation (separation of heart sound components) may be another problem as well.
PCG never achieved acceptance as a routine clinical inves-tigative method [8], but did find a valuable place in clini-cal investigation and research. However current newly developed "system science" [9] and signal processing computational technologies in combination with a digital sound recording technologies, electronic recording steth-oscopes, advanced new vibration sensors [10] and finally extraordinary computing power now afforded to PDA's, tablet PCs, palm PCs, laptops and MP3 players/recorders make it now possible to completely revitalize old PCG-based approaches.
1.3 Heart sound spectrography
The concept of heart sound spectral display was first intro-duced by McKusick in 1955 [11] and in a subsequent series of his clinical publications [12-14]. (Victor A. McK-usick, M.D., Professor of Medical Genetics and Cardiolo-gist by training, The Johns Hopkins University School of Medicine and a physician-scientist widely acknowledged as the father of genetic medicine, is a recipient of the National Medal of Science, 2002.) This display provides added frequency (pitch) dimension to the PCG signal dis-play. While this work did not receive significant reception by clinicians, there is now a renewed interest in this approach both in clinical medicine and in biomedical engineering research. Using spectrograms obtained by
McKusick, Don Michael [15] illustrated the intrinsic prop-erties of various heart lesions in his monograph "Auscul-tation of the Heart". Similar works has been recently reported by Balster et al. [16], Nopponen and Lukkarinen [18,19]. Tovar-Corona et al. [20,21], Bhatikar et al. [22], Tuchinda and Thompson [26,27] utilized wavelet-based transform to obtain time varying scalogram maps. The spectrogram offers additional insight into time dependent change of murmur frequency. Donnerstein [17] correlated spectrogram frequency characteristics with Doppler echo velocity. Tavel & Katz [23,24] reported a method of clini-cal differentiation of aortic stenosis from innocent mur-mur using spectrogram measurements. Finally, Tavel [25] indicated great promise for this approach for clinical diag-nosis.
Unfortunately methods presented in [9-19,23-25] use var-ious forms of the Short Term Fast Fourier Transform (STFT) to obtain instantaneous frequency characteristics of signals, and all these methods are subject to the "quan-tum uncertainty" theorem, which states that a signal and its Fourier transform can not both have small support [32], and that frequency and time and both can not be determined to arbitrary precision [45,47]. The resulting outcome of this drawback is a non-unique, low fidelity image, which changes depending on its frequency resolu-tion [29,30]. Also, heart sounds are nonlinear, non-sinu-soidal and exponential signals, and it has been demonstrated in signal processing literature [43] that Fou-rier transform is not mathematically appropriate method to study such signals.
There are numerous recent publications on the subject of digital recording and analysis of heart sounds. Green et al. [33] discuss optimal ways of recording heart murmur findings using SNOMED templates, DeGroff et al. [22] suggest a potential for computerized frequency analysis to further improve the accuracy of murmur assessment and Nigam et al. [34,35] introduce new ways of segmenting heart sound signal. Finley et al. [36] demonstrated that email digital recordings of children's heart sounds are of diagnostic quality and allow accurate distinction between innocent and pathologic murmurs in >90% of cases. Mar-cus et al. [37] and Collins et al. [38] use heart sound recordings to correlate S3 estimates, BNP levels and CHF diagnosis, demonstrating very high specificity (85–90%) of digital heart sound recordings for CHF diagnosis in patients over 50 years old. Kudriavtsev et al. [39] demon-strated that Still's murmurs have narrow spectral band-width, with this being a significant feature differentiating them from abnormal murmurs.
We conclude that there is a clear upsurge of clinical inter-est in spectrographic representation of heart sounds. However existing signal processing methods lack in accu-racy and resolution. Unlike other short term Fourier trans-form based approaches [15-19] and Gabor's transformation [32,48,49], which offer approximation to instantaneous energy distribution of a signal, the Wigner-Ville distribution [45,46] has been derived to compute the signal energy at each time instant, exactly utilizing knowl-edge of the entire signal to compute time-frequency prop-erties for each moment in time. The method used in this study is based on the Wigner-Ville distribution and is called Heart Energy Signature (HES).
HES represents a unique state of dynamically changing multi-component signal of the heart beat. It can be visual-ized as an image of the instantaneous heart pulsation energy distribution in both frequency and time domains. It is intended for use as an individual biometric character-istic for heart sound interpretation.
2.0 Methods
2.1 Wigner-Ville distribution function
The pseudo Wigner Ville Distribution [40-42] is a form of the spectrogram, which is based on joint time-frequency distribution (Eugene Paul Wigner (1902–1995), Nobel prize laureate in Physics, introduced quasi-probability distribution in 1932 study quantum corrections to classi-cal statisticlassi-cal mechanics). Wigner's probability function [44,45] addresses a question of the Heisenberg quantum uncertainty [47] – that momentum and position of the particle can not be determined to arbitrary precision (quantum physics theory). For a quantum particle described by its probability function of coordinates, Wigner has developed a probability distribution of the
particle to simultaneously have particular coordinates and momentum [45]. Ville [46] further developed Wigner's function to compute the instantaneous frequency of the signal at each time instant. The resulting Wigner-Ville dis-tribution of time and frequency [32,40,41] attempts to express frequency as a function of time. Since signal fre-quency is related to signal energy, one can interpret Wigner-Ville distribution as the energy map of a signal in time and frequency.
2.2 Heart energy signature (HES)
A Heart Energy Signature is essentially a high-resolution 2D spectrographic image of the heart sound signal that is based on the Wigner-Ville joint time frequency distribu-tion [40] of recorded heart sound signal. Schematic details are shown in Fig. 1, where the corresponding heart sound components (Fig. 1A) and matching elements on the energy signature map (Fig. 1B) are identified. This image stores comprehensive information concerning time aver-aged and instantaneous changes in mechanical energy of
(A, B). Schematics of the Heart Sound Structure and Energy Signature Map
Figure 1
(A, B). Schematics of the Heart Sound Structure and Energy Signature Map. A) Schematic heart sound s wave form display (phonocardiogram -PCG). Second heart beat shows sche-matically S2 split. B) Energy Signature joint time-frequency map.
A)
the heart beat. These changes are characterized by fre-quency and intensity. Unlike previous attempts to charac-terize heart sounds in this manner (based on Short Term Fourier Transform) STFT (and/or Gabor transform) the HES method is unique in its ability to resolve heart energy accurately in both time and frequency simultaneously. STFT spectrogram can only resolve accurately in time or frequency, but not both time and frequency [28]. Figs. 2(A,B) presents a typical example of a HES obtained from a patient (showing two heart beats) and can be compared with spectrograms obtained using traditional short term window Fourier transform (Figs. 9(A,B), 10(A–D)) and Table 2. This is of a pediatric patient with innocent heart murmur recorded at the apex, sampling frequency of 11 kHz. Binary wave file with the sound is attached [see Addi-tional file 1]. Other comparisons are shown on Figs. 5(A– E), 6(A–E), 7(A–C), 8(A–D) and Table 1. We have thus a method having accurate time-frequency resolution and which satisfies the many mathematical properties, includ-ing energy, time and frequency marginals and instantane-ous frequency [32,49,53].
Tovar-Corona et al. [20,21] described similarly appearing contour graphs obtained using the continuous wavelet (CWT) based method. This method is now gaining accept-ance in signal processing and mathematical details of this method are discussed elsewhere [30-32]. The CWT method presents results in wavelet scale – time map, and not on frequency (pitch) time map. Thus, accurately cor-relating wavelet scales with frequencies is difficult and for this reason is beyond the scope of this study.
2.3 Mathematical method and computational implementation
2.3.1 Preprocessing
The flowchart for computation of Heart Energy Signature (HES) is shown in the Appendix A [see Figure 15]. The first step in pre-processing heart sounds is normalization of the data. By doing so, the heart sounds obtained from different instruments and measurements may be com-pared. That is, normalization makes data instrument and measurement independent. The amplitude of heart sounds may vary widely, depending upon the location of the sensor used and the measurement system, e.g. phono-cardiograph (PCG) vs. electronic stethoscope. To stand-ardize the comparison of heart sounds in the time domain, they are normalized to have their amplitude vary between [-1,+1]. The process of normalization of the sig-nal x(t) to [-1,+1] amplitude range is well known in signal processing. The basic steps include:
1. find the minimum xmin and the maximum xmax values of the signal
2. divide the signal by 0.5*|xmax - xmin|
Presentation of the time signal in the normalized form is important, since the same signal can appear differently at different amplitude scales. Furthermore, normalization of the heart signal creates the signal presentation with easily computed proportionality relationships between the amplitudes of the signal at various time instances.
After normalization, the next step in the heart sound processing is computation of heart sound energy, as described in the following section.
2.3.3 HES derivation using joint time frequency transformation The energy of a signal x(t), including both acoustic and PCG signals, is proportional to the squared amplitude of the signal. The signal energy E, contained at the time inter-val [t, t+T] is computed as
The time plot of the heart sound PCG displays the ampli-tude of the sound at each instant, i.e. no information about the energy is displayed. An accepted principle in acoustics is that the energy of the single frequency acoustic signal at each instant is proportional to the squared amplitude of the signal and the squared frequency of the signal. Computation of the acoustic energy is particularly difficult where the acoustic signal consists of many signals with fast changing frequency components. In this case, the acoustic energy must be presented in the form reflecting its energy content at each instant at the various frequen-cies contained in the signal. Thus, one must compute acoustic energy as a function of both time and frequency: E = E(t, f).
The best method to compute heart sound energy is to uti-lize joint time-frequency distribution (JTFD). JTFD reflects the distribution of the signal energy in the time-frequency plane [51,52]. However, JTFD may not mathe-matically satisfy energy properties, i.e. to be positive throughout time-frequency plane. In order for distribu-tion to have the same properties as energy, the chosen dis-tribution has been modified to be a real positive value at each point of the time-frequency plane. Steps to obtain such distribution are outlined below.
A large number of time-frequency distributions of a signal x(t) are given by Cohen's class as
E x t dt
t t T
= +
∫
| ( ) |2 (1)C t, f ( )= 1
∫∫∫
( , ) (x t x t e+ ) *( − ) −j t j− f −j u2π φ θ τ
τ τ θ π τ θ
2 2
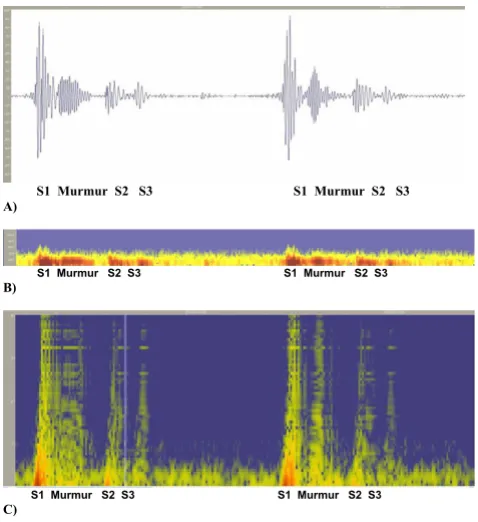
(A, B). Heart Energy Signature Spectrogram obtained using pseudo Wigner-Ville joint time frequency distribution Figure 2
(A, B). Heart Energy Signature Spectrogram obtained using pseudo Wigner-Ville joint time frequency distribution. A) Two con-secutive heart beats showing S1 heart sound, innocent murmur, S2 heart sound and S3 heart sound. Period between S1 and S2 is systolic and between the S2 and neighboring S1 diastolic. For display purposes 0.4 sec of diastolic period (between S3 and S1 were cut out of the image [see Additional file 1]. B) "Zoom in" on the first heart beat showing end of S1, murmur, S2 and S3 sounds. C) Image Detail – Same Spectrogram as shown in Figs. 2(A,B).
S1 Murmur S2(sp) S3 S1 murmur S2
A)
Murmur Split S2 S3 B)
Power S1: (1) (2) S1 shows split
Power S2: A2 P2 S3
S2 shows clear A2 and P2 on the same plot, S3 is clearly visible
where t is time, f is frequency and τis the running time. The function φ(θ, τ) is the kernel defining distribution properties. If the kernel φ(θ, τ) = 1, we obtain the Wigner-Ville Distribution (WVD):
The WVD can be regarded as theoretically optimal in that a maximum number of desirable mathematical properties are satisfied [51]. In the field of the signal processing all time-frequency distributions of Cohen's class can be com-puted by means of convolution of the Wigner distribution with a two-dimensional impulse response function [52].
For the kernel φ(θ, τ) = μ(τ), we obtain the pseudo WVD (PWVD). The Gaussian sliding window function μ(τ) is used having an optimal time-frequency concentration:
h(τ) = A exp(-σ2τ2), (6)
where A and σare real positive constants.
The WVD and PWVD may not necessary be positive func-tions at each point on the time-frequency domain for gen-eral signals. From the energy concept, it would be more convenient to work with a positive function, as in the case of magnitude of FFT. The WVD can artificially be made positive by simply calculating its absolute value at each point. The common interpretation of WVD as an energy density can thus be allowed, or the intensity of a signal, to be simultaneous in time and frequency.
Since for general signals, the WVD takes on negative val-ues, the absolute positive form |PWVDxx(t,f)| of the PWVD is used in the format for the HES. This guarantees the distribution to be positive in the time-frequency plane and makes straightforward interpretation of the distribu-tion as the signal energy in the time-frequency.
The absolute positive form of the PWVD is used for putation of the HES. Thus, the preferred method to com-pute heart sound energy distribution is as follows:
E(t, f) = |PWVDxx(t, f, A, σ)|, (7)
where A = 1.0, σ2 = 10-5, t ∈ [τ, τ+ T], f ∈ [f 1, f2].
The description of PWVD implementation is given in [42] and is implemented in a commercial software package BSIGNAL [56], both being developed by the present authors. Computational flowchart is given in the Appen-dix A [see Figure 15]. The WVD distribution satisfies the frequency marginal condition [52,54])
WVDxx(t, f )= x t ( + )x*(t e− ) −j f d
−∞ ∞
∫
1 2πτ τ π τ τ
2 2 ,
2
(3)
PWVDxx(t, f )= x t( + ) (x t * − ) ( )e−j f d
−∞ ∞
∫
1 2πτ τ μ τ π τ τ
2 2 ,
2
(4)
μ τ( )=h( ) (τ h*−τ),
2 2 (5)
Table 1: Murmur frequency resolution for STFT (Fig. 4A, and Figs. 7(A-D))
Window size, w Mean frequency, Hz Half-bandwidth, Hz Peak frequency, Hz Low Frequency, Hz High frequency, Hz
HES 107.5 53.7 112.9 53.76 161.29
16 114.4 114.4 37.68 0 228.79
256 113.0 24.22 99.59 88.8 137.3
1024 113.0 21.53 102.28 91.5 123.6
Sampling frequency – 11 kHz. Half bandwidth, low frequency and high frequency are estimated from the spectral plot at 50% of maximum magnitude.
Table 2: Quantitative comparisons of murmur frequency resolution as presented on Fig. 2B
Murmur S1 S2
HES STFT HES STFT HES STFT
Half-bandwidth HB, Hz 20 101 36 80 28 84
Low frequency LF, Hz 80 0 32 0 48 0
where |X (ω)|2 is the energy density spectrum, and ω= 2πf is the angular frequency. This equation means that the integral of the WVD over the time variable at a certain fre-quency ωyields the energy density spectrum of x(t) at this frequency. This property of the WVD is expanded here to compute the energy density spectrum for the HES format (part E1 of the format, outlined in Sect. 2.4).
The WVD also satisfies the time marginal condition [5]
Accordingly the integral of the WVD over the frequency variable at a certain time t yields the instantaneous signal power at that time. Using the energy density interpreta-tion of the PWVD, the signal energy at time t and fre-quency f contained in a cell dt by df can be found as |PWVDxx(t, f)|dtdf [42]. Other important signal character-istics that can be defined from the PWVD include the instantaneous energy of the signal, or signal power [42]
P(t) = ∫|PWVDxx(t, f)|df. (11a)
Thus, the instantaneous energy of the heart sound signal, or the heart sound signal power, is computed for the HES format (part C1 of the format, outlined in Sect. 2.4) as
The equation for Short Term Fourier Transform STFT is given by
where h(t) is the analysis window function. The transform given by the Equation (18) with the Gaussian window function is called Gabor Transform. Since the STFT is com-plex-valued in general, the spectrogram is used for display purposes. The spectrogram is computed as the squared magnitude of the STFT:
2.4 Heart energy signature (HES) format
The HES format utilizes several additional averaged and instantaneous characteristics which may be extracted from the HES image and source signal. The components of the format to present heart sound energy are schematically illustrated in Figs. 1(A,B) and in the graphic form of Figs. 2(A,B). Figs. 1(A,B) illustrate schematically generic PCG (oscillographic heart sound display) of two heart beats and its HES spectrogram reflection. It includes S1, S2, S3 sounds and also illustrate S2 split as well as systolic and diastolic intervals. Fig. 1B demonstrates (maps) heart sound components as energy contours, with shape depending upon energy distribution in time and fre-quency. Thus, additional heart sounds or murmurs as well as normal S1 and S2 will be manifested as additional energy contours and missing sounds will lead to signifi-cant reduction or complete disappearance of these con-tours. Contour values inside the dark zones always exceed certain predefined energy threshold, for example 20% of maximum energy or 50% of maximum energy.
In the majority of heart conditions a single heart beat is sufficient to define format. Let us assume that the heart beat is recorded during the time interval [τ, τ + T] with measurement instrument capable of capturing frequency range [f1, f2]. Thus, HES format includes (see also Figs. 3(A–E) and Figs. 4(A–B)):
A1. The distribution of the heart sound energy simultane-ously in time and frequency
E = E(t, f), t ∈ [τ, τ+ T], f ∈ [f1, f2] (13)
where E is heart sound energy distribution, t is time, f is frequency.
B1. The normalized heart sound corresponding to the heart sound energy
x = x(t), t ∈ [τ, τ+ T], x(t) ∈ [-1, +1] (14)
C1. The instantaneous energy of the heart sound signal, or heart sound power, corresponding to x(t)
P = P(t) t ∈ [τ, τ+ T] (15a)
D1. Instantaneous heart sound power, corresponding to x(t) at a particular frequency f
P = P(t) t ∈ [τ, τ+ T] (15b) | ( ) |Xω WVDxx( , )t dt
π ω 2 1 2 = −∞ +∞
∫
, (8)D X f PWVDxx t f dt
T
=| ( ) |2= +
∫
| ( , ) |τ τ
(9)
| ( ) |x t 2 1 WVDxx( , )t d . 2
= −∞ +∞
∫
π ω ω (10)
P t PWVDxx t f df t T
f f
( )=
∫
| ( , ) | , ∈[ , + ]1 2
τ τ (11b)
STFT t fx( , )= x t h t( ) ( − )e−j ftdt
−∞ +∞
∫
τ 2π (12a)S t fx( , ) |= STFT t fx( , ) | |= x t h t( ) ( − )e−j ftdt|
−∞ +∞
∫
2 τ 2π 2
(A-E). Heart Energy Signature (HES) Format and Display [see Additional file 2] Figure 3
(A-E). Heart Energy Signature (HES) Format and Display [see Additional file 2]. A) Heart Energy Signature Spectrogram, cross hair shows locations of instantaneous extraction lines (A1: Eq. 13). B) Signal Plot (B1: Eq. 14). C) Normalized square root of Power (C1: Eq.15a). D) Instantaneous square root of Power, frequency = 107 Hz (D1: Eq.15b). E) Frequency Distributions (E1: Eq. 16). E2. Peak frequency 124 Hz, High frequency 133 Hz, Low frequency 111 Hz, half-bandwidth 11 Hz. E3. Peak frequency 128 Hz, High frequency 153 Hz, Low frequency 107 Hz, half bandwidth 23 Hz. All measured at 50% of maximum amplitude.
S1 Murmur Split S2
A)
B)
C)
D)
E1. Integral-murmur E2. FFT-murmur E3. Instant -murmur
(A-F). Heart Energy Signature (HES) Format and Innocent Murmur Details [see Additional file 2] Figure 4
(A-F). Heart Energy Signature (HES) Format and Innocent Murmur Details [see Additional file 2]. A) Instantaneous Peak Fre-quency (IPF) extracted from HES (F1: Eq. 17). B) Instantaneous Mean FreFre-quency (IMF) extracted from HES (F1: Eq. 18). C) Murmur Signal Plot. D) Murmur HES. E) Murmur normalized square root of power, time duration is measured 118 ms, using 10% threshold value. F) Murmur IPF Plot. At time t = 0.263 s frequency is measured equal to 127.1 Hz.
A)
B)
C)
D)
E)
(A,B,C,D,E). Comparison of HES and STFT frequency resolution on the spectrogram, chirp function Figure 5
(A,B,C,D,E). Comparison of HES and STFT frequency resolution on the spectrogram, chirp function. A) Three pulses of nor-malized chirp function, linear change in frequency is shown by the darker line, on this line "-1" frequency corresponds with 60 Hz and "+1" corresponds with 109.8 Hz. B) HES Energy Signature Spectrogram obtained using present method. C) Spectro-gram obtained using STFT with window size w = 32. D) SpectroSpectro-gram obtained using STFT with window size w = 16. Same color scale was utilized all three figures. E) Comparison of Frequency Resolution in the energy density spectrum between HES and STFT given for the same signal and moment of time (LF - low frequency, HF = high frequency, BW - bandwidth, all meas-ured at 50% of maximum amplitude).
A)
B)
C)
D)
HES Spectrum, t =0.5805 s, LF=74Hz, HF=93Hz, BW=19Hz
STFT Spectrum w=32, t=0.5805 s, LF=46Hz, HF=115Hz, BW=69 Hz
(A,B,C,D,E). Comparison of HES and STFT frequency resolution on the spectrogram, simulated S2 split function [see Addi-tional file 3]
Figure 6
(A,B,C,D,E). Comparison of HES and STFT frequency resolution on the spectrogram, simulated S2 split function [see Addi-tional file 3]. A) Phonocardiogram: two realistic S2 narrow split test. B) HES Spectrogram (two separate energy contours are clearly seen). C) STFT w = 256 Spectrogram (separate counters united together, split is lost). D) HES Integral Power Plot showing excellent split resolution accuracy at mid point DTS1 = 14.6 % of the peak, DTS2 = 2.9% of the peak. E) STFT Spec-trogram w = 256 Power Plot (split is completely lost) accuracy at mid point DTS1 = 78.5% of the peak, DTS2 = 66% of the peak.
DTS1=20 ms DTS2=41 ms A)
B)
C)
D)
E1. The energy density spectrum of the heart sound, cor-responding to x(t)
D = |X(f)|2, f ∈ [f
1, f2] (16)
F1. Instantaneous mean and peak frequency of the heart sound signal, corresponding to E(t,f). Instant peak fre-quency (IPF) = frefre-quency f* for given t*, for which
E(t*,f*) = Max(E(t*,f)) (17)
Instant mean frequency, or IMF, defined as
The HES can be stored as a digital file and displayed visu-ally. Its visual representation consists of a following set of quantitative plots and images (Figs. 3(A–E), Figs. 4(A,B)):
• a two-dimensional image (2D) representing the distri-bution of the heart sound energy simultaneously in time and frequency as defined in A1 (Fig. 3A)
• a time plot of the normalized heart sound correspond-ing to the heart sound energy as defined in B1 (Fig. 3B)
• a plot of the instantaneous energy of the heart sound, or heart sound power, as defined in C1 (Fig. 3C)
• a plot of the instantaneous energy of the heart sound at a given frequency, or heart sound power at a given fre-quency, as defined in D1 (Fig. 3D)
• a plot of the energy density spectrum of the heart sound, as defined in E1 (Fig. 3E).
• a plot of the time averaged energy density spectrum computed by Fast Fourier Transform FFT (Fig. 3E2)
• a plot of the instantaneous peak (Fig. 4A) and mean (Fig. 4B) frequencies, as defined in F1
These plots help to provide a comprehensive description and quantitative differentiation of heart abnormalities. For example, Fig. 3A provides qualitative visualization of every cardiac sound event, including S2 split and gives instantly visual ranges of change in frequency and time. Fig. 3C provides us with precise estimation of S2 split duration (time distance between peaks is equal to 30 ms) and S2 duration (75 ms) and provides relative scale of intensity for systolic murmur (30% of maximum power). Fig. 3D provides the same measure, but at the dominant murmur frequency of 125 Hz (horizontal line on Fig. 3A). On that frequency murmur power is increased to 45% of maximum. Fig. 3E1 shows the energy density spectrum of murmur obtained from HES for entire murmur time dura-tion (murmur peak is at 125 Hz and half-bandwidth at 50% magnitude is 21 Hz), same spectrum obtained by FFT is shown on Fig. 3E2 (peak frequency 124 Hz, half-bandwidth 11 Hz and on Fig. 3E3 we show instant energy density spectrum obtained at murmur intensity peak (ver-tical line on Fig. 3A), showing peak at 128 Hz and half-bandwidth of 23 Hz. This instantaneous frequency distri-bution can be obtained at any time instant for murmur or any other sound component. We also measure effective frequency bandwidth (lower frequency LF and high fre-quency HF) at 50% of the magnitude on the spectrum dis-tribution. Instantaneous peak and mean frequencies extracted from HES are shown on Figs. 4(A,B) where we can clearly see dominant frequencies of S1, S2 and mur-f
E t f fdf
E t f df
f f
f f
*
*
*
( , )*
( , )
=
∫
∫
0 1
0
1 (18)
(A,B,C). STFT Heart Sound Resolution (same heart sound that is shown in Figs. 3(A-E))
Figure 7
(A,B,C). STFT Heart Sound Resolution (same heart sound that is shown in Figs. 3(A-E)). A) STFT, time window w = 16, frequencies are overstretched, time resolution is good. B) STFT, time window w = 256, frequencies are crude, time resolution is compromised (no split), image is pixilated. C) STFT, time window w = 1024, frequency resolution is good, time resolution is completely compromised, image is pixi-lated.
A)
B)
(A, B, C, D). STFT Heart Sound Time Resolution (same heart sound that is shown in Figs. 3A and B, sampling rate 11 kHz) Figure 8
(A, B, C, D). STFT Heart Sound Time Resolution (same heart sound that is shown in Figs. 3A and B, sampling rate 11 kHz). A) Power Plot HES. B) Power Plot STFT, window w = 16. C) Power Plot STFT, window w = 256. D) Power Plot STFT, window w = 1024.
A)
B)
C)
mur. Murmur frequency varies in time between 100 to 150 Hz; S2 frequency varies between 160 to 100 Hz and S1 changes between 70 to 145 Hz. Instantaneous jumps in frequency can be visualized, measured and correlated with extra sounds(clicks, snaps, splits, etc). To further illustrate HES format ability to characterize heart sound we extracted murmur signal from the heart sound (Fig. 4C) and analyzed it separately. Murmur energy signature is depicted in Fig. 4D showing narrow frequency width, with data extraction performed at vertical and horizontal lines. From this image mean frequency of 125 Hz, fre-quency half-bandwidth 20 Hz, lower frefre-quency 102 Hz and high frequency 142 Hz are measured. On Fig. 4E the murmur instantaneous power change at dominant fre-quency is shown. The horizontal line drawn at 10% power threshold shows murmur start, end points and timing of murmur energy peak (0.262 sec). Fig. 4F shows instanta-neous murmur frequency variation, with frequency being 125 Hz at murmur energy peak.
2.5 Heart sound data
In developing this method heart sounds that were recorded between 1980–91 by one of the authors at the Department of Pediatric Cardiology, IWK Center at Dal-housie University, Canada were utilized. Heart sounds were collected at four major auscultation positions, and subsequently documented as a database which included auscultation position, binary wave sound track (recorded at 11 kHz sampling rate), clinical diagnosis and ausculta-tory diagnosis. Most of this data was subsequently included in the educational teaching system, EarsOn [50] which included 260 clinical recordings and which was successfully utilized in the teaching of medical students and physicians [3]. All heart sound recordings used in this paper are from that database (see Additional files 1, 2, 5, 6, 7, 8, 9), and no artificial or simulated sounds have been used.
3.0 Results and Discussion
3.1 Overview – what can we do with HES
New hardware and digital sound recording technologies can not completely revitalize old approaches (i.e. PCG or spectrograms) unless new methods present new advan-tages. The HES spectrogram offers a variety of new tools that may greatly reduce all existing disadvantages of PCG (see Sect. 1.2). By allowing dynamic separation of signal contributions (tones) in frequency and space intrinsic details of signal morphology are demonstrated. The HES spectrogram does not require special filtration. Back-ground and line noise equally contribute to the entire spectrogram and thus are effectively eliminated from the visual image. The time dependent heart power plot deci-phered from the HES spectrogram allows easy identifica-tion of start and end points of various heart sound components, showing as well separate peak components when signals are split. The method allows objective char-acterization of both time-averaged and instantaneous murmur's mean and peak frequencies and effective band-width, thus aiding in subsequent murmur classification. Folded multi-component frequencies are immediately visualized and documented on the HES image (Eq. 13). Integral HES energy (power plot, Eq. 15a) allows provi-sion of a very detailed characterization of murmur and heart sound intensity (as it changes with time), offering unlimited possibilities to introduce precise digital scores to replace subjective Freeman-Levine system [59] of mur-mur intensity grades. Finally, the combination of PCG, HES image, power and frequency plots (Eqs. 13–18), allow much easier separation and identification of heart sounds, without the necessity of additional synchronized ECG tracings. These data plots also offer precise ability to measure timing of cardiac sound events, durations, delays and documentation of arrhythmias (variation in distances between energy peaks) if present. Additionally, HES offers the possibility of correlating time varying frequency (Eqs.
(A,B,C). Spectrogram Method signal resolution Figure 9
(A,B,C). Spectrogram Method signal resolution. A) Original Recording (PCG). Displayed using Meditron Analyzer soft-ware (Welch-Allyn, NY). [See Additional file 1]. B) Spectro-gram obtained using Nero Wave Editor Software. C) Wavelet Scaleogram (obtained using wavelet transform, Nero Wave Editor Software).
S1 Murmur S2 S3 S1 Murmur S2 S3 A)
S1 Murmur S2 S3 S1 Murmur S2 S3
B)
S1 Murmur S2 S3 S1 Murmur S2 S3
17–18) and intensity (Eqs. 15 (a,b)) of heart sounds with time dependent C-Doppler velocity profiles or M-mode ultrasound. This is done by a virtue of providing precisely calculated time varying mean frequency, instantaneous frequency and signal energy derived from the HES image. Rabin [63] directly correlates murmur intensity and mur-mur frequency with velocity and pressure gradient through an obstruction.
3.2 Examples of innocent murmurs using HES spectrograms
An example of a HES spectrogram for the innocent Still's murmur is presented in Fig. 2A with additional details shown in Figs. 2(B,C). The key characteristic of this image is the sharp resolution, making it possible to visually iden-tify every component of the heart sound in a manner sche-matically described in Figs. 1(A,B). This heart sound is recorded at the apex. S1 is followed shortly by a 2+/6 systolic murmur of distinct musical quality. S1, S2 and S3 sounds are easily heard, and S2 sound is single to the experienced auscultator. However HES indicates narrow
(A, B, C, D). Changes in the STFT Spectrogram due to change in the window size Figure 10
(A, B, C, D). Changes in the STFT Spectrogram due to change in the window size. PCG is shown on Fig. 9A, Spectrograms shown on A), B) and C) were obtained using Meditron Analyzer software distributed by Welch-Allyn, NY. Also compare against the Fig. 2 obtained using HES method. [see Additional file 1]. A) Window size w = 1024 points (better time resolution). B) Window Size w = 2048 points. C) Window Size w = 4096 points (better frequency resolution). D) HES spectrogram (see also in greater detail in Figs. 2(A-C)).
S1 S2 S1 S2
S1 S2 S1 S2
A)B)
splitting of A2 and P2, illustrating the capability of the method. To illustrate the quantitative side of this method, instantaneous mean frequency characteristics were meas-ured for murmur at times t = 0.4 s; 0.43 s; 0.45 s and 0.47 s. Murmur mean frequency and half-bandwidth were cor-respondingly 112.9/13.4; 106.2/14.8; 99.5/10.7; 94/13.4 (all measured in Hz) all consistently demonstrating nar-row frequency bandwidth.
A second example of an innocent murmur recording of a pediatric patient is shown in Figs. 3(A–E) and 4(A–F). Sound recorded at 2nd LSB. These figures contain 13 com-ponents and demonstrates full graphic representation of HES image and format. The first five key elements are shown one below the other. The HES image shows corre-sponding flooded energy contours (Fig. 3A). The PCG of a single heart beat shows S1, murmur and split S2 sounds in a consecutive order (Fig. 3B). Power plots of Figs. 3C and 3D illustrate the most significant energy components and their gradients. Fig. 3C demonstrates the integral power plot (energy integrated across all frequencies) and in Fig. 3D power is extracted at a pre-selected murmur fre-quency (shown as a horizontal line at the cross-hair, Fig. 3D), The power plot clearly shows the maximum ratio of murmur to S2 intensity to be equal to 32%, which is con-sistent with clinical impression of the murmur being of 2+/6 intensity [50]. The instantaneous frequency plot (Figs. 4A and 4B) illustrates the start and end of each heart sound. The variation of frequency of these components is also seen. Clearly demonstrated is that the murmur fre-quency decreases, that S3 frefre-quency is the lowest; and that S2 has two frequency components separated in time.
The following three components are presented in Fig. 3E and represent:
1) energy density spectrum of the heart murmur (E1),
2) murmur time averaged frequency spectrum, obtained using FFT (E2), and
3) instantaneous energy density spectrum of heart mur-mur at its peak intensity (vertical cross-hair at the Fig. 3A).
Statistical characteristics of murmur frequency spectrum (peak frequency, mean value, bandwidth around mean value) and all numerical frequency criteria are obtained using equations (17–18) by integrating the energy signa-ture image. Corresponding murmur detail and its HES are shown in Figs. 4C and 4D. Murmur oscillations are evi-dent (basically non-musical), the frequency band of which is shown in detail, confirming the clinical diagnosis of innocent flow murmur [39,50].
In Figs. 4D and 4E, "zoomed in" details of the HES are demonstrated, as well as detail of Doppler echo-like mur-mur intensity variation plot. The detail of the instantane-ous murmur frequency plot (Fig. 4F), showing the murmur gradually increasing its frequency from 80 Hz to 125 Hz and then reducing it to 70 Hz, is also shown. Eas-ily seen is that while time averaged frequency and instan-taneous time frequency bands are narrow, the time dependent variation of the frequency spectrum of the murmur is significant. Abrupt start and end points of the murmur are clearly evident in these plots.
3.3 STFT spectrogram accuracy vs. new method
Classic spectrograms display frequency on the vertical axis and time on the horizontal, and plot sound intensity (measured in decibel) as a color map. They utilize Short Term Window Fourier Transform (STFT), which is a first order method and is subject to the uncertainty principle, whereby one cannot achieve simultaneous resolution in both frequency and time [32]. Publications concerning signal processing also point to the inadequacy of the STFT method [28-30].
3.3.1 Comparison using model signals
at split mid point is 14.6% for DTS1 and 2.9% for DTS2, while correspondingly STFT temporal error is 78.5% and 66%.
In Figs. 7(A,B,C) STFT spectrograms that correspond to the HES image of Fig. 3A are shown. Clearly seen is that short window (Fig. 7A) overstretches frequency range, medium size window (Fig. 7B) provides very crude visual resolution and large size time window (Fig. 7C) com-pletely smears all important components of the heart sound. Matching integral power plots obtained using Eq. 15a are presented in Figs. 8(A,B,C,D). Shown also is the excellent HES resolution of S2 time split (Fig. 8A), excel-lent time resolution of short window STFT (Fig. 8B), the bad time resolution for medium size STFT window (S2 split is lost, Fig. 8C) and the poor time resolution for large size STFT window (S1,S2 and murmur are smeared together, Fig. 8D). Corresponding quantitative frequency resolution measures are presented in Table 1. Again seen is that frequency resolution for STFT time windows w = 256 & 1024 is good, but image quality is pixilated, and time resolution for these windows is grossly insufficient (Figs. 8C and 8D). Time resolution for STFT window w = 16 is excellent, but frequency resolution is grossly overes-timated, lower bound of frequency is completely lost (zero Hz), upper bound is exaggerated by 41% and fre-quency bandwidth is exaggerated by 215%.
3.3.2. Comparison using clinical heart sound and third party software In this section comparison of the STFT spectrogram method with our newly developed method using example of a clinical heart sound is carried out. The original record-ing is also presented in Figs. 3(A–E) and 4(A–F) (usrecord-ing new method), the heart sound recording being that of an innocent murmur (musical) of a child, the sound track being recorded with 11 kHz sampling rate. To enable fur-ther research and comparisons the sound track is attached [see Additional file 2]. The STFT spectrograms shown were obtained using state-of-the art Meditron Analyzer soft-ware (FDA cleared clinical product distributed by Welch Allyn, NY) using its default (best) transformation option – Hanning window with 1024, 2048, 4096 data points correspondingly. A typical clinical complaint concerning this method is that clear separation of heart sounds is not allowed, and that precise identification of A2 and P2 com-ponents and their split is difficult. In Figs. 9(A,B) and 10(A,B,C), spectrograms obtained using STFT are shown, which currently have been the only means of obtaining dynamic content of the heart sound spectral signal. Quan-titative data extraction is not possible as it is not possible using current third party software.
Recent studies [16-19,23-25] show similar spectrograms, also without presenting quantitative details. Certain researchers (i.e. Bentley et al [55]) simply select window
function and its parameters (i.e. length) for a particular heart signal by trial and error. This leads to ambiguity in time-frequency resolution to the point that two STFT com-puted for the same signal, but with different window func-tion parameters, could hardly be identified as computed for the same signal This is clearly demonstrated by com-parison of Fig. 7A and Fig. 7C). Results presented in Figs. 10(A,B,C) illustrate this ambiguity as it is not clear which resolution is correct. Window sizes w = 1024, 2048, 4096 data points with sampling rate of 11 kHz were employed. Small size window will improve time resolution, but will have poor frequency resolution and vise versa.
S3 sounds. Note a clear separation of the heart murmur, and that aortic and pulmonary components of P2 are clearly visible. One also sees in S1 clear separation of mitral and tricuspid components in the power (energy) vs. time plot (Fig. 2C). We can also identify from the plot time the delay between S2 and S3 as well as their duration. In Table 2 we provide further quantitative comparison of murmur, S1 and S2 time averaged frequency resolution using HES and STFT (obtained by the authors using method described in Sect 3.3.1 and Eqs. 12a and 12b, time window w = 16 data points, frequency window 2048 data points). STFT exceeds upper frequency estimation by 60 to 66% and frequency bandwidth estimation between 2.2 to 5 times.
Several other relevant issues and especially end point detection using HES, PCG, STFT and effects of filtration are discussed in the Additional file 4.
3.4 Analyzing heart energy signature
One common and distinctive feature for most heart abnormalities is the appearance of additional energy con-tours, as depicted in Fig. 1B. Here S1 and S2 contours are "normal" (responsible for typical lub-dup sound) and additional contours may indicate murmurs, and extra sounds. For most of these circumstances (additional dark contours) evaluation by the cardiologist will be required. Figs. 11(A,B), 12(A,B), 13(A,B) and 14(A,B) show PCGs and corresponding HES for cases of heart disorders dem-onstrating systolic clicks and murmurs. Figs. 11(A,B) illus-trate mitral valve prolapse (MVP) with three clicks being elicited on cardiac auscultation. The HES figure shown in Fig. 7B clearly indicates 3 extra energy contours located between S1 and S2 in late systole and which are on the left
and right hand side correspondingly. Detecting the exact number of clicks by auscultation is a challenging task. Figs. 12A and 12B present the case of aortic stenosis of moderate severity. Fig. 12B illustrates the appearance of a complex energy contour (consisting of 3 components) between S1 and S2, with S1 having two components, the second of which represents an aortic ejection click. Note that the S2 energy contour shows higher frequency at first (A2 component), followed by lower frequency P2 compo-nent. The murmur occurs in the middle of the systolic interval, with high frequency not exceeding 150 Hz. Note, that PCG (Fig. 12A) does not show clear separation of S1 from the murmur, while HES demonstrates a clear time border. In the murmur of pulmonary stenosis, as dis-played in Figs. 13A, S1 is not seen. This becomes more evi-dent in Fig. 13B. The murmur is represented by a long and wide energy contour, with high frequencies reaching 230 Hz, correlating with the high degree of obstruction that was clinically diagnosed for that patient [50]. The mur-mur begins early in systole, ending before S2. Strong cor-respondence between the pressure gradient (obstruction) and murmur frequency was also demonstrated clinically by other authors [60,61,63]. Figs. 14(A,B) demonstrate an example of Tetralogy of Fallot. This murmur is not associ-ated with post-stenotic valvar dilatation. The murmur has a similar appearance with pulmonary stenosis (Figs. 13(A,B)), but is longer and occupies entire systole, with frequencies reaching 250 Hz. S1 sound is also clearly seen.
We conclude that abnormalities may be detected using overall and immediate visual contrast i.e. self-referencing property of HES image. By also utilizing the quantitative nature of the above displays, the ability to demonstrate murmur pitch, for example, is shown.
(A, B). Abnormal Heart Sound of Mitral Valve Prolapse (3 clinical clicks) [see Additional file 5] Figure 11
(A, B). Abnormal Heart Sound of Mitral Valve Prolapse (3 clinical clicks) [see Additional file 5]. A) PCG (2 heart beats). B) HES (single heart beat).
S1 Cls S2
4.0 Future Work
Future work will focus on documenting various important characteristics of HES spectrograms and specifically on their ability to characterize heart murmur frequency, S2 heart sound frequency and its split, murmur timing and duration, murmur intensity, S3 sound presence and inten-sity, S1 presence and inteninten-sity, presence of ejection sounds and arrhythmias. The library of heart sounds of one of the authors [3,50] will be utilized to conduct these studies. The systolic ejection click is a very difficult auscul-tatory event for the physician to elicit, yet may be the sin-gle abnormal finding. One study currently in progress is to study a cohort of patients with a heart murmur to
deter-mine blindly whether the murmur is innocent or abnor-mal. A study of patients with systolic ejection clicks by HES is in process. The ultimate goal is to have available a low price bedside automated diagnostic tool to supple-ment the existing problem of low auscultatory skill of the family physician.
Conclusion
In this paper a new method and format of analyzing heart sounds using Cohen class joint time-frequency transfor-mation is presented. Initial results of applying these meth-ods to normal and abnormal heart sounds are demonstrated. This method allows detailed quantitative
(A, B). Abnormal Heart Sound of Pulmonary Stenosis (single heart beat) [see Additional file 7] Figure 13
(A, B). Abnormal Heart Sound of Pulmonary Stenosis (single heart beat) [see Additional file 7]. A) PCG (single heart beat). B) HES (single heart beat).
Murmur S2
A)
Murmur S2
B)
(A, B). Abnormal Heart Sound of Aortic Stenosis (single heart beat) [see Additional file 6] Figure 12
(A, B). Abnormal Heart Sound of Aortic Stenosis (single heart beat) [see Additional file 6]. A) PCG (single heart beat). B) HES (single heart beat).
S1 Murmur S2
characterization of heart sounds and uses both visual images and a system of integral plots that characterize time averaged and instantaneous sound intensity and fre-quency variations. Examples of the innocent murmur, mitral valve prolapse, pulmonary and aortic stenosis, and
Tetralogy of Fallot are presented. All heart sound compo-nents, i.e. S1, S2, S3, murmurs and sound splits, were clearly separated in time and frequency. High resolution of generated heart sound images, in both time and pitch, are demonstrated, presenting a distinctly improved qual-ity to traditional spectrogram images (based on SFFT). The resulting visual images have self-referencing quality, whereby individual features and their changes become immediately obvious.The procedure also offers a new parameter for cardiac research, which, for example by vir-tue of its ability to portray third heart sounds [58], may well play a valuable part in the management of patients with coronary artery disease. Current ACC/AHA Guide-lines recommend that patients with unstable angina and a concurrent auscultated S3 be classified in the group at highest risk for adverse outcomes and considered candi-dates for an early invasive strategy [58].
Additional material
Additional file 1
Innocent Still's Murmur 1. Binary soundtrack of an innocent murmur used in Figures 2 and 10. Heart sound is recorded at the apex.
Click here for file
[http://www.biomedcentral.com/content/supplementary/1475-925X-6-16-S1.wav]
Additional file 2
Innocent Stills Murmur 2. Binary soundtrack of an innocent murmur used in Figures 3 and 4. Heart sound is recorded at LSB, 2nd space.
Click here for file
[http://www.biomedcentral.com/content/supplementary/1475-925X-6-16-S2.wav]
Flowchart illustrating the basic steps for Heart Energy Signa-ture spectrogram computational implementation.
Figure 15
Flowchart illustrating the basic steps for Heart Energy Signa-ture spectrogram computational implementation.
(A, B). Abnormal heart sound of Severe Tetralogy of Fallot (acyanotic) [see Additional file 8] Figure 14
(A, B). Abnormal heart sound of Severe Tetralogy of Fallot (acyanotic) [see Additional file 8]. A) PCG (single heart beat). B) HES (single heart beat).
S1 Murmur S2
References
1. Mangione S, Nieman LZ: Cardiac auscultatory skills in internal medicine and family practice trainees. JAMA 1997, 278(9):717-28.
2. Mangione S: The teaching of cardiac auscultation during inter-nal medicine and family medicine training-a nation wide comparison. Acad Med 1998, 73(10 suppl):S10-2.
3. Roy DL, Sargent J, Gray J, Hoyt B, Allen M, Fleming M: Helping fam-ily physicians improve their cardiac auscultatory skills with an inter-active CD Rom. J Contin Educ Health Prof 2002, 22:152-9. 4. Haney I, Ipp M, Feldman W, McCrindle BW: Accuracy ofclinical assessment of heart murmurs by office based (general prac-tice) pediatricians. Arch Dis Child 1999, 81:409-412.
5. Favrat B, Pecoud A, Jaussi A: Teaching cardiac auscultation to trainees in internal medicine and family practice: does it work? BMC Med Educ 4:5. 2004 March 31
6. Fogel DH: The innocent heat murmur in children; a clinical study of its incidence and characteristics. Am Heart J 1960, 59:844-55.
7. MacLaren MJ, Lachman AS, Pocock WA, Barlow JB: Innocent mur-murs and third heart sounds in black school children. Br Heart J 1980, 43:67-73.
8. U.S. Department of Health and Human Services, Center for Medicare and Medicaid Services (CMS). Obsolete and unre-liable diagnostic tests Medicare Coverage Issues Manual Sec. 50-34. CMS Pub. No. 6. Baltimore, MD: CMS; effective January 1, 1997 [http:// www.cms.hhs.gov/manuals/].
9. Baura GD: The Business of innovation. MX: The Online Information Source for the Medical Device Industry 2005 [http://www.device link.com/mx/archive/05/01/baura.html].
10. Kassal J, Reeves W, Donnerstein R: Polymer-based adhered dif-ferential output sensor for cardiac auscultation. Med Electron-ics 1994:54-63.
11. McKusick VA, Webb GN, Humphries JN, Reid JA: On cardiovascu-lar sound: further observations by means of spectral phono-cardiography. Circulation 1955, 11:849-870 [http:// circ.ahajournals.org/cgi/reprint/11/6/849].
12. McKusick VA, Massengale ON Jr, Wigod M, Webb GN: Spectral phonocardiographic studies in congenital heart disease. Brit Heart J 1956, 18:403-416.
13. McKusick VA: Cardiovascular sound in health and disease. Bal-timore: Williams & Wilkins; 1958.
14. McKusick VA: Spectral phonocardiography. Am J Cardiol 1959, 4:200-206.
15. Don Michael TA: Auscultation of the Heart: A Cardiophonetic Approach. McGraw Hill 1998:392.
16. Balster DA, Chan DP, Rowland DG, Allen HD: Digital acoustic analysis of precordial innocent versus ventricular septal defect murmurs in children. Am J Cardiol 1997, 79(11):1552-55. 17. Donnerstein R, Thomsen VV: Hemodynamic and anatomic fac-tors affecting the frequency content of Still's innocent mur-mur. Am J Cardiol 1994, 74:508-510.
18. Noponen AL, Lukkarinen S, Angela A, Sikio K, Sepponen R: How to recognize innocent vibratory murmur. Comp in Cardiol 2000, 27:561-564.
19. Noponen AL: 4th Congress on Pediatric Cardiology. Poster Pres-entation 2005.
20. Tovar-Corona B, Hind MD, Torry JN, Vincent R: Effects of respira-tion on heart sounds using time-frequency analysis. Comp in Cardiol 2001:457-460.
21. Tovar-Corona B, Torry JN: Time-frequency representation of systolic murmurs using wavelets. Comput in Cardiol 1998:601-604.
22. DeGroff CG, Bhatikar S, Herzburg J, Shandas R, Vlades-Cruz L, Mahajan RL: Artificial neural network-based method of screening heart murmurs in children. Circulation 2001, 103:2711-2716.
23. Tavel ME, Katz H: Usefulness of a new sound spectral averaging technique to distinguish an innocent systolic murmur from that of aortic stenosis. Am J Cardiol 2005, 95:902-904.
24. Kim D, Tavel ME: Assessment of severity of aortic stenosis through time-frequency analysis of murmur. Chest 2003, 124:1638-1644.
25. Tavel ME: Cardiac auscultation: a glorious past: and it does have a future. Circulation 2006, 113:1255-1259.
26. Tuchinda C, Thompson WR: Cardiac auscultatory recording database: delivering heart sounds through the internet. Proc AMIA Symp 2001:716-20.
27. Hayek CS, Thompson WR: Wavelet processing of systolic mur-murs to assist with clinical diagnosis of heart disease. Biomed Instrum Technol (Biomedical instrumentation & technology/Association for the Advancement of Medical Instrumentation) 2003, 37(4):263-70. 28. Cohen L: The uncertainty principle for the short time fourier
transform and wavelet transform. Wavelet transforms and time frequency signal analysis 2001, 1-428 [http://en.wikipedia.org/wiki/ Short-time_Fourier_transform]. Birkhäuser Boston.
29. Rein S, Reisslein M: Identifying the classical music composition of an unknown performance with wavelet dispersion vector neural nets (extended version). Information Sciences 2006,
Additional file 3
Test file for S2 split detection. Binary soundtrack of realistically simulated two S2 heart sound splits shown in Figure 6. Each split has its own char-acteristic interval.
Click here for file
[http://www.biomedcentral.com/content/supplementary/1475-925X-6-16-S3.wav]
Additional file 4
Clinical Recording of VSD. Supplemental study that illustrates Heart Energy Signature (HES) characterization of Ventricular Septal Defect (VSD), illustrates accuracy of end point detection using phonocardio-gram, various filters, HES.
Click here for file
[http://www.biomedcentral.com/content/supplementary/1475-925X-6-16-S4.pdf]
Additional file 5
Mitral Valve Prolapse with 3 clicks. sound track for Fig. 11.
Click here for file
[http://www.biomedcentral.com/content/supplementary/1475-925X-6-16-S5.wav]
Additional file 6
Aortic Stenosis. sound track for Fig. 12.
Click here for file
[http://www.biomedcentral.com/content/supplementary/1475-925X-6-16-S6.wav]
Additional file 7
Pulmonary Stenosis. sound track for Fig. 13.
Click here for file
[http://www.biomedcentral.com/content/supplementary/1475-925X-6-16-S7.wav]
Additional file 8
Tetralogy of Fallot (acyanotic). sound track for Fig. 14.
Click here for file
[http://www.biomedcentral.com/content/supplementary/1475-925X-6-16-S8.wav]
Additional file 9
Ventricular Septal Defect (VSD). Sound track for Additional file 4
Click here for file
Publish with BioMed Central and every scientist can read your work free of charge
"BioMed Central will be the most significant development for disseminating the results of biomedical researc h in our lifetime."
Sir Paul Nurse, Cancer Research UK
Your research papers will be:
available free of charge to the entire biomedical community
peer reviewed and published immediately upon acceptance
cited in PubMed and archived on PubMed Central
yours — you keep the copyright
Submit your manuscript here:
http://www.biomedcentral.com/info/publishing_adv.asp
BioMedcentral 176(121629-55 [http://www.fulton.asu.edu/~mre/
audio_wav_ext_Dec04.pdf].
30. Signal processing toolbox for use with Matlab, Version 5. Mathworks 2002:1-800.
31. Qian S, Dapang CD: Joint time-frequency analysis: method and applications. Prentice Hall, NJ 1996:78-79.
32. Lang CW, Forinash K: Time-frequency analysis with the contin-uos wavelet transform. Am J Phys 1998, 66(9):794-797. 33. Green JM, Wilcke JR, Abbott J, Rees LP: Development and
evalu-ation of methods for structured recording of heart murmur findings using SNOMED-CT post-coordination. J Am Med Inform Assoc 2006, 13(3):321-33.
34. Nigam V, Priemer R: A dynamic method to estimate the time split between the A2 and P2 components of the S2 heart sound. Physiol Meas 2006, 27(7):553-67.
35. Nigam V, Priemer R: Accessing heart dynamics to estimate durations of heart sounds. Physiol Meas 2005, 26(6):1005-18. 36. Finley P, Warren AE, Sharratt GP, Amit M: Assessing children's
heart sounds at a distance with digital recordings. Pediatrics 2006, 118:2322-2325.
37. Marcus GM, Gerber IL, McKeown BH, Vessey JC, Jordan MV, Hud-dleston M, McCulloch CE, Foster E, Chatterjee K, Michaels AD: Association between phonocardiographic third and fourth heart sounds and objective measures of left ventricular func-tion. JAMA 2005, 293(18):2238-44.
38. Collins SP, Lindsell CJ, Peacock WF, Hedger VD, Askew J, Eckert DC, Storrow AB: The combined utility of an S3 heart sound and B-type natriuretic peptide levels in emergency department patients with dyspnea. J Card Fail 2006, 12(4):286-92.
39. Kudriavtsev VV, Kaelber D, Lazbin M, Polyshchuk VV, Roy DL: New tool to identify Still's murmurs. Pediatric Academic Societies Annual Meeting [http://www.bsignetics.com/papers/PASStillsMur mur.pdf]. 2006 April 29–May 2
40. Polyshchuk VV, Kudriavtsev VV: Cardiovascular sound signature: method, process and format. USPTO Application, 2005; 0222515. Assignee: Biosignetics Corp:1-41. (available USPTO data-base http://www.uspto.gov)
41. Polyshchuk V, Choy FK, Braun MJ: New gear-fault-detection parameter by use of joint time-frequency distribution. AIAA J of Prop and Power 2002, 16(2):340-346.
42. Polyshchuk V: Detection and quantification of the gear tooth damage from the vibration and acoustic signatures. In PhD Dissertation University of Akron; 1999.
43. Reed TR, Reed NE, Fritzson P: Heart Sound analysis for symp-tom detection and computer-aided diagnosis. Sim Mod Practice and Theory 2004, 12(2129-46 [http://www.bearcave.com/misl/ misl_tech/signal/nonstat/index.html].
44. de Bruijn NG: A theory of generalized functions, with applica-tions to Wigner distribution and Wyel correspondence. Nieuw Archief voor Wiskunde 1973, XX1(3):205-80.
45. Wigner E: On the quantum correction for thermodynamic equilibrium. Phys Rev 1932, 40:749-59 [http://en.wikipedia.org/wiki/ Wigner_quasi-probability_distribution].
46. Ville J: Theorie et applications de la notion de signal analyt-ique. Cables et Transmission 1948, 1:61-74. 2eA. (in French)
47. Messiah A: Quantum mechanics. translated by G.M. Temmer, North Holland, Amsterdam 1970, 1:50.
48. Cable CS, Ducharme NG, Hackett RP, Erb HN, Mitchell LM, Soder-holm LV: Sound signature for identification and quantification of upper airway disease in horses. Am J of Vet Res 2002, 63(12):1707-13.
49. Cohen L: Time frequency analysis. Prentice Hall, Englewood Cliffs, NJ 1995.
50. Roy DL, Hoyt B: Collection of heart sounds: EarsOn. CD Rom, CorSonics Corp, Halifax, N.S [http://www.corsonics.com].
51. Cohen L: Time-frequency distributions – a review. Proceedings of the IEEE 1989, 77(7):941-81.
52. Mertins A: Signal analysis. In Wavelets, Filter banks, Time-frequency transforms and applications John Wiley & Sons; 1999.
53. Claasen TACM, Mecklenbrauker VFG: The Wigner distribution – a tool for time-frequency signal analysis, Part I: Continuous time signals. Philips J of Res 1980, 35(3):217-250.
54. Chen VC, Ling H: Time frequency transforms for radar imag-ing and signal analysis. Artech House 2003:264 [http://air borne.nrl.navy.mil/~vchen/tftsa.html]. (page 37 for Wigner Ville, page 28 for STFT)
55. Bentley PM: Time-frequency and time-scale techniques for the classification of native and bioprosthetic heart valve sounds. IEEE Trans Biomed Eng 1998, 45(1):125-8.
56. Bsignal – Heart energy signature visualization system, Ver-sion 3.5 Product manual 2006:1-120 [http://www.biosignetics.com]. 57. Wigner quasi-probability distribution [http://en.wikipedia.org/
wiki/Wigner_quasi-probability_distribution]. Chirp test function http://en.wikipedia.org/wiki/Image:Chirpedpulse.jpg
58. Braunwald E, Antman EM, Beasley JW, et al.: ACC/AHA guideline update for the management of patients with unstable angina and non-ST-segment elevation myocardial infarction -2002: summary article: a report of the American College of Cardi-ology/American Heart Association Task Force on Practice Guidelines (Committee on the Management of Patients With Unstable Angina). Circulation 2002, 106(14):1893-900. 59. Freeman AR, Levine SA: The clinical significance of the systolic
murmur: A study of 1,000 consecutive "non-cardiac" cases. Ann Intern Med 1933, 6:1371-85.
60. Nygaard H, Thuesen L, Terp K, Hasenkam JM, Paulsens PK: Assess-ing the severity of aortic valve Stenosis by spectral analysis of cardiac murmurs (spectral vibrography). Part II: Clinical Aspects. J Heart Valve Dis 1993, 2(4):468-75.
61. Kvart C, French AT, Fuentes VL, Haggstorm J, McEwan JD, Schober KE: Analysis of murmur intensity, duration and frequency components in dogs with aortic stenosis. J Small Anim Pract 1998, 39(7):318-24.
62. Bulgrin JR, Rubal BJ, Thompson CR, Moody JM: Comparison of short-time Fourier, wavelet and time-domain analyses of int-racardiac sounds. Biomed Sci Instrum 1993, 29:465-72.


](https://thumb-us.123doks.com/thumbv2/123dok_us/9119111.1904820/8.612.122.482.85.633/figure-heart-energy-signature-hes-format-display-additional.webp)
](https://thumb-us.123doks.com/thumbv2/123dok_us/9119111.1904820/9.612.111.484.83.655/figure-energy-signature-format-innocent-murmur-details-additional.webp)

. Comparison of HES and STFT frequency resolution on the spectrogram, simulated S2 split function [see Addi-(A,B,C,D,E)](https://thumb-us.123doks.com/thumbv2/123dok_us/9119111.1904820/11.612.151.457.87.634/figure-tional-comparison-frequency-resolution-spectrogram-simulated-function.webp)