R E S E A R C H
Open Access
Classification of upper limb center-out
reaching tasks by means of EEG-based
continuous decoding techniques
Andrés Úbeda
1, José M. Azorín
1, Ricardo Chavarriaga
2*and José del R. Millán
2Abstract
Background: One of the current challenges in brain-machine interfacing is to characterize and decode upper limb kinematics from brain signals, e.g. to control a prosthetic device. Recent research work states that it is possible to do so based on low frequency EEG components. However, the validity of these results is still a matter of discussion. In this paper, we assess the feasibility of decoding upper limb kinematics from EEG signals in center-out reaching tasks during passive and active movements.
Methods: The decoding of arm movement was performed using a multidimensional linear regression. Passive movements were analyzed using the same methodology to study the influence of proprioceptive sensory feedback in the decoding. Finally, we evaluated the possible advantages of classifying reaching targets, instead of continuous trajectories.
Results: The results showed that arm movement decoding was significantly above chance levels. The results also indicated that EEG slow cortical potentials carry significant information to decode active center-out movements. The classification of reached targets allowed obtaining the same conclusions with a very high accuracy. Additionally, the low decoding performance obtained from passive movements suggests that discriminant modulations of
low-frequency neural activity are mainly related to the execution of movement while proprioceptive feedback is not sufficient to decode upper limb kinematics.
Conclusions: This paper contributes to the assessment of feasibility of using linear regression methods to decode upper limb kinematics from EEG signals. From our findings, it can be concluded that low frequency bands
concentrate most of the information extracted from upper limb kinematics decoding and that decoding performance of active movements is above chance levels and mainly related to the activation of cortical motor areas. We also show that the classification of reached targets from decoding approaches may be a more suitable real-time methodology than a direct decoding of hand position.
Keywords: Brain-computer interface, Electroencephalography, Linear decoding, Upper limb movements, Center-out reaching tasks
*Correspondence: [email protected]
2Defitech Chair in Brain-Machine Interface (CNBI), École Polytechnique Fédérale de Lausanne (EPFL), Chemin des Mines 9, CH-1202 Geneva, Switzerland
Full list of author information is available at the end of the article
Background
The possibility of bypassing neuromuscular control or, in other words, activating an alternative pathway for the brain to act upon the environment, has triggered a fasci-nating field of research. Brain-Machine Interfaces (BMIs) are devices aimed at translating subjects’ brain activity into commands [1, 2]. They enable people with motor dis-abilities to interact with their environment in a completely new way [3]. They have been used alone or in combination with other systems, such as Functional Electrical Stimu-lation (FES), prosthetic arms or hand orthoses, to restore grasping functionalities in subjects with Spinal Cord Injury (SCI), where the loss of motor function is perma-nent [4]. Moreover, BMIs have become a promising tool in rehabilitation procedures where patients have movement limitations or difficulties to control their limb function [5–7]. Particularly, motor impairment after stroke is one of the main causes of permanent disability. This section of the population usually suffers from upper limb move-ment limitations and the recovery of the arm movemove-ment is often variable and incomplete [8]. This recovery is cru-cial in order to perform activities of the daily life, so the use of BMIs during the rehabilitation may be a key factor of improvement [3].
Currently, one of the main challenges of BMIs is to char-acterize and decode upper limb kinematics from brain signals. Up to now, decoding approaches were mainly cen-tered on intracortical recordings, usually performed in non-human primates, where arrays of microelectrodes are implanted directly in the motor cortex. In some studies, the motor cortical activity of monkeys was used to per-form reaching and grasping activities with a robot arm [9], or to perform three dimensional movements that included force grasping for self-feeding using a mechanical device [10]. Invasive approaches have been successfully used in people with motor disabilities to perform reaching and grasping tasks [11, 12]. Less invasive procedures such as electrocorticography (ECoG) have also been used to decode two-dimensional arm trajectories [13] and differ-ent types of grasping [14]. Despite their potdiffer-ential, invasive approaches require surgery, which limits their use. In this respect, non-invasive methods can compensate the draw-backs of intracortical recordings. Some studies have used magnetoencephalographic (MEG) signals to predict hand movements to perform 2D trajectories [15]. MEG sig-nals have also been used in combination with electroen-cephalographic (EEG) signals to discriminate between different center-out movements [16]. However, the low signal-to-noise ratio of EEG signals makes it difficult to decode hand movement trajectory.
Recent works suggest that it is possible to decode hand or arm kinematics (position and velocity) from slow cortical potentials (SCPs), i.e., EEG signals oscillations below 2 Hz [17–20]. To that end, multidimensional linear
regression models are applied to the data. However, it has been pointed out that this methodology has the risk of overestimating the decoding performance due to the mathematical properties of linear regression between sig-nals in the same frequency range (in this case, slow arm movements and slow cortical potentials) [21]. Further-more, this later study states that decoding accuracies achieved with SCPs are not above chance level. A pre-vious work also proposed the use of multidimensional linear regression as the decoding method to control a cursor [22]. It reports that it is possible to accomplish a two-dimensional control of this cursor with performance levels comparable to those of invasive BMI systems. In their study, the decoding models had to be recalibrated to include a scaling factor due to the fact that the correlation metric is invariant to scale. Again, the way of how these results are assessed is still a matter of discussion [22–24], so it is necessary to gather further evidence of the real possibilities of decoding arm trajectories from EEG SCPs. In this regard, some studies have suggested the introduc-tion of electromyographic informaintroduc-tion (EMG) into this decoding procedure [25] or even the use of muscle syn-ergies activation coefficients extracted from this EMG information [26].
In this paper, we compare several results obtained by applying linear regression techniques to decode upper limb kinematics from EEG signals using a center-out reaching approach. We analyze arm movements using the same decoding approach proposed in previous stud-ies [17]. The results show that arm movement decoding was significantly above chance levels. Moreover, we have analyzed passive arm movements using the same proto-col to study if the neural information for decoding was related to the execution of movement, instead of being linked to proprioceptive feedback. The final decoding per-formance obtained from our study suggests that, although neural correlates can be decoded when performing upper limb movements, the decoding accuracy may not be high enough to perform a real-time control of a cursor in a 2D environment and the method is also subject to the scaling limitations. As a consequence, we also evaluated the clas-sification of the reached targets which yielded a very high classification accuracy. From these findings, it appears that the a classification of reached targets from decoding approaches may be a more suitable real-time method-ology for rehabilitation purposes (where movements are often repetitive) than a direct decoding of hand position.
Methods
Experimental tests
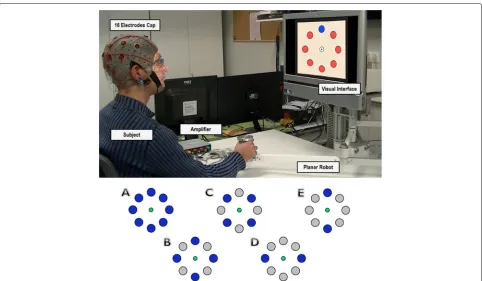
Fig. 1Experimental Environment.Top, experimental setup. The subject performs the center-out movements in front of a screen showing the cursor and target locations. The subject is asked to reach the highlighted targets with the planar manipulandum.Bottom, different configuration of possible targets have been analyzed to compare the performance of target decoding. ConfigurationAcovers all the targets shown. For configurationsBandC, 4 targets are taken into account in the analysis. Finally, configurationsDandEcorrespond to a discrimination between two opposite target directions
were recorded along with the position and velocity of the cursor. Two different experiments were performed:
• Active center-out movement: subjects control the cursor movement using a planar manipulandum (see Fig. 1, top). The goal is to reach the target that is randomly highlighted on the screen. The subject must reach it and then return to the central position. Targets are distributed around this central position in a circumference with a radius of 10 cm. Each time a target is reached or the cursor enters the central position, a waiting period of 400 ms is introduced. Each subject executed 10 runs in which 40 targets were randomly highlighted (around 3 minutes per run). All reaching positions were equally highlighted (each of them 5 times per run). 5 able-bodied subjects (B1-B5)(26.4±3.1year-old) performed the tests. 16 electrodes were recorded distributed over the central and parietal cortex, where a higher activity related to arm movements is expected. The equipment used was the gUSBamp (g.Tec, GmbH, Austria) with a sampling frequency of 1200 Hz. The reference was placed on the right earlobe and ground was placed on the AFz position.
• Passive center-out movement: subjects are asked to passively grasp the planar manipulandum while the researcher operates it. The experimental tests are the same as with the active center-out movement. Subjects carried out 5 runs in which 40 targets were randomly highlighted (around 3 minutes per run). All reaching positions were equally highlighted (each of them 5 times per run). 5 able-bodied subjects (C1-C5)(25.2±2.6year-old) performed the tests. Only one subject performed the experiments for both active (B1) and passive (C1) movements.
EEG human recordings used in this study have been approved by the ethics committee of the Miguel Hernández University of Elche, Spain. Written consent according to the Helsinki declaration was obtained from each subject.
Preprocessing
FC6, C3, Cz, C4, CP5, CP1, CP2, CP6, P3, Pz, P4, PO3 and PO4. According to previous literature, neural corre-lates of movement kinematics are mainly found in SCPs above 0.1 Hz [27]. As a consequence, EEG signals were band-pass filtered with a zero-phase 4th-order Butter-worth filter between 0.1–2 Hz. For comparison purposes they were also filtered between 8–12 Hz, 14–30 Hz and 0.1–40 Hz, to estimate the amount of information present in each frequency band, similar to the study performed by Antelis et al. [21]. Cursor kinematics (position and speed) were also low-pass filtered with a zero-phase 4th-order Butterworth filter below 2 Hz. Finally, for each run, EEG data from each electrodeiwere standardized by subtract-ing, for each time sample (t), the mean (V¯i) of the signal and dividing the result by the standard deviation (SDVi) as shown in (1).
EVi[t]= Vi[t]− ¯Vi
SDVi
(1)
Decoding
A multidimensional linear regression was applied to decode kinematics from EEG signals,
x(t)=a+
N
n=1 L
k=0
bnkSn(t−k) (2)
wherex[t] is the kinematics state (position and velocity) at timetandSnis the signal from channeln.Lcorresponds to the number of lags andN to the number of channels. The decoding parameters,aandb, were estimated using a cross-fold validation for both the active movement condi-tion (ten folds) and the passive movement condicondi-tion (five folds). The values for the parametersLandNare:L=10 (around 80 ms of signal) andN=16 (central and occipital electrodes uniformly distributed).
To simplify the process, the matrix form of (2) has been used as follows:
X[4×1]=B[4×NF]∗S[NF×1]+A[4×1] (3)
whereXis the kinematic state [PxPyVxVy],Bis the trans-formation matrix, S is the features array,A is the scale matrix and NF is the number of features used which depends on the time lagLand the number of channelsN (NF=L∗N+1).
Analysis
Movement profiles
We report the speed profiles (mm/second) for each sub-ject and movement condition (active and passive move-ments). To that end, the average speed for each point in the trajectory (from the central position to the corre-sponding target) has been computed for each reaching
movement, normalized in length and averaged between all trials for each subject and condition. Speed was con-sidered negative when the direction of movement was negative regarding the considered axis. For instance, this means that when the subject was approaching hori-zontally to a target on his/her left, his/her speed was computed as a negative value, and when he/she was mov-ing to the opposite direction, speed was computed as a positive value.
Continuous decoding
For the continuous decoding, the matrices B and A in (3) were obtained using a cross-fold validation (10 folds). For each fold, the training data was used to compute the decoding matrices that are then applied to the test data to obtain the decoded kinematics. We computed the Pearson correlation coefficient between the real and decoded kine-matics for each testing fold and reported the performance in terms of average correlation. The results have been compared for different ranges of frequencies (0.1–2 Hz, 8–12 Hz, 14–30 Hz and 0.1–40 Hz). Additionally, shuffled and random data have been used as input to assess if the decoding accuracy was above chance levels. Shuffled data was obtained by randomly mixing target labels of real data and the associated kinematics to keep the temporal struc-ture of the EEG signals in a way equivalent to [21, 28, 29]. Random data was generated as a standard uniform noise with the same size of real input data. Both shuffled and random data were filtered and standardized in the same way as the actual experimental data. Random and shuf-fled data decoding coefficients were computed 1000 times to avoid chance effects due to the stochastic nature of the process.
Classification of reached targets
was assigned to the nearest target. As before, shuffled and random data were used to estimate chance levels.
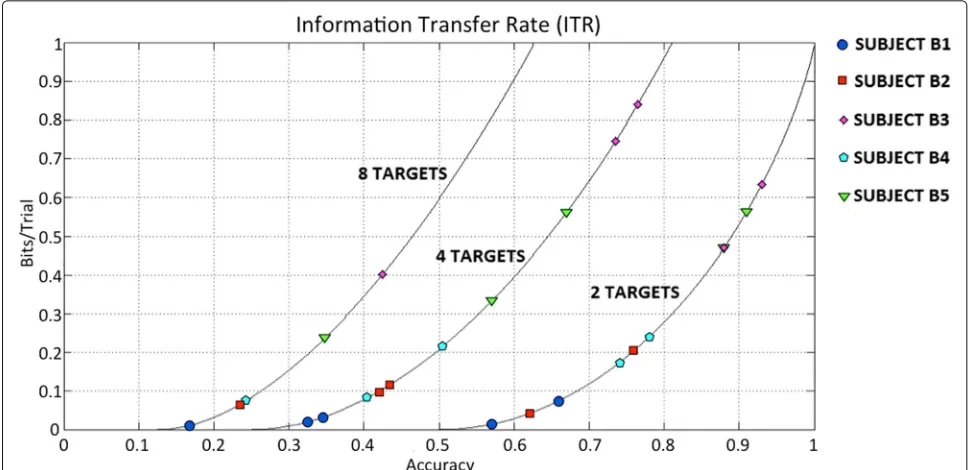
We also assessed the performance through the estima-tion of the classificaestima-tion confusion matrices and the infor-mation transfer rates. Firstly, confusion matrices have been computed for each configuration and subject to show the extent of misclassification. Secondly, Informa-tion Transfer Rates (ITRs) have been computed for the average classification rates obtained by each subject for the different target configurations according to the follow-ing equation (for further information see [30]):
ITR=log2N+Plog2P+(1−P)log2 1−P
N−1 (4)
where N is the number of classified targets and P is the accuracy of the classification
ITR values have been plotted over the ITR curves obtained for 2, 4 and 8 classified targets to better show the performance of each subject.
Results
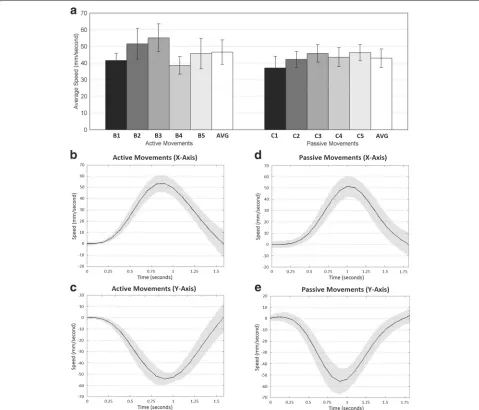
Movement profiles
Figure 2a reports the average speed of the reaching move-ments for the active and passive conditions. It shows com-parable velocities for both conditions (averaged: 46.49± 9.73 mm/s for the active movements and 42.93 ± 6.44 mm/s for the passive movements). For the passive exper-iments, the same researcher performed the movements
for all subjects, which may explain the reduced variabil-ity with respect to the active condition where subjects performed the movements by themselves.
Figure 2b–e shows the average time courses of the X and Y hand speed for an exemplary subject (B1, active movements, and C1, passive movements) and direction (bottom-right target) showing the expected initial acceler-ation and final deceleracceler-ation for both conditions.
Continuous decoding
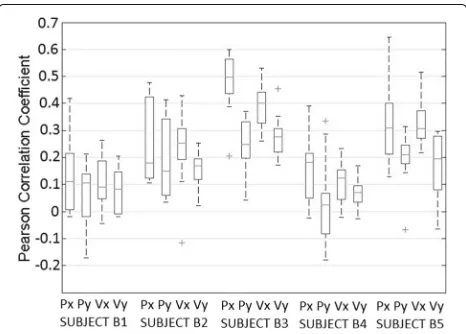
The Pearson correlation coefficient has been obtained after computing a cross-fold validation between all runs for each subject. Figure 3 shows the Pearson correlation coefficients obtained while performing center-out move-ments when decoding signals in the frequency band 0.1–2 Hz. The results show high decoding correlations (Fig. 3). Particularly, subjects B3 and B5 obtain the best decoding accuracy with some components reaching a value of 0.5.
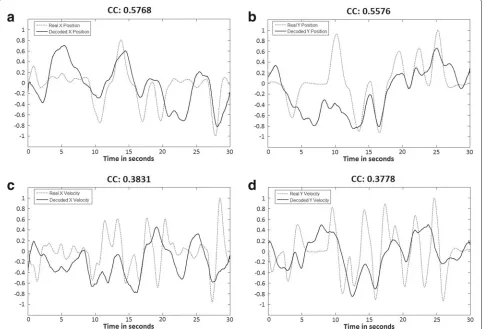
Figure 4 shows an example of 30 s of kinematic recon-struction (2D position and velocity) for one of the subjects performing active movements. In this particular example, decoding coefficients above 0.5 show an accurate recon-struction of the performed trajectories (X Position and Y Position). When the decoding correlation decreases (X Velocity, Y Velocity), the reconstructed signal preserves its tendency but reduces its accuracy.
Previous studies have claimed that upper limb kine-matics are better reconstructed from low frequency EEG signals [17, 19, 21]. We tested this hypothesis by analyz-ing the decodanalyz-ing performance usanalyz-ing the signal in four
Fig. 3Continuous decoding performance. Decoding performance of center-out trajectories for the frequency band 0.1–2 Hz. The boxplot represents the Pearson correlation coefficient obtained after computing a cross-fold validation between all runs (n=10). On each box, the central mark is the median, the edges of the box are the 25th and 75th percentiles, the whiskers extend to the most extreme datapoints which are considered not outliers, and the outliers are plotted individually. For each subject (1–5) the graph shows results for position (Px and Py) and velocity (Vx and Vy)
different frequency bands: 0.1–2 Hz (SCPs), 8–12 Hz (alpha band), 14–30 Hz (beta band) and 0.1–40 Hz (Fig. 5). In agreement with these studies, our analysis showed that decoding correlations of higher frequency bands were close to zero and that the low frequency band (0.1–2 Hz) yielded the best decoding accuracies (Fig. 5). Decod-ing performance usDecod-ing SCPs was slightly but not signif-icantly above results obtained with a broader frequency band (0.1–40 Hz) that includes the irrelevant higher frequencies.
To estimate the significance of our findings, the decod-ing approach was tested with random and shuffled data and compared with the results for active movement (Fig. 6). Active movement was decoded significantly above chance level for all kinematic components (p < 0.001, Wilcoxon Sum-Rank Test)(Fig. 6). Also, the decoding per-formance of error and shuffle conditions was not sig-nificant (p > 0.05, Wilcoxon Signed-Rank Test). These findings differ from a previous study [21], where the corre-lations and normalized errors of the results of real models were not statistically different from shuffled and random models, but are similar to what is obtained in several works related to the topic [20, 28, 29]. This discrepancy could be due to the nature of the experimental data or the way EEG data were processed. However, the results obtained in most of the previous works suggest that decoding performance is significant when linear decoders are applied to slow cortical potentials.
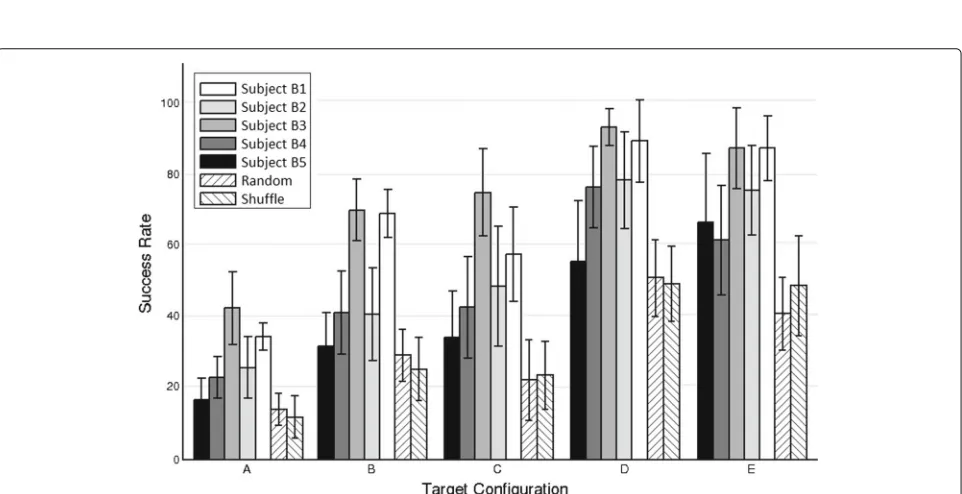
Classification of reached targets
Figure 7 shows the success rate of targets correctly clas-sified after computing a cross-fold validation between all runs recorded for center-out movements. For each subject the graph shows the five different target configurations proposed (Fig. 1, bottom). The results yield a high perfor-mance for all the configurations (averaged: 29.0%±11.8% for configuration A, 51.3%±19.2% for configuration B, 52.3%±20.5% for configuration C, 79.6%±15.9% for con-figuration D and 75.6%±17.0% for configuration E). As expected, the performance of each subject in the decod-ing is consistent with the results in the continuous case. Unsurprisingly, subjects B3 and B5, who obtained the best decoding accuracies in the continuous approach, also had the highest success rates. The success rate obtained in the classification of two targets (configurations D and E) is particularly remarkable (subject B3, 93.0%±6.7% and subject B5, 89.0%±11.0% for configuration D; and sub-ject B3, 88.0%±11.3% and subject B5, 87.0%±9.4% for configuration E).
Fig. 4Example of decoded kinematics. Continuous decoding of kinematics using the linear regression decoding method (Subject 3 - Active Center-out Movement). The grey dotted line represents the real performed movement. The continuous black line represents the decoded kinematics (aX Position,bY Position,cX Velocity,dY Velocity). The correlation coefficient (CC) obtained from the correlation of both signals is also shown
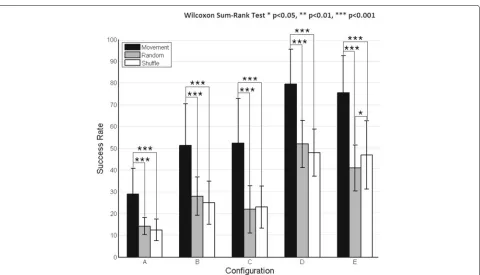
classification of targets was computed for shuffled data and random data in the same way as for the continu-ous decoding and compared with active movement results (Fig. 8). The results show that the decoding of active movements was significantly above chance level for all configurations (p<0.001, Wilcoxon Sum-Rank Test).
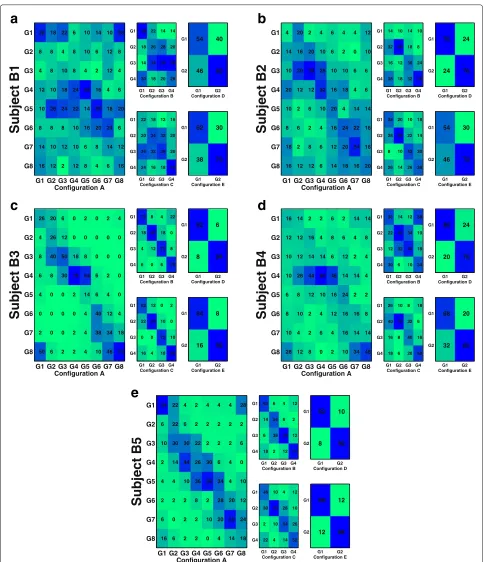
Confusion matrices show that misclassification is mainly focused on the targets closest to the classified tar-get (Fig. 9), suggesting that the classification method is quite robust. This is particularly visible in subjects B3 and B5, who obtained the best decoding accuracies. Consis-tently, when analyzing information transfer rates (ITRs), subjects B3 and B5 obtain the highest ITRs (Fig. 10). Rates are remarkably high (over 0.5 bits/trial) for configurations B to E. For the remaining subjects and, in general, for configuration A (8 targets), ITR is usually lower.
Decoding passive movement
The results obtained from the decoding of active center-out movement were significantly above chance level. One possible explanation for these results is that decoding is
driven by the influence of proprioceptive sensory feed-back while reaching each of the targets instead of reflect-ing neural correlates of motor intention. To study the influence of afferent feedback in the decoding, we per-formed a second experiment using passive movements. This new data set was then analyzed the same way as the previous data (decoding of low frequency components 0.1–2 Hz).
Fig. 5Frequency analysis. Comparison between different frequency bands: 0.1–2 Hz (low frequencies), 8–12 Hz (alpha band), 14–30 Hz (beta band) and 0.1–40 Hz. The boxplot represents the Pearson correlation coefficient obtained after computing a cross-fold validation between all runs (n=10) for each subject and then averaged between subjects (n=5). On each box, the central mark is the median, the edges of the box are the 25th and 75th percentiles, the whiskers extend to the most extreme datapoints which are considered not outliers, and the outliers are plotted individually. Position (Px and Py) and velocity (Vx and Vy) are shown for different experimental data: center-out movements (a), shuffled data (b) and random data (c)
kinematic components (X Position, Y Position, X Veloc-ity and Y VelocVeloc-ity)(p < 0.001, Wilcoxon Sum-Rank Test, Fig. 12a) and the success rate was significantly above the levels of passive movements for all configurations (p < 0.001, Wilcoxon Sum-Rank Test, Fig. 12b).
Discussion
This paper contributes to the assessment of the use of lin-ear regression methods to decode upper limb kinematics from EEG signals. Previous work states that it is possible to decode hand or arm kinematics (position and velocity) from slow cortical potentials, i.e., EEG signals below 2 Hz [17–20]. However, these results may have been misinter-preted due to the inherent properties of linear regression
methods, particulary, when comparing EEG signals with the same frequency range as the decoded kinematics [21]. To confirm or reject this conclusion, we have applied a similar methodology to experimental data during the per-formance of active and passive center-out movements in a two dimensional space.
Fig. 6Continuous decoding significance. Decoding performance of center-out trajectories comparing different experimental data: active center-out movement, shuffled data and random data. The Pearson correlation coefficient (mean±STD) is obtained after computing a cross-fold validation between all runs (n=10) and then averaged between subjects (n=5). The graph shows results for position (Px and Py) and velocity (Vx and Vy) and reflects differences of active center-out movement versus random and shuffled data. The stars represent significant differences with respect to random and shuffle conditions
Fig. 8Classification significance. Classification of center-out trajectories comparing different experimental data: center-out movement, shuffled data and random data. The success rate of targets correctly classified (mean±STD) is obtained after computing a cross-fold validation between all runs (n=10) and then averaged between subjects (n=5). Each graph shows results for all the different target configurations: A-E (see Fig. 1) and reflects differences of center-out movement versus random and shuffled data
modulations of neural activity. Our results and the exper-imental protocols we have explored do shed light on the nature of the SCPs if interpreted rigorously. On the one hand, compared to the active movements, passive move-ments differ in that the CNS does not need to compute the detailed trajectory of the arm. However, neural correlates of proprioceptive sensory feedback are still present. Nev-ertheless, our results show that passive movements cannot be decoded from SCPs suggesting that there is little influ-ence of proprioceptive feedback in the decoding. The velocity profiles of the movements performed for both conditions are similar suggesting this should not influ-ence the final decoding performance. Shuffle and random conditions show residual correlations which do not yield appropiate trajectory reconstruction and could be again a consequence of the correlation metrics. However, with this small sample size, caution must be applied and further evaluation should be performed using larger datasets.
The decoding accuracies are lower than those reported in a recent work [22], where the authors state that it is pos-sible to accomplish a two-dimensional real time control of a cursor with performance levels comparable to those of invasive BMI systems. In this case, decoding performance is also subject to scaling limitations. For these reasons, we have proposed a simplification of the method by com-puting a classification of reached targets (discretization of
the continuous decoding). This kind of approach has been also explored in several works [16, 31, 32]. In our case, the results have shown high success rates for different target configurations, presenting a clear consistency with the previously obtained decoding performance for con-tinuous movements. These results are quite encouraging and suggest that an online application of this method-ology may provide an accurate identification of upper limb movement intention. By reducing the dimensional-ity of the classification output, this classification approach presents promising advantages in future neurorehabilita-tion procedures, where EEG slow cortical potentials could be exploited to classify arm movement directions [33] and even detect movement onset [34]. This again corrob-orates the trajectory-encoding features of the SCPs for the active condition. Regarding rehabilitation assistance, a classification of reached targets may be more suit-able as rehabilitation therapy is often based on repetitive movements [35].
28 8 4 12 10 8 14 16 18 8 8 10 26 8 10 12 22 4 10 18 24 8 12 2 6 8 8 24 22 10 10 12 10 10 4 32 14 16 6 8 14 6 2 16 30 20 8 4 10 12 12 4 18 24 14 6 28 8 4 6 20 6 12 16 Configuration A
Subject B1
G1 G2 G3 G4 G5 G6 G7 G8 G1 G2 G3 G4 G5 G6 G7 G8 38 18 14 30 22 26 34 18 14 28 38 20 14 20 38 28 Configuration B G1 G2 G3 G4 G1 G2 G3 G4 22 20 34 24 18 34 32 16 12 32 38 18 16 20 20 44 Configuration C G1 G2 G3 G4 G1 G2 G3 G4 54 46 40 60 Configuration D G1 G2 G1 G2 62 38 30 70 Configuration E G1 G2 G1 G2 4 14 10 20 10 8 18 16 20 16 30 12 2 6 2 12 2 20 38 12 6 2 8 12 4 10 28 32 10 4 6 6 6 6 10 16 20 16 12 14 4 2 10 18 4 24 20 18 4 0 6 4 14 22 34 16 12 10 6 6 14 16 16 20 Configuration A
Subject B2
G1 G2 G3 G4 G5 G6 G7 G8 G1 G2 G3 G4 G5 G6 G7 G8 14 32 16 38 10 60 12 18 14 18 36 32 10 8 24 58 Configuration B G1 G2 G3 G4 G1 G2 G3 G4 38 28 8 26 20 56 10 14 10 22 42 26 18 14 30 38 Configuration C G1 G2 G3 G4 G1 G2 G3 G4 76 24 24 76 Configuration D G1 G2 G1 G2 54 46 30 70 Configuration E G1 G2 G1 G2 26 4 8 6 4 0 2 50 20 26 40 8 0 0 0 6 6 12 50 30 0 0 0 2 0 0 18 76 2 0 2 2 2 0 8 64 14 4 4 4 0 0 0 6 6 40 38 10 2 0 0 2 4 12 34 46 4 0 0 0 0 4 18 74 Configuration A
Subject B3
G1 G2 G3 G4 G5 G6 G7 G8 G1 G2 G3 G4 G5 G6 G7 G8 72 18 4 6 8 80 12 0 4 18 72 6 22 0 8 70 Configuration B G1 G2 G3 G4 G1 G2 G3 G4 62 22 0 16 12 84 0 4 0 10 72 18 2 0 10 88 Configuration C G1 G2 G3 G4 G1 G2 G3 G4 92 8 6 94 Configuration D G1 G2 G1 G2 84 16 8 92 Configuration E G1 G2 G1 G2 16 12 10 10 6 8 10 28 14 12 12 28 8 10 4 12 2 16 14 44 12 2 2 8 2 4 14 60 10 4 6 0 6 8 6 46 16 12 4 2 2 6 12 14 24 16 16 10 14 4 2 14 2 16 14 34 14 8 4 4 2 8 14 46 Configuration A
Subject B4
G1 G2 G3 G4 G5 G6 G7 G8 G1 G2 G3 G4 G5 G6 G7 G8 36 22 12 30 14 48 32 6 12 34 44 10 38 10 18 34 Configuration B G1 G2 G3 G4 G1 G2 G3 G4 26 40 16 18 10 76 8 6 8 32 40 20 18 6 16 60 Configuration C G1 G2 G3 G4 G1 G2 G3 G4 80 20 24 76 Configuration D G1 G2 G1 G2 68 32 20 80 Configuration E G1 G2 G1 G2 54 6 10 2 4 2 6 16 22 22 30 14 4 2 0 6 4 6 30 44 10 2 2 2 2 2 22 26 36 8 2 2 4 2 2 30 50 2 10 0 4 2 2 6 34 28 20 4 4 2 2 4 4 20 50 14 28 2 6 0 10 12 24 18 Configuration A
Subject B5
G1 G2 G3 G4 G5 G6 G7 G8 G1 G2 G3 G4 G5 G6 G7 G8 62 14 6 18 6 54 38 2 4 6 78 12 12 2 12 74 Configuration B G1 G2 G3 G4 G1 G2 G3 G4 46 30 2 22 10 76 10 4 4 28 54 14 12 10 26 52 Configuration C G1 G2 G3 G4 G1 G2 G3 G4 92 8 10 90 Configuration D G1 G2 G1 G2 88 12 12 88 Configuration E G1 G2 G1 G2
a
c
b
d
e
Fig. 10Information Transfer Rates (ITRs). ITRs were computed from average classification rates for all subjects (B1-B5) and number of targets. Base curves represent the whole range of ITR for 2, 4 and 8 classes (targets)
over 10 Hz [36]. Contrary to this, most of the stud-ies that deal with corticomuscular coherence show that EEG signals are generally coupled with EMG at higher rates (beta and gamma bands), which, apparently, has no functional meaning [37, 38]. One interesting point would be to assess if high-frequency oscillations are modulated at a slower rate and, thus, carry information of func-tional motor cortical inputs, which could explain those
findings in corticomuscular coherence. This behavior of high-frequency cortical components could also explain functional modulations of alpha (8-12 Hz) and beta (16-30 Hz) bands, widely used in classical BCI-based protocols, such as motor imagery. Another interesting point would be the evaluation of which bands provide more informa-tion before the movement (planificainforma-tion) and during the movement (execution).
Fig. 12Passive vs active decoding. Continuous decoding of center-out trajectories (a) and classification of reached targets (b) comparing active center-out movement and passive center-out movement. For the continuous decoding, the Pearson correlation coefficient (mean±STD) is obtained after computing a cross-fold validation between all runs (n=10 for active andn=5 por passive) and then averaged between subjects (n=5). The results for position (Px and Py) and velocity (Vx and Vy) are displayed. For the classification of reached targets, the success rate of targets correctly classified (mean±STD) is obtained after computing a cross-fold validation between all runs (n=10 for active andn=5 por passive) and then averaged between subjects (n=5). The results of five different target configurations (see Fig. 1) are displayed
Conclusion
The main goal of this study was to shed light to the con-troversy of current decoding procedures. For this reason, we have replicated the same core methodologies of pre-vious studies [17, 21, 22], i. e., multidimensional lineal regression applied to center-out reaching tasks. We have found significant decoding performance when applying these linear decoders to slow cortical potentials (0.1-2 Hz). However, decoding performance is subject to scal-ing limitations and there is also variability on the decoded trajectory. For this reason, we have proposed a more reliable way of decoding subject’s motor execution from the continuous decoding of trajectories (classification of reached targets) aiming at a future application in a rehabil-itation context. Additional control experiments (passive reaching tasks) have been assessed to show that proprio-ceptive feedback has little influence in the decoding, sug-gesting that discriminant modulations of low-frequency neural activity are mainly related to the execution of movement.
Abbreviations
BMI: Brain-machine interface; CNS: Central nervous system; EEG: Electroencephalography; ECoG: Electrocorticography; EMG: Electromyography; FES: Functional electrical stimulation; MEG:
Magnetoencephalography; SCI: Spinal cord injury; SCP: Slow cortical potential
Acknowledgements Not applicable.
Funding
This research has been funded by the Brain2Motion project through grant DPI2011-27022-C02-01 of Ministerio de Economía y Competitividad of Spain and by Conselleria d’Educació, Cultura i Esport of Generalitat Valenciana of Spain through grants VALi+d ACIF/2012/135 and BEFPI/2013/043. R. Chavarriaga and J.d.R. Millán are supported by the Swiss-funded SNSF NCCR Robotics.
Availability of data and materials
All data are available upon request to the following email address: [email protected].
Authors’ contributions
AU and JMA conceived the study. AU designed the experiment, performed the recordings and analyzed the data. AU, RC and JdRM interpreted the results. All authors participated in the drafting of the manuscript. All authors read and approved the final manuscript.
Competing interests
The authors declare that they have no competing interests. Consent for publication
Not applicable.
Ethics approval and consent to participate
EEG human recordings used in this study have been approved by the ethics committee of the Miguel Hernández University of Elche, Spain. Written consent according to the Helsinki declaration was obtained from each subject. Author details
1Brain-Machine Interface Systems Lab, Miguel Hernández University, Av. de la Universidad, S/N, 03202 Elche, Spain.2Defitech Chair in Brain-Machine Interface (CNBI), École Polytechnique Fédérale de Lausanne (EPFL), Chemin des Mines 9, CH-1202 Geneva, Switzerland.
References
1. Nicolelis MAL. Actions from thoughts. Nature. 2001;409:403–7. 2. Millán JdR, Rupp R, Müller-Putz GR, Murray-Smith R, Giugliemma C,
Tangermann M, et al. Combining brain-computer interfaces and assistive technologies: state-of-the-art and challenges. Front Neurosci. 2010;4(161):. 3. Mak J, Wolpaw JR. Clinical applications of brain-computer interfaces:
current state and future prospects. IEEE Rev Biomed Eng. 2010;2:187–99. 4. Pfurtscheller G, Müller GR, Pfurtscheller J, Gerner HJ, Neuper C.
Thought-control of functional electrical stimulation to restore hand grasp in a patient with tetraplegia. Neurosci Lett. 2003;351:33–6.
5. Pfurtscheller G, Müller-Putz GR, Scherer R, Neuper C. Rehabilitation with brain-computer interface systems. Computer. 2008;41(10):58–65. 6. Caria A, Weber C, Brötz D, Ramos A, Ticini LF, Gharabaghi A, et al.
Chronic stroke recovery after combined BCI training and physiotherapy: A case report. Psychophysiology. 2011;48(4):578–82.
7. Ramos-Murguialday A, Broetz D, Rea M, Läer L, Yilmaz O, Brasil FL, et al. Brain-machine interface in chronic stroke rehabilitation: A controlled study. Ann Neurol. 2013;74(1):100–8.
8. Duncan PW, Goldstein LB, Matchar D, Divine GW, Feussner J. Measurement of motor recovery after stroke. Outcome assessment and sample size requirements. Stroke. 1992;23:1084–9.
9. Carmena JM, Lebedev MA, Crist RE, O’Doherty JE, Santucci DM, Dimitrov DF, et al. Learning to control a brain-machine interface for reaching and grasping by primates. PLoS Biol. 2003;1(2):E42. 10. Velliste M, Perel S, Spalding MC, Whitford AS, Schwartz ABT. Cortical
control of a prosthetic arm for self-feeding. Nature. 2008;453:1098–101. 11. Hochberg LR, Bacher D, Jarosiewicz B, Masse NY, Simeral JD, Vogel J, et
al. Reach and grasp by people with tetraplegia using a neurally controlled robotic arm. 485. 2012372–5.
12. Collinger JL, Wodlinger B, Downey JE, Wang W, Tyler-Kabara EC, Weber DJ, et al. High-performance neuroprosthetic control by an individual with tetraplegia. The Lancet. 2013;381(9866):557–64.
13. Schalk G, Kubanek J, Miller KJ, Anderson NR, Leuthardt EC. Decoding two-dimensional movement trajectories using electrocorticographic signals in human. J Neural Eng. 2012;4:264–75.
14. Pistohl T, Schulze-Bonhage A, Aertsen A, Mehring C, Ball T. Decoding natural grasp types from human ECoG. Neuroimage. 2012;59(1):248–60. 15. Georgopoulos AP, Langheim FJ, Leuthold AC, Merkle AN.
Magnetoencephalographic signals predict movement trajectory in space. Exp Brain Res. 2005;167:132–5.
16. Waldert S, Preissl H, Demandt E, Braun C, Birbaumer N, Aertsen A, et al. Hand movement direction decoded from MEG and EEG. J Neurosci. 2008;28(4):1000–8.
17. Bradberry TJ, Gentili RJ, Contreras-Vidal JL. Reconstructing three-dimensional hand movements from non-invasive electroencephalographic signals. J Neurosci. 2010;30(9):3432–7. 18. Agashe HA, Contreras-Vidal JL. Reconstructing hand kinematics during
reach to grasp movements from electroencephalographic signals. Intl Conf IEEE EMBS. 2011;5444–7.
19. Ofner P, Müller-Putz GR. Decoding of velocities and positions of 3D arm movement from EEG. Intl Conf IEEE EMBS. 2012;6406–9.
20. Úbeda A, Hortal E, Iáñez E, Perez-Vidal C, Azorín JM. Assessing movement factors in upper limb kinematics decoding from EEG signals. PLoS ONE. 2015;10(5):e0128456.
21. Antelis JM, Montesano L, Ramos-Murguialday A, Birbaumer N, Minguez J. On the usage of linear regression models to reconstruct limb kinematics from low frequency EEG signals. PLoS ONE. 2013;8(4):e61976. 22. Bradberry TJ, Gentili RJ, Contreras-Vidal JL. Fast attainment of computer cursor control with noninvasively acquired brain signals. J Neural Eng. 2011;8(3).
23. Poli R, Salvaris M. Comment on “Fast attainment of computer cursor control with noninvasively acquired brain signals”. J Neural Eng. 2011;8(5). 24. Bradberry TJ, Gentili RJ, Contreras-Vidal JL. Reply to comment on “Fast
attainment of computer cursor control with noninvasively acquired brain signals”. J Neural Eng. 2011;8(5).
25. Choi K. Reconstructing four joint angles on the shoulder and elbow from noninvasive electroencephalographic signals through electromyography. Front Neurosci. 2013;7:190.
26. Beuchat NJ, Chavarriaga R, Degallier S, Millán JdR. Offline decoding of upper limb muscle synergies from EEG slow cortical potentials. Intl Conf IEEE EMBS. 2013;3594–7.
27. Garipelli G, Chavarriaga R, Millán JdR. Single trial analysis of slow cortical potentials: a study on anticipation related potential. J Neural Eng. 2013;10(3):036014.
28. Agashe HA, Paek AY, Zhang Y, Contreras-Vidal JL. Global cortical activity predicts shape of hand during grasping. Front Neurosci. 2015;9:121. 29. Bhagat NA, Venkatakrishnan A, Abibullaev ArtzEJ, Yozbatiran N, Blank
AA, et al. Design and optimization of an EEG-based brain machine interface (BMI) to an upper-limb exoskeleton for stroke survivors. Front Neurosci. 2016;10:122.
30. Obermaier B, Neuper C, Guger C, Pfurtscheller G. Information transfer rate in a five-classes brain-computer interface. IEEE Trans Neural Syst Rehabil Eng. 2001;9(3):283–8.
31. Hammon PS, Makeig S, Poizner H, Todorov E, de Sa VR. Predicting reaching targets from human EEG. IEEE Signal Process Mag. 2008;25: 69–77.
32. Robinson N, Guan C, Vinod AP, Ang KK, Tee KP. Multi-class EEG classification of voluntary hand movement directions. J Neural Eng. 2013;10(5):056018.
33. Lew E, Chavarriaga R, Silvoni S, Millán JdR. Single trial prediction of self-paced reaching directions from EEG signals. Front Neurosci. 2014;8:222. 34. Lew E, Chavarriaga R, Silvoni S, Millán JdR. Detection of self-paced
reaching movement intention from EEG signals. Front Neuroeng. 2012;5:13. 35. Takeuchi N, Izumi SI. Rehabilitation with poststroke motor recovery: A
review with a focus on neural plasticity. Stroke Res Treatment. 2013;2013: 128641.
36. Farina D, Negro F. Common synaptic input in motor neurons, motor unit synchronization, and force control. Exerc Sport Sci Rev. 2015;43(1):23–33. 37. Gwin JT, Ferris DP. Beta- and gamma-range human lower limb
corticomuscular coherence. Front Neurosci. 2012;6:258.
38. Ushiyama J, Masakado Y, Fujiwara T, Tsuji T, Hase K, Kimura A, Ushiba J. Contraction level-related modulation of corticomuscular coherence differs between tibialis anterior and soleus muscles in humans. J Appl Physiol. 2012;112:1258–67.
• We accept pre-submission inquiries
• Our selector tool helps you to find the most relevant journal
• We provide round the clock customer support
• Convenient online submission
• Thorough peer review
• Inclusion in PubMed and all major indexing services
• Maximum visibility for your research
Submit your manuscript at www.biomedcentral.com/submit