R E S E A R C H
Open Access
Nerve excitation using an
amplitude-modulated signal with kilohertz-frequency
carrier and non-zero offset
Leonel E. Medina
1and Warren M. Grill
1,2,3,4*Abstract
Background:Incorporating kilohertz-frequency signals in transcutaneous electrical stimulation has been proposed as a means to overcome the impedance of the skin, thereby reaching deeper nerves. In particular, a transdermal amplitude modulated signal (TAMS), composed of a 210 kHz non-zero offset carrier modulated by rectangular pulses, was introduced recently for the treatment of overactive bladder. However, the contribution of the components of TAMS to nerve fiber activation has not been quantified.
Methods:We conducted in vivo experiments and applied direct stimulation to the sciatic nerve of cats and rats. We measured electromyogram and compound action potential activity evoked by pulses, TAMS and modified versions of TAMS in which we varied the size of the carrier.
Results:Nerve fiber activation using TAMS showed no difference with respect to activation with conventional pulse for carrier frequencies of 20 kHz and higher, regardless the relative amplitude of the carrier. For frequencies lower than 20 kHz, the offset needed to generate half of the maximal evoked response decreased significantly with respect to the pulse. Results of simulations in a computational model of nerve fiber stimulation using the same stimulation waveforms closely matched our experimental measurements.
Conclusion:Taken together, these results suggest that a TAMS with carrier frequencies >20 kHz does not offer any advantage over conventional pulses, even with larger amplitudes of the carrier, and this has implications for design of waveforms for efficient and effective transcutaneous stimulation.
Keywords:Kilohertz frequency nerve stimulation, Transdermal amplitude modulated signal, Computational
modeling, Nerve stimulation
Background
Electrical stimulation of peripheral nerves is a treatment option for dysfunction of the lower urinary tract, chronic pain, epilepsy, and other neurological disorders [1]. In many cases, stimulation of peripheral nerves is delivered via an implanted device including an electrode in prox-imity to the nerve and a pulse generator. Transcutane-ous electrical stimulation (TES) is a noninvasive alternative for peripheral nerve stimulation, in which an external electrode and stimulator deliver electrical
currents across the skin, thereby reducing the risks and costs associated with implanted devices. Kilohertz fre-quency signals have been proposed as a means to over-come the high impedance of the skin, which declines by several orders of magnitude as the frequency of stimula-tion extends to the kHz range, and thereby reach deeper structure from the skin surface [2]. For example, in interferential currents therapy, the paths of two kHz currents applied to the skin cross and generate an ampli-tude modulated signal intended to stimulate peripheral nerves [3]. Recently, a novel waveform called Transder-mal Amplitude Modulated Signal (TAMS) composed of a 210 kHz carrier modulated by rectangular pulses, was proposed for bladder control [4] and to treat overactive bladder [5]. In TAMS, the sinusoidal carrier is added to * Correspondence:warren.grill@duke.edu
1
Department of Biomedical Engineering, Duke University, Fitzpatrick CIEMAS, Room 1427, Box 90281, Durham, NC 27708-0281, USA
2Department of Neurobiology, Duke University Medical Center, Durham, NC, USA
Full list of author information is available at the end of the article
a traditional rectangular pulse of half the amplitude of the carrier, resulting in a sinusoidal burst (1 ms in dur-ation) with a non-zero mean (offset).
Preclinical studies of TAMS for bladder control via TES of the pudendal nerve in cats [4, 6] concluded that TAMS modulated bladder activity similarly to direct pudendal nerve stimulation. Both inhibitory and excitatory effects on bladder activity were evoked, depending on the fre-quency of the modulating waveform, i.e., the rate at which the pulses were delivered, consistent with prior reports on direct nerve stimulation [7]. Elkelini et al. [8] applied sacral nerve stimulation in spinally transected rats and found that TAMS reduced detrusor overactivity presum-ably by indirectly inhibiting C-fiber activity. Further, clinical studies showed that TAMS improved the symptoms and quality of life of overactive bladder patients [5, 9]. However, the mechanisms of action of TAMS, which may differ substantially from conventional low-frequency stimulation using short-duration rectangular pulses, remain largely unexplored. In particular, there is no direct comparison of the efficacy and efficiency of TAMS to conventional pulses, and the contribution of each component of the TAMS waveform to nerve excita-tion has not been determined. Moreover, both experimen-tal and computational modelling results suggest that the high-frequency carrier used in TAMS may not affect nerve excitation. Slovak et al. [10] applied TES to the forearm of healthy subjects using conventional pulses and TAMS and found no differences in sensation thresholds or EMG responses if the offset of TAMS was equal to the amplitude of the conventional pulses. Medina and Grill [11] found that TAMS and conventional pulses produced the same thresholds for activation of model nerve fibers, even though the voltages in the volume conductor, i.e., multiple layers of tissue simulating transcutaneous stimu-lation, were ~ 3–4 times larger at a certain depth from the surface for frequencies > 10 kHz as compared to lower frequencies.
In the present study, we present a simple yet definitive experiment to quantify the effects of the carrier compo-nent of TAMS signal during direct nerve stimulation, i.e., bypassing the filtering properties of the skin and underlying tissue. We conducted in vivo experiments in rats and cats to measure electromyogram (EMG) and compound action potential (CAP) responses evoked by sciatic nerve stimulation using conventional pulses, TAMS, and modified versions of TAMS with different amplitudes of the carrier relative to the pulse compo-nent of the waveform (Fig. 1). Additionally, we imple-mented a computational model of nerve stimulation and quantified activation of model nerve fibers using the same stimulation waveforms. Thresholds were largely unaffected by the amplitude of the carrier if the carrier frequency was greater than 20 kHz, and it was the pulse
component of the signal that generated nerve excitation. This quantitative assessment clarifies the contributions of the components of TAMS to nerve excitation and may be important for designing more efficient or effect-ive waveforms for transcutaneous stimulation.
Methods
Stimulation waveforms
We quantified nerve excitation with five different stimu-lation waveforms: rectangular pulse, TAMS, and three modified versions of TAMS that differed in the ampli-tude of the carrier relative to the pulse component of the waveform (Fig. 1). In addition to these five wave-forms, in the computational simulations we also used a sinusoidal burst with zero offset. Let s(t) denote the stimulation waveform andfcdenote the frequency of the carrier. TAMS and the modified versions of TAMS can be written as:
s tð Þ ¼Kð1þαsin 2ð πfctÞÞ 0≤t≤PW;
the rectangular pulse:
s tð Þ ¼K 0≤t≤PW;
and the sinusoidal burst:
s tð Þ ¼Asin 2ð πfctÞ 0≤t≤PW
wherePW is the pulse width,K is the signal offset,αis the amplitude of the carrier, and A is the amplitude of the sinusoidal burst. For TAMSα= 1, and we also used
α= 0.5, α= 2 and α= 3, termed TAMS smaller-carrier (TAMSsc), TAMS larger-carrier (TAMSlc) and TAMS Largest-carrier (TAMSLc), respectively. We note that in TAMSsc the carrier amplitude is smaller than in TAMS,
whereas in the other two modified versions the carrier amplitude is larger than in TAMS. In all experiments, we used PW= 1 ms, andK was varied to construct the input-output curves as nerve excitation as a function of stimulation amplitude.
Computational model
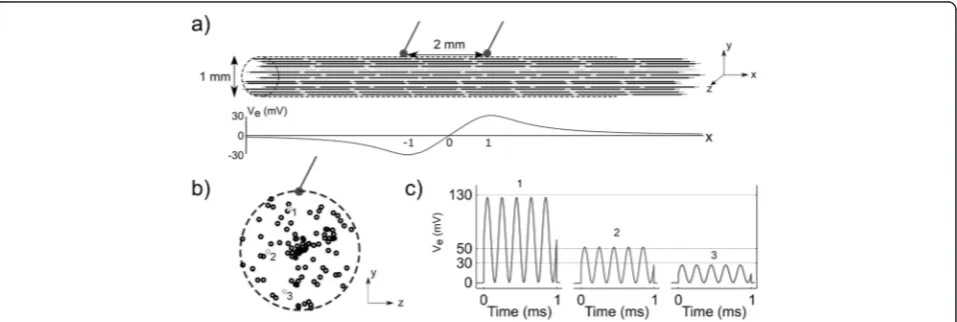
We simulated extracellular stimulation of myelinated axons using the McIntyre-Richardson-Grill (MRG) cable model of a mammalian nerve fiber [12]. All axons had a diameter of 11.5μm, representing the largest motor fibers found in the rat sciatic nerve [13]. We calculated the extracellular potentials generated by two point source electrodes of opposite polarity in an infinite anisotropic medium of conductivities 1/3 S/m in the longitudinal direction, i.e., parallel to the fibers, and 1/12 S/m in the transverse direction, i.e., perpendicular to the fibers [14]. We separated the point source electrodes by 2 mm as this separation was approximately equal to the separation of the poles of the hook electrodes used to deliver stimula-tion in the in vivo experiments. We posistimula-tioned 100 axons containing 25 nodes of Ranvier within and parallel to a 1 mm diameter cylinder, with the electrodes placed along the edge of the cylinder (Fig. 2). The radial and azimuthal coordinates of the axons axes were drawn from a uniform distribution, and the middle node was ran-domly positioned with respect to the cathode, but no further than half the internodal length. We applied the potentials to all compartments of the fiber models using the extracellular mechanism in NEURON v7.3, and we neglected axon-to-axon (i.e., ephaptic) interac-tions. We used a simulation time of 3 ms and a time step of 1μs, i.e., the sampling frequency was ten times the maximum frequency of the applied waveforms to avoid aliasing. We recorded the transmembrane potential at one
end of the model axons to detect whether an action potential was elicited.
We constructed input-output (recruitment) curves using conventional pulses, sinusoidal bursts of zero mean, TAMS and modified TAMS, by increasing K (A for the sinusoidal burst) using a step of 5μA until all model nerve fibers were activated. For the sinusoidal burst, TAMS and modified TAMS we used 7 different (carrier) frequencies: 1, 2, 5, 10, 20, 50 and 100 kHz. We defined I50as theK(A
for the sinusoidal burst) that activated half of the popula-tion, and the means and standard errors of these values across 8 different randomized populations of model nerve fibers were calculated.
In vivo experiments
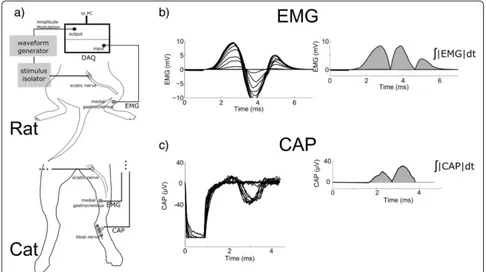
All animal care and experimental procedures were ap-proved by the Institutional Animal Care and Use Committees of Duke University. Experiments were per-formed on adult rats (n= 5) and cats (n= 3), and the procedures were acute and terminal. Rats were sedated by inhalation of isoflurane, and then anesthetized with urethane (1.2 g/kg, S.Q.), with supplemental doses (0.4 g/kg, S.Q.) given as required. Body temperature was regulated with the use of a thermostatically controlled water-circulated blanket. The sciatic nerve was exposed by dissection of the skin from the heel to the vertebral column and reflection of the biceps femoris muscle. A bipolar hook electrode was placed on the sciatic nerve near the sciatic notch to deliver stimulation. Electromyo-grams (EMG) from the medial gastrocnemius muscle were recorded using a pair of insulated fine stainless steel wires with exposed tips inserted percutaneously into the gastrocnemius musculature (Fig. 3).
Cats were sedated with acepromazine (0.3 mg/kg, S.Q.), and anesthesia was induced with ketamine HCl
(15–35 mg/kg, I.M.) and maintained with alpha-chloralose (65 mg/kg, I.V., supplemented at 15 mg/kg, I.V.). Animals were intubated by tracheotomy and respired to maintain end tidal CO2 at 3-4 %. Body
temperature was maintained with a water circulating heating pad, and arterial blood pressure was monitored using a catheter in the carotid artery. Fluids levels were maintained by administering 0.9 % saline with 8.4 mg/ml sodium bicarbonate and 5 % dextrose (15 ml/kg/h, I.V.). The sciatic nerve was exposed via an incision on the dorsal aspect of the thigh, and a bipolar hook electrode was placed on the nerve for stimulation. The tibial nerve was exposed via an incision medial to the distal portion of the calcaneal tendon, and a tripolar nerve cuff electrode (2 mm I.D.; 5 mm intercontact distance) was installed around the tibial nerve to record the compound action potential (CAP). Similar to the rat experiments, the EMG of the medial gastrocnemius muscle was recorded using a pair of stainless steel wires with exposed tips inserted percutaneously.
Stimulation was delivered through the hook electrodes using an arbitrary waveform generator (Agilent 33120A) and a linear voltage-to-current converter (A-M Systems 2200). The EMG and CAP signals was amplified (100– 1,000 and 1,000–10,000, for EMG and CAP, respectively) and filtered (3 Hz – 10 kHz) using a low noise voltage
amplifier (Grass Technologies P511 AC Amplifier), and recorded using the Powerlab hardware system and the LabChart software suite (ADInstruments Inc) with a sampling rate of 20 kHz.
Input-output curves of the rectified and integrated evoked EMG and CAP signals as a function of K were measured for conventional pulses, and for TAMS and the three modified versions of TAMS using seven carrier frequencies: 1, 2, 5, 10, 20, 50 and 100 kHz. We deter-mined that 100 kHz was the maximum frequency that did not experience substantial attenuation by the voltage-to-current converter, and prior computational modeling results indicated that there is no significant difference in nerve fiber activation between TAMS with 100 kHz and 210 kHz carrier frequencies [11]. The input-output curve was recorded by delivering 1 ms duration sinusoidal bursts or pulses at 1 Hz and gradually increasing K in steps of 10–40 μA every 6–10 stimuli until the maximal response was evoked. In each experiment, the input-output curve for the conventional pulse was recorded first, followed by the remaining four waveforms, and the order of presenta-tion of the seven carrier frequencies was randomized.
Statistical analysis
we defined as the K that produced 50 % of the max-imum area of the rectified EMG or CAP response. We performed a separate ANOVA for the EMG and CAP data with I50 as the dependent variable and
waveform type, carrier frequency (nested within waveform type), and species (in the case of EMG data) as the independent variables. The ANOVA for the EMG data revealed that species had no signifi-cant interactions with the other independent variables (p> 0.9 in both cases), and EMG data from both species were combined for further analysis. For tests that revealed significant differences among wave-forms, post hoc paired comparisons were performed using Fisher’s protected least significant difference (FPLSD) test at a significance level of p< 0.05. Although data were log-transformed for analysis, data were plotted in the figures as average percent differ-ence with respect to the pulse.
Results
Simulations in a computational model of peripheral nerve fiber stimulation
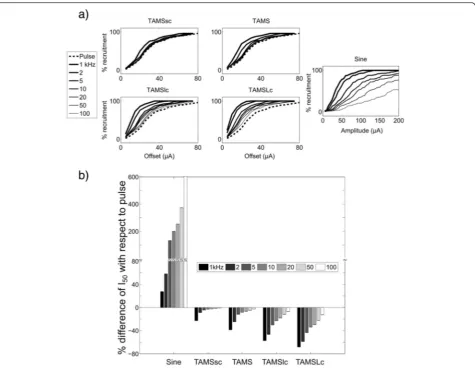
As the offset,K,(or the amplitude, A, for the sinusoidal burst) of the stimulation waveform was increased, the number of activated model nerve fibers increased monotonically for all stimulation waveforms (Fig. 4a). The carrier frequency of TAMS and modified TAMS, as well as the frequency of the sinusoidal burst, clearly affected the recruitment curves, and as the (carrier) frequency was decreased, the recruitment curve shifted to the left. We quantified the effect of the (carrier) frequency using I50, i.e., the signal offset (or amplitude)
that activated 50 % of the population of model nerve fibers. Figure 4b shows the difference in I50between the
sinusoidal burst, TAMS and modified TAMS, and the rectangular pulse. All four TAMS versions had lower I50
compared to the pulse for all 7 carrier frequencies, and
Fig. 4Simulation of nerve stimulation.aRecruitment curves for one sample population for all stimulation waveforms as a function of signal offset or signal amplitude. Each plot shows a different waveform using 7 (carrier) frequencies, except for the recruitment curve for the pulse, which was plotted in the TAMS graphs for comparison.bPercent difference of I50with respect to pulse for sinusoidal burst, TAMS and modified
this difference increased for lower carrier frequencies. Further, for any given carrier frequency, I50 decreased
more markedly as the size of the carrier increased, i.e., the largest difference with respect to the pulse was obtained for TAMSLc, followed by TAMSlc, TAMS and TAMSsc. On the contrary, the zero-offset sinusoid had much higher I50 than the rectangular pulse for all
frequencies.
In vivo measurements
Figures 5 and 6 show the effects of stimulation wave-forms on the in vivo EMGs and CAPs, respectively. The rectified EMG area increased as K was increased, and the sigmoidal input-output curves shifted to the left as the carrier frequency decreased (Fig. 5a). I50, i.e., the K that
produced 50 % of the maximal rectified area depended on
the carrier frequency. For the 1 kHz carrier, I50averaged
142 ± 23.5 μA, 114 ± 18.8 μA, 94 ± 24.5 μA and 60 ± 11.5 μA (mean ± S.E.) for TAMSsc, TAMS, TAMSlc and TAMSLc, respectively, and for the 100 kHz carrier, I50
averaged 173 ± 29.0μA, 175 ± 27.4μA, 177 ± 29.8μA and 188 ± 38.2 μA (mean ± S.E.), respectively. For the rect-angular pulse, I50averaged 168 ± 23.0μA (mean ± S.E.). A
two-way repeated measures ANOVA showed significant effects of waveform type and frequency (p< 0.0001 in both cases). Post hoc paired comparisons revealed significant differences (FPLSD, p< 0.05) between rectangular pulse, and TAMS and modified TAMS only for certain carrier frequencies (Fig. 5b). All four TAMS waveforms had significantly lower I50 compared to the rectangular pulse
using the 1 kHz carrier, but none showed significant differences with the pulse for carrier frequencies higher
Fig. 5Evoked EMG activity.aInput-output curves measured in one animal for all stimulation waveforms. Each plot shows a different waveform using 7 carrier frequencies, except for the pulse, which was plotted in all 4 graphs.bPercent difference of I50with respect to pulse for TAMS and
than 10 kHz. Further confirmation of nerve activation as quantified by EMG responses was obtained with measurements of the CAP, which showed similar trends (Fig. 6). For the rectified area of the CAP, the input-out curves shifted to the left with frequency, as well. For the 1 kHz carrier, I50averaged 265 ± 56.6μA, 225 ± 13.5 μA,
187 ± 65.2 μA and 120 ± 35.7 μA (mean ± S.E.) for TAMSsc, TAMS, TAMSlc and TAMSLc, respectively. For the 100 kHz carrier, I50 averaged 262 ± 60.0 μA,
281 ± 41.3 μA, 268 ± 54.4 μA, 259 ± 62.8 μA (mean ± S.E.), respectively. For the rectangular pulse, I50averaged
281 ± 41.0μA. In this case, I50for only TAMSlc of 1 and
2 kHz, and TAMSLc of 1, 2, 5 and 10 kHz, was significantly lower than for the rectangular pulse (FPLSD,p< 0.05).
Discussion
We quantified the contributions of the carrier frequency and amplitude of TAMS to nerve fiber activation in vivo and using a computational model. Carrier frequencies of 20 kHz and higher (recall that the default carrier fre-quency of the original TAMS waveform was 210 kHz) did not contribute to excitation (i.e., activation was
equivalent to the conventional pulse) regardless of the amplitude of the carrier, while lower carrier frequencies did contribute to excitation, as reflected by the substan-tial reductions in I50 relative to the conventional pulse
without a carrier. Our simulation results closely matched our experimental measurements, and using a carrier fre-quency of 1 kHz, I50in the model declined by 68, 57, 39
and 23 % with respect to the pulse, for TAMSLc, TAMSlc, TAMS and TAMSsc waveforms, respectively, while for the EMG measurements, the reductions were 65, 49, 33 and 18 %. Further, the model revealed much higher thresholds for the zero offset sinusoid as compared to the rectangular pulse, which supports the conclusion that the high frequency sinusoidal component of TAMS contributes little to nerve fiber excitation. Collectively, these results indicate that amplitude modulated kHz stimulation (>20 kHz) does not improve the efficacy or efficiency of electrical stimulation of peripheral nerves.
Mechanisms of nerve fiber activation using TAMS
TAMS with carrier frequencies below 20 kHz had lower thresholds than conventional pulses. Specifically, for Fig. 6Evoked CAP activity.aInput-output curves measured in one animal for all stimulation waveforms. Each plot shows a different waveform using 7 carrier frequencies, except for the pulse, which was plotted in all four graphs.bPercent difference of I50with respect to pulse for TAMS
1 kHz TAMS the reduction in I50was 33 and 17 % for
EMG and CAP responses, respectively. At this frequency, the 1 ms pulse comprises a single cycle of the carrier, and therefore the stimulation waveform may effectively act as a 500 μs pulse of amplitude twice the offset. In this case, the strength-duration (SD) relation-ship, which quantifies nerve fiber threshold as a function of pulse duration, can be used to predict the differences in threshold. The SD curve is commonly described using the equationIth= Irh(1 + Tch/PW), wherePWis the pulse width, Irh is the rheobase, i.e., threshold current for a very long PW, and Tch is the chronaxie, i.e., PW to obtain a threshold of twice the rheobase [15]. The motor axons in the cat tibial nerve have a chronaxie of 0.53 ms [16]. It follows that if we consider the 1 kHz TAMS as a 0.5 ms pulse of double amplitude of the pulse, then the SD curve estimates a threshold for 1 kHz TAMS 33 % smaller than the conventional pulse, and this matches quite well our measurements of I50.
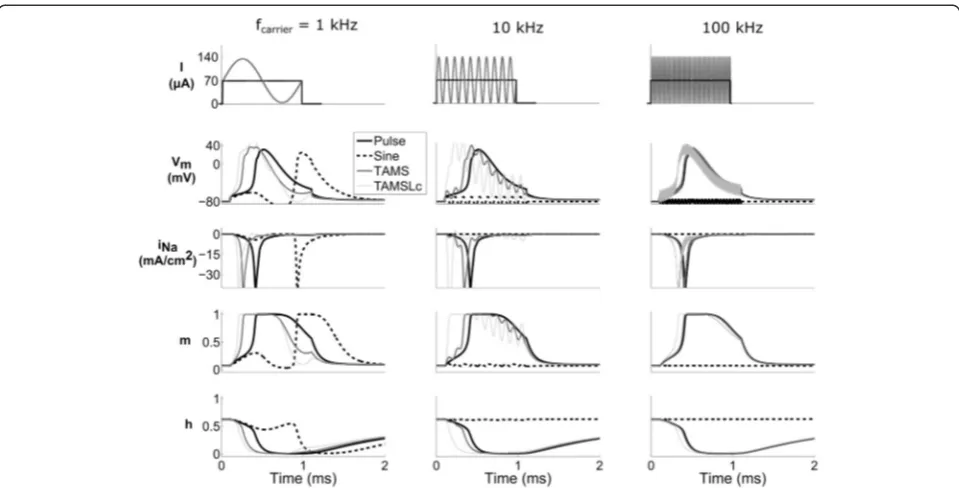
To understand the mechanisms of nerve fiber activation using TAMS with carrier frequencies greater than 20 kHz, we recorded membrane parameters (transmembrane voltage, sodium current, and sodium conductance gating parameters) in the model nerve fiber during stimula-tion with TAMS, the convenstimula-tional pulse, and sine waves of 1 ms duration. During extracellular stimula-tion using rectangular pulses, the time course of the
gating parameters may differ depending on the ampli-tude and duration of the pulse, and at threshold, the action potential initiates near the end of the pulse [17]. The traces of the sodium current, INa, were very
similar for 100 kHz TAMS and for the rectangular pulse (third row, right panel of Fig. 7), i.e., the time courses of both currents overlapped, as it would be the case for two rectangular pulses of the same duration and well above threshold. The time course of the gating parameters, m and h, overlapped as well. Increasing the relative amplitude of the carrier, i.e., TAMSLc, only slightly altered the dynamics of the gating parameters, and the initiation of the action potential was shifted very slightly earlier in time. The membrane voltage showed only small oscillations at 100 kHz for the waveforms incorporating this fre-quency, and the zero-offset 100 kHz sine did not activate the axon. Therefore, the filtering of the mem-brane that passed the offset but attenuated the 100 kHz carrier, resulted in similar dynamics of the gating parameters, which explains nerve fiber excita-tion in this frequency range. On the other hand, for the 1 kHz carrier the dynamics of the gating parame-ters differed greatly. In this case, for a 1 ms duration, TAMS and the sinusoidal burst comprised only a single cycle of the sine wave. Further, TAMS roughly resembled a 500 μs monophasic pulse, and the sinusoidal burst, a
biphasic pulse of 500μs each phase. As a result, the action potential initiated at slightly different times for TAMS and TAMSLc, and somewhat later for the rectangular pulse, whereas for the sinusoidal burst axon activation occurred by the end of the hyperpolarizing phase.
Continuous zero mean ac signals in the 1 to 50 kHz range have been used for conduction block (for a review see [18]), but it is unclear whether amplitude modulated stimulation, as used in this study, can produce block. The onset of the kHz frequency block signal generates transient axon activation [18], and it is possible that in our experiments we observed a similar phenomenon, in which the transient phase of the stimulation waveform activated the axons. In their computational study, Bhadra et al. [19] simulated the onset phenomenon and observed distinct firing frequency responses to increasing signal amplitudes, from few action potentials to continu-ous firing, for both block and non-block signals. In our simulations, we observed only single action potentials for a wide range of amplitudes limited to the 1 ms duration of the pulses, and this range, i.e., up to few hundreds ofμA, roughly matches the non-block amplitude range of Bhadra et al. using similar simulation conditions.
Implications for transcutaneous electrical stimulation
TAMS was originally proposed for transcutaneous elec-trical stimulation and was intended to generate less attenu-ated voltages at deeper nerves. The idea was inspired by the experimental observation that the impedance of the skin declines by several orders of magnitude as the frequency increases to the kHz range [20]. Thus, high-frequency components, as the sinusoidal carrier in TAMS, may encounter less tissue impedance, thereby providing more current that may activate more deeply positioned nerves. As well, the impedance of the skin may be over-come by using very short duration pulses since shorter pulses have higher frequency content. In fact, the main lobe of the “sinc” function, i.e., the power spectrum of a single pulse, has a width that is inversely proportional to the pulse duration. For example, for a 10 μs pulse the power spectrum extends up to 100 kHz. Similar to kHz frequency sinusoidal bursts, the higher frequency compo-nents of a short pulse may overcome the skin impedance, but the main frequency component of the pulse is dc, regardless of its duration. While indeed our previous modeling work demonstrated less attenuation at depth of high frequency signals [11], the present findings indicate that high frequency components of the TAMS signal do not contribute to activation of nerve fibers, and this mitigates the possible benefit of deeper penetration. In our experiments, we bypassed the filtering effects of the skin by applying stimulation directly to the sciatic nerve, and manipulated the amplitude of the carrier. By means of this manipulation, we mimicked a scenario in which the
filtering by the skin (and other intervening tissue) attenu-ates the (dc) offset much more so than the kHz frequency carrier, which we increased by as much as three times the size of the offset (i.e., TAMSLc). Since we observed no contribution of carriers of 20 kHz and above to nerve fiber activation, any reduction of carrier attenuation in TES will not affect nerve fiber excitation, as well.
Our results are in agreement with those of Slovak et al. [10] who found no differences in either motor thresholds or sensation thresholds between TAMS and conventional pulses. In their experiment, the authors applied current-controlled TES to the forearm of ten subjects and recorded the electrode-skin impedance, the motor threshold as iden-tified using the EMG, and the first reported sensation upon increasing stimulation amplitude. Since these measures showed no differences between TAMS and rectangular pulses, the authors concluded that it is unlikely that TAMS provides any efficacy improvement over conventional stimulation. In clinical applications, it is yet to be deter-mined whether TAMS can produce less skin discomfort than conventional pulses. TAMS improved the symptoms of patients with overactive bladder via stimuli delivered over the sacrum that presumably activated the sacral roots [5]. However, TAMS was not compared against conven-tional pulses in this clinical trial, and therefore it is unclear whether patients would experience less discomfort with TAMS as compared to conventional pulses. Importantly, our results suggest that subjects would not experience less discomfort with TAMS because for any given signal offset, TAMS (>20 kHz) produced the same level of nerve fiber activation as the rectangular pulse, regardless the amplitude of the carrier. It is very unlikely that the more superficial sensory fibers conveying pain information would respond differently. In fact, our modeling results [11] suggest that there is no inversion of the current-distance relationship for TAMS, and thus TAMS and the rectangular pulse would activate the same fibers at any given distance from the skin electrode. Slovak et al. measured sensory thresholds as well, and found no differ-ence between TAMS and rectangular pulse. These results also support the idea that discomfort would be the same in sacral transcutaneous stimulation.
not depend on frequency. In addition, the voltage and current transients for both types of stimulation were measured experimentally using pulses, and showed great differences [22]. Similarly, for TAMS, the transient of the delivered current for voltage- and current-controlled stimulation may also differ greatly, resulting in differences in the filtered signal that stimulates the nerve and, conse-quently, differences in nerve fiber activation. Therefore, the tissue filtering effects in both types of stimulation may differentially affect nerve activation. However, our results suggest that such filtering plays a minimal role in nerve fiber excitation using TAMS (>20 kHz) because changing the relative amplitude of the carrier (as a proxy for filter-ing) had no effect on nerve fiber excitation. As well, prior modelling work showed that nerve fiber thresholds for 100 kHz TAMS and conventional pulses were the same for both voltage- and current-controlled stimulation [11]. Finally, TAMS will not improve the efficiency of stimula-tion, as the addition of high-frequency carriers on top of the offset only increases the delivered energy. Instead, transcutaneous stimulation may be more efficient using other stimulation waveforms that reduce energy and/or power required for peripheral nerve stimulation [23].
Limitations
One of the limitations of our study was not including frequencies higher than 100 kHz. In the original formu-lation of TAMS, Shen et al. [4] used a carrier of 210 kHz, but it is unclear how this particular frequency was selected. The changes in skin conductivity and im-pedance between 100 and 200 kHz are minimal [20, 24], and thus it is unlikely that we would observe different contributions to excitation between these frequencies. Further, a computational model of TES showed no dif-ference in thresholds for axon activation using TAMS of 100 and 200 kHz [11].
The axon model that we used in this study, the MRG model, has been used to model conduction block with kHz frequency sinusoidal signals, and the results matched well the experimental data [19]. However, the model has not been thoroughly validated for activation of nerve fibers using kHz signals. For such validation, the model may need to be updated. Firstly, the capaci-tance of the axon membrane exhibits dispersion, and its conductance declines by a factor of two between dc and 100 kHz [25]. Howell et al. [26] quantified the effects of dispersive capacitance by incorporating a frequency-dependent membrane capacitance, c(f ), in the MRG model. The threshold for generation of a single action potential using kHz sinusoidal signals applied for 10 ms declined by up to 14 % after incorporating c(f ) in a 11.5μm axon. Thus, it is possible that incorporating c(f ) would further reduce thresholds in our simulations, but since we observed a greater effect of the offset, such
reduction should be marginal. Finally, the MRG model does not include all ionic conductances present in human peripheral myelinated nerve fibers (e.g., [27]), and the mathematical equations describing the dynamics of ion channel were constructed based on experimental observa-tions with low-frequency signals. Therefore, further inves-tigation is needed to determine if the number and type of channels and their responses to kHz signals can accurately describe axon activation using TAMS and other high-frequency signals.
Conclusion
We conducted in vivo experiments and computational simulations to quantify the effects of an amplitude-modulated signal with a kHz frequency sinusoidal carrier and a non-zero 1 ms pulse offset, called TAMS, on nerve fiber activation. TAMS with carrier frequencies of 20 kHz or greater generated the same activation as a conventional rectangular pulse, even after increasing the size of the carrier. Therefore, the addition of high-frequency carriers to the stimulation signal did not improve efficacy or effi-ciency in peripheral nerve stimulation, and in particular in TES, in which kHz signals have been tested as a means to overcome the skin impedance.
Abbreviations
CAP, compound action potential; EMG, electromyogram; FPLSD, Fisher’s protected least significant difference; Irh, rheobase; MRG, McIntyre-Richardson-Grill;
PW, pulse width; SD, strength-duration; TAMS, transdermal amplitude modulated signal; TAMSlc, TAMS larger-carrier; TAMSLc, TAMS Largest-carrier; TAMSsc, TAMS smaller-carrier; Tch, chronaxie; TES, transcutaneous electrical stimulation
Acknowledgements
We would like to thank Gilda Mills and Chris Langdale for their assistance with the animal surgeries.
Funding
This work was supported by NIH Grants R37 NS040894 and R01 NS050514.
Availability of data and material
The datasets supporting the conclusions of this article are available in the Harvard Dataverse repository, http://dx.doi.org/10.7910/DVN/VTVXUO.
Authors’contributions
LEM and WMG conceived and designed research, interpreted results of experiments and wrote manuscript. LEM performed experiments and analyzed data. Both authors approved final version of manuscript.
Competing interests
The authors declare that they have no competing interests.
Consent for publication
Not applicable.
Ethics approval and consent to participate
All animal care and experimental procedures were approved by the Institutional Animal Care and Use Committees of Duke University, protocol numbers A279-14-12 and A279-12-11.
Author details 1
4Department of Electrical and Computer Engineering, Duke University, Durham, NC, USA.
Received: 11 January 2016 Accepted: 29 June 2016
References
1. Grill WM, Norman SE, Bellamkonda RV. Implanted neural interfaces: biochallenges and engineered solutions. Annu Rev Biomed Eng. 2009;11:1–24. 2. Ward AR. Electrical stimulation using kilohertz-frequency alternating current.
Phys Ther. 2009;89:181–90.
3. Beatti A, Rayner A, Chipchase L, Souvlis T. Penetration and spread of interferential current in cutaneous, subcutaneous and muscle tissues. Physiotherapy. 2011;97:319–26.
4. Shen B, Roppolo JR, Subbaroyan J, Diubaldi A, Wahlgren S, de Groat WC, Tai C. Neuromodulation of bladder activity by stimulation of feline pudendal nerve using a transdermal amplitude modulated signal (TAMS). Neurourol Urodyn. 2011;30:1686–94.
5. Monga AK, Linsenmeyer TL. Clinical Trial To Investigate the Efficacy of Acute Sacral Neurostimulation Using a Novel Transdermal Amplitude-Modulated Signal (Tams) in Subjects With Neurogenic Detrusor Overactivity. Eur Urol Suppl. 2011;10:190.
6. Tai C, Shen B, Wang J, Liu H, Subbaroyan J, Roppolo JR, De Groat WC. Inhibition of bladder overactivity by stimulation of feline pudendal nerve using transdermal amplitude-modulated signal (TAMS). BJU Int. 2012;109: 782–7.
7. Boggs JW, Wenzel BJ, Gustafson KJ, Grill WM. Frequency-dependent selection of reflexes by pudendal afferents in the cat. J Physiol. 2006; 577(Pt 1):115–26.
8. Elkelini MS, Pravdivyi I, Hassouna MM. Mechanism of action of sacral nerve stimulation using a transdermal amplitude-modulated signal in a spinal cord injury rodent model. Can Urol Assoc J. 2012;6:227–30.
9. Monga A, Dmochowski R, Miller D, Monga A, Dmochowski R, Miller D. Evaluation of a novel, non-invasive, patient-managed neuromodulation system (PMNS) on urgency, urinary incontinence and patient-reported outcomes in subjects with overactive bladder (OAB) syndrome who had previously failed therapy: a four week, multicente. In: International Continence Society Annual Meeting, Glascow 2011. 2011.
10. Slovak M, Barker a T, Chapple CR. The assessment of a novel electrical stimulation waveform recently introduced for the treatment of overactive bladder. Physiol Meas. 2013;34:479–86.
11. Medina LE, Grill WM. Volume conductor model of transcutaneous electrical stimulation with kilohertz signals. J Neural Eng. 2014;11:066012.
12. McIntyre CC, Richardson AG, Grill WM. Modeling the excitability of mammalian nerve fibers: influence of afterpotentials on the recovery cycle. J Neurophysiol. 2002;87:995–1006.
13. Schmalbruch H. Fiber composition of the rat sciatic nerve. Anat Rec. 1986; 215:71–81.
14. Ranck JB, BeMent SL. The specific impedance of the dorsal columns of cat: an anisotropic medium. Exp Neurol. 1965;11:451–63.
15. Geddes L a, Bourland JD. The strength-duration curve. IEEE Trans Biomed Eng. 1985;32:458–9.
16. Moldovan M, Krarup C. Persistent abnormalities of membrane excitability in regenerated mature motor axons in cat. J Physiol. 2004;560:795–806. 17. Warman EN, Grill WM, Durand D. Modeling the effects of electric fields on
nerve fibers: Determination of excitation thresholds. IEEE Trans Biomed Eng. 1992;39:1244–54.
18. Kilgore KL, Bhadra N. Reversible nerve conduction block using kilohertz frequency alternating current. Neuromodulation. 2014;17:242–54. 19. Bhadra N, Lahowetz E a, Foldes ST, Kilgore KL. Simulation of high-frequency
sinusoidal electrical block of mammalian myelinated axons. J Comput Neurosci. 2007;22:313–26.
20. Rosell J, Colominas J, Riu P, Pallas-Areny R, Webster JG. Skin impedance from 1 Hz to 1 MHz. IEEE Trans Biomed Eng. 1988;35:649–51.
21. Vargas Luna JL, Krenn M, Cortés Ramírez JA, Mayr W. Dynamic Impedance Model of the Skin-Electrode Interface for Transcutaneous Electrical Stimulation. PLoS One. 2015;10:e0125609.
22. Vargas Luna JL, Krenn M, Löfler S, Kern H, Cortes Ramirez JA, Mayr W. Comparison of twitch responses during current- or voltage-controlled transcutaneous neuromuscular electrical stimulation. Artif Organs. 2015;39: 868–75.
23. Wongsarnpigoon A, Grill WM. Energy-efficient waveform shapes for neural stimulation revealed with a genetic algorithm. J Neural Eng. 2010;7:046009. 24. Gabriel S, Lau RW, Gabriel C. The dielectric properties of biological tissues: II.
Measurements in the frequency range 10 Hz to 20 GHz. Phys Med Biol. 1996;41:2251–69.
25. Haydon BYD a, Requena J, Urban BW. Some effects of aliphatic hydrocarbons on the electrical capacity and ionic currents of the squid giant membrane. J Physiol. 1980;309:229–45.
26. Howell B, Medina LE, Grill WM. Effects of frequency-dependent membrane capacitance on neural excitability. J Neural Eng. 2015;12:056015. 27. Howells J, Trevillion L, Bostock H, Burke D. The voltage dependence of I(h)
in human myelinated axons. J Physiol. 2012;590(Pt 7):1625–40.
• We accept pre-submission inquiries
• Our selector tool helps you to find the most relevant journal
• We provide round the clock customer support
• Convenient online submission
• Thorough peer review
• Inclusion in PubMed and all major indexing services
• Maximum visibility for your research
Submit your manuscript at www.biomedcentral.com/submit