R E S E A R C H A R T I C L E
Open Access
Choice of futility boundaries for group
sequential designs with two endpoints
Svenja Schüler
1*, Meinhard Kieser
1and Geraldine Rauch
1,2Abstract
Background: In clinical trials, the opportunity for an early stop during an interim analysis (either for efficacy or for futility) may relevantly save time and financial resources. This is especially important, if the planning assumptions required for power calculation are based on a low level of evidence. For example, when including two primary endpoints in the confirmatory analysis, the power of the trial depends on the effects of both endpoints and on their correlation. Assessing the feasibility of such a trial is therefore difficult, as the number of parameter assumptions to be correctly specified is large. For this reason, so-called ‘group sequential designs’ are of particular importance in this setting. Whereas the choice of adequate boundaries to stop a trial early for efficacy has been broadly discussed in the literature, the choice of optimal futility boundaries has not been investigated so far, although this may have serious consequences with respect to performance characteristics.
Methods: In this work, we propose a general method to construct ‘optimal’ futility boundaries according to predefined criteria. Further, we present three different group sequential designs for two endpoints applying these futility boundaries. Our methods are illustrated by a real clinical trial example and by Monte-Carlo simulations. Results: By construction, the provided method of choosing futility boundaries maximizes the probability to correctly stop in case of small or opposite effects while limiting the power loss and the probability of stopping the study ‘wrongly’. Our results clearly demonstrate the benefit of using such ‘optimal’ futility boundaries, especially compared to futility boundaries commonly applied in practice.
Conclusions: As the properties of futility boundaries are often not considered in practice and unfavorably chosen futility boundaries may imply bad properties of the study design, we recommend assessing the performance of these boundaries according to the criteria proposed in here.
Keywords: Group sequential design, Stopping for futility, Two endpoints, Intersection-union test
Background
In recent years, the flexibility and efficiency of clinical trials became increasingly important, in particular for tri-als from the pharmaceutical industry. Group sequential designs give the opportunity to stop the study early dur-ing an interim analysis, thereby savdur-ing time and financial resources. Generally, the study can either be stopped for efficacy if the study goal is prematurely achieved or for futility, if reaching the aim of the trial seems desper-ate. Decision rules to stop a trial early for efficacy have been broadly investigated. Since the pioneering works of
*Correspondence: schueler@imbi.uni-heidelberg.de
1Institute of Medical Biometry and Informatics, University of Heidelberg, Im Neuenheimer Feld 130.3, 69120 Heidelberg, Germany
Full list of author information is available at the end of the article
Pocock [1] and O’Brien and Fleming [2], these designs have been implemented since long in clinical trial rou-tine. A comprehensive overview and general concepts of the statistical methodology in group sequential designs are provided by Jennison and Turnbull [3]. With respect to futility stopping, there are mainly two fundamental approaches in the statistical literature [3, 4]. The first approach is a conditional one, where the study is stopped for futility, if the conditional power falls under a prespec-ified threshold. This conditional approach can further be divided into stochastic curtailment [5, 6], a frequentist approach, and methods based on the predictive power or the predictive probability [4], which are partially or fully Bayesian methods [7, 8]. The second approach is to define futility stopping boundaries either in isolation or
in conjunction with group sequential efficacy boundaries [3]. The choice of adequate boundaries to stop the study early for futility has been discussed only briefly in these works. This is astonishing as unfavorable futility bound-aries may have serious consequences with respect to the performance of the study design.
In our work, we propose a general method for the con-struction of futility boundaries. In addition, we introduce several intuitive criteria which should be considered when defining ‘optimal’ futility boundaries described as follows. First, unless offset by increased sample size, early stopping for futility reduces the overall power. The aim is thus to avoid a too high loss in power. Second, the study should be stopped early for futility if the unknown true effect is far away from the anticipated effect under the alternative hypothesis (‘correctly’ stopping for futility). Finally, if the unknown true effect corresponds to the anticipated effect under the alternative hypothesis, the study should not be stopped for futility (‘wrongly’ stopping for futility).
In principle, these optimality criteria might be applied in any two-stage design. In the literature, group sequen-tial designs with futility stopping are usually formulated for a single primary endpoint [9–12]. Beside several works on interim efficacy evaluation in group sequential designs with multiple endpoints [13–18] there are only few works suggesting group sequential methods for multiple end-points including futility stopping [19, 20]. However, we believe that such designs are of particular relevance for clinical trials with multiple primary endpoints for the rea-son specified in the following. When considering two endpoints, the power of the trial depends on the expected effects of both endpoints and on the correlation between them. Assessing the feasibility of the trial is therefore a particular challenge, as the number of required parame-ter values to be correctly specified in the planning stage is large. Therefore, the option for an early futility stop is attractive to account for these uncertainties. Moreover, the required sample size for a clinical trial with several pri-mary endpoints is usually higher than for a single pripri-mary endpoint and therefore the need to stop the trial early in case of unfavorable outcomes is of particular importance. In this work, we apply the general construction method of futility boundaries to three different two-stage group sequential designs for two endpoints. For these designs, we propose an algorithm to choose ‘optimal’ futility boundaries with respect to the above mentioned criteria. Thereby as Jennison and Turnbull [3], we define group sequential futility stopping boundaries in conjunction with efficacy boundaries.
This paper is organized as follows. The “Methods” section introduces first the study design, the test prob-lem and general principles of group sequential designs and then describes the new approach of choosing ‘opti-mal’ futility stopping boundaries as motivated above.
Moreover, different group sequential designs for two end-points profiting from these optimal futility boundaries are proposed. Furthermore, the derivation of ‘optimal’ futility boundaries is described. The “Results” section investigates the performance characteristics of the new methods by means of Monte-Carlo simulations cased on a real clinical trial example. Finally, we conclude with a discussion.
Methods
Standard group sequential methods allow stopping a study early at an interim analysis where the outcome is observed and analyzed for a part of the maximum number of patients. The study can thereby either be stopped for efficacy or for futility. For simplicity, we restrict our con-siderations to a controlled clinical trial with one interim analysis and one final analysis resulting in a group sequen-tial design with two stages. In this section, we first con-sider the situation of a single endpoint in order to describe the new approach of choosing futility boundaries gener-ally. After that, group sequential designs for two endpoints are proposed.
Test problem and general principles
The (local) test problem for the endpoint under investiga-tion is given by
H0δ:θ ≤δ versus H1δ:θ > δ, δ≤0, (1) where δ = 0 implies a one-sided superiority test prob-lem andδ < 0 corresponds to a test for non-inferiority. Considering binary or continuous outcome measures,θ is given by the absolute risk difference or mean dif-ference, respectively, whereas for time-to-event data θ indicates the logarithm of the hazard ratio. The stan-dard approaches to test for superiority are given by the chi-square test for binary data, thet-test for continuous data and the log-rank test for time-to-event data [21]. Note that all these test statistics are approximately stan-dard normally distributed under the corresponding null hypothesis.
In a two-stage group sequential design the test statis-tics T1 and T2 used at the interim analysis and at the
final analysis, respectively, corresponds to the standard test statistics of a fixed design using all data collected so far with some modifications for the case of time-to-event data [22]. The correlation between the normally dis-tributed test statisticsT1andT2then exclusively depends
on the (assumed) information fraction at interim which can be specified in the planning stage. After the correla-tion between the test statistics has been determined, the adjusted (one-sided) local significance levelsα1andα2can
in time [1, 2, 23–25]. Then the null hypothesis given in (1) is rejected at interim whenever the one-sidedp-value p1referring to T1 fulfillsp1 ≤ α1. The null hypothesis
is rejected at the final analysis whenever the one-sided p-valuep2corresponding toT2fulfillsp2≤α2.
In general, stopping for futility without compromising the type I error is possible at any time and indepen-dent of any predefined rules as an early acceptance ofH0
decreases the actual type I error rate. In the context of group sequential designs, it can generally be differentiated between binding and non-binding stopping for futility rules, compare also Bretz et al [26]. ‘Binding’ means that stopping for futility at the interim analysis is obligatory whenever the futility criteria are met. When the data sug-gest stopping for futility, it is thusnotallowed to continue the trial for other external reasons. If a binding futility rule is applied, the local significance levels can be increased in order to fully exhaust the global significance level which is otherwise no longer guaranteed as futility stopping implies a lower probability of rejecting the null hypothe-sis. In contrast, the non-binding version does not commit early futility stopping. Therefore, there may be situations were the data advise stopping for futility, but the study is continued nonetheless for other reasons, e.g. as new exter-nal information suggests that the futility criteria might be too strong. As a consequence, the local significance levels cannot be adjusted and the global significance level is not fully exhausted. In clinical trial applications non-binding futility boundaries are usually applied because they allow reacting flexibly to interim results such as adverse events or new external information. However, quantifying the performance properties (in terms of power loss or ‘cor-rectly’ and ‘wrongly’ stopping for futility) of non-binding rules is impossible as the study progress is not predictable from the observed effect at interim.
For the reasons specified above, we will focus in this work on binding stopping criteria at interim but without increasing the local significance levels. In general, a futil-ity rule can equivalently be expressed either in terms of a boundary for the test statistic or as an upper bound for thep-value. We will use the latter approach without loss of generality, that is the study is stopped for futility at interim wheneverp1> αf, whereαf is the futility boundary. Defining optimal binding futility boundaries
Choosing adequate futility boundaries is an important challenge as unfavorable futility boundaries may have seri-ous consequences with respect to the performance of the study design. In case of ‘strong’ futility boundaries, for example, if the study is stopped for futility whenever the one-sidedp-value is larger than 0.2, the overall power loss can be large and the study might be stopped for futility in too many situations caused by only small but non-relevant deviations from the planning assumptions. In such cases,
the probability of ‘wrongly’ stopping for futility is high. In the case of ‘liberal’ futility boundaries, given, for exam-ple, as a lower bound for the p-value of 0.8, the overall power loss is quite small but at the same time small or opposite effects often do not result in an early stop for futility. Hence, the probability of ‘correctly’ stopping for futility is low in this case [9]. The idea of ‘optimal’ futil-ity boundaries proposed here is to provide a high rate of ‘correctly’ stopping for futility and to simultaneously restrict the loss in power and the rate of ‘wrongly’ stopping for futility. To provide ‘optimal’ futility boundaries in this sense, an ‘admissibility condition’ is defined as follows.
Definition 1 (βγ-admissible futility boundaries)Let
H0δ : θ ≤ δ denote the one-sided null hypothesis of the corresponding test problem and H1,δθ
1 be the alternative
hypothesis for a given effectθ1 > δ, for which the trial should have power1−β ∈[ 0, 1]given an overall signif-icance level ofα. Letβl ∈[ 0, 1]be the acceptable overall power loss in a group sequential design with a binding stop-ping for futility rule and letγ ∈[ 0, 1]denote the acceptable probability of stopping for futility under H1,δθ1, the so called ‘wrongly’ stopping for futility rate. Then a futility bound-aryαf is calledβγ-admissibleif the following conditions are met:
1. PHδ 1,θ1(
H0δ is rejected in stage 1)+
PHδ 1,θ1(
H0δis rejected in stage 2 andH0δis neither rejected nor accepted in stage 1)≥1−β−βl,
2. PHδ 1,θ1
(The study is stopped for futility based onαf in stage
1)≤γ,
where PHδ 1,θ1(·)
denotes the probability under the
assump-tion that H1,δθ
1holds true.
For predefined values ofβlandγ there generally exist
severalβγ-admissible futility boundaries. These bound-aries differ in the probability of ‘correctly’ stopping for futility as there is no condition on exhausting the admis-sible power lossβlor the probability of ‘wrongly’ stopping
for futilityγ.
In order to determine ‘optimal’ futility boundaries, the probability of early stopping for futility should be prefer-ably high in case of a small or opposite effect which devi-ates considerably from the anticipated treatment effectθ1.
This motivates the following definition.
Definition 2(βγ-optimal futility boundaries)Let H0δ :
futility boundaries for a maximally admissible power loss
βl ∈[0, 1]and a maximally admissible ‘wrongly’ stopping for futility rateγ ∈[0, 1]. Letθ∗ < θ1 denote the largest effect under H1δ for which stopping the study for futility would still be considered as ‘correct’ and let H1,δθ∗ denote the corresponding alternative hypothesis. Then the futility boundaryαf ∈ Aβl,γ which maximizes the probability of
stopping for futility under H1,δθ∗given as
αopt= max αf∈Aβl,γ
PHδ
1,θ∗(The study is stopped for futility based onαfin stage1)
is calledβγ-optimal, where PHδ
1,θ∗(·)denotes the probabil-ity under the assumption that H1,δθ∗holds true.
Theβγ-optimal futility boundary defines a lower bound for theβγ-admissible boundaries, as all boundaries that are larger than the βγ-optimal boundary automatically meet the βγ-admissible conditions. Note that for group sequential designs for a single endpoint (as well as for designs with two endpoints we consider in this work) the optimal futility boundary could also be determined by maximizing the probability of correctly stopping under the null hypothesis effect θ instead of underθ∗. How-ever, in more complex multiple endpoint group sequential designs this monotonicity property might no longer hold true. The derivation ofβγ-optimal futility boundaries will be described below in “Derivation of the local significance levels andβγ-optimal futility boundaries” section.
In general, the optimality of group sequential designs is usually assessed by means of the average sample size, where a low average sample size is preferable. Although the average sample size is a common criteria to judge the performance of a group sequential design, it has also major shortcomings when applied as the unique mea-sure of performance. For example, the power loss of a group sequential design compared to a correctly speci-fied single-stage design is a further performance criterion. Liu et al. proposed a performance score combining both criteria (average sample size and power loss) [27]. The application of the performance score for the situation of an intersection-union test is, e.g., provided by Kieser et al. [28]. Despite these important new aspects discussed in literature, there further remain some open topics with respect to a performance assessment of a group sequen-tial design: The average sample size is a summary measure which does not necessarily show the true sample sizes because the variability of the sample size is completely ignored. Therefore, a low average sample size is only a good optimality criteria if the variability of the sample size is also low. Instead of looking at the average sample size and its variability, an alternative approach could be to judge the correctness of early stopping (implying a low
sample size) or continuing (implying a high sample size). The latter is what we have investigated in our work.
Investigated group sequential designs with futility stop based on two endpoints
Motivated by the fact that the application of adequate binding futility boundaries is of particular interest when analyzing several endpoints, we consider three different group sequential designs that incorporate two endpoints and different futility stopping rules. The aim is to define a test procedure which offers a maximal gain in informa-tion from two endpoints of interest but simultaneously requires a minimal number of patients to save resources, especially when the effects are lower than originally antic-ipated. These specific two-stage designs will subsequently be used to illustrate the impact of βγ-optimal futility boundaries. In the following, the indexes EP1 and EP2
will denote the affiliation to the two endpoints under investigation.
For Approaches 1 and 2, the aim is to show a signifi-cant effect in both endpoints which are then commonly referred to co-primary endpoints. In this case, the test hypotheses can be formulated using the intersection-union test principle
HIUT,δ1,δ2
0 :H
EP1,δ1 0 ∪H
EP2,δ2
0 versus (2)
HIUT,δ1,δ2
1 :H
EP1,δ1 1 ∩H
EP2,δ2
1 , δ1,δ2≤0, (3)
where the local test hypotheses are given as stated in (1). The most rigorous requirement for a clinical trial with two primary endpoints is to base the effi-cacy proof on demonstrating superiority for both equiv-alently relevant endpoints (H0IUT,0,0 versus H1IUT,0,0). In the case that the endpoints are of different rel-evance, e.g. an efficacy and a safety endpoint, a less rigorous test procedure may also be appropriate. Therefore, Approach 2 combines a superiority test for the efficacy endpoint with a non-inferiority test for the safety endpoint or the endpoint of less clinical relevance (HIUT,0,δ2
0 versusH1IUT,0,δ2, δ2<0). Note that for the ease
of representation, it is assumed without loss of general-ity that the efficacy endpoint corresponds toEP1. A group
sequential test procedure including binding futility stop-ping rules forH0IUT,0,0orHIUT,0,δ2
0 , respectively, is defined
as follows.
Approach 1 (H0IUT,0,0) and Approach 2 (HIUT,0,δ2
0 ,δ2<0)
Stage 1: • The study is stopped early with rejection ofHIUT,δ1,δ2
0 ifpEP1 1 ≤α1EP1
andpEP2
• The study is stopped early for futility (with acceptance ofHIUT,δ1,δ2
0 ) if pEP1
1 ≥α EP1 f orp
EP2 1 ≥α
EP2 f .
Stage 2: At the final analysis,HIUT,δ1,δ2
0 is rejected if pEP1
2 ≤α EP1 2 andp
EP2 2 ≤α
EP2
2 .Otherwise HIUT,δ1,δ2
0 is accepted.
When an efficacy and a safety endpoint are considered it is not necessarily required to perform a hypothesis test for the safety endpoint. But even in this case, the option to stop for futility can be based on both endpoints so that small or opposite effects in the safety endpoint can addi-tionally be ruled out. Approach 3 therefore considers a situation were one endpoint is formally tested for superi-ority at interim and at the final analysis and the other is solely used as an additional criterion for futility stopping. Thus, while the efficacy assessment is exclusively based on endpoint 1, stopping for futility at interim can be based on endpoint 1oron endpoint 2. A further situation to apply Approach 3 could be when a short-term surrogate is used to assess the futility of the trial and a long-term efficacy endpoint is used to assess the efficacy at the final analy-sis. For example, in oncology trials a common surrogate for overall survival is given by progression-free survival which provides more events in a shorter observational time-frame. The test problem is then given by
HEP1,0
0 :θ ≤0 versus H1EP1,0:θ >0, (4)
which corresponds to the definition given in (1) withδ=0 and the related group sequential procedure is defined as follows.
Approach 3 (HEP1,0
0 )
Stage 1: • The study is stopped early with
rejection ofHEP1,0 0 ifp
EP1 1 ≤α
EP1 1 . • The study is stopped early for futility if
pEP1 1 ≥α
EP1 f orp
EP2 1 ≥α
EP2 f .
Stage 2: At the final analysis,HEP1,0
0 is rejected if pEP1
2 ≤α EP1
2 .OtherwiseH EP1,0
0 is accepted.
Unlike for the Approaches 1 and 2, the efficacy proof is now only based onEP1. However, the other endpoint EP2still influences the study result, as early stopping for
futility due toEP2is possible.
Derivation of the local significance levels andβγ-optimal futility boundaries
As motivated above, we do not increase the local sig-nificance levels to fully exhaust the type I error. There-fore, the local levels can be chosen as usual in group sequential designs without taking futility stopping into account, e.g. constant or increasing [1, 2]. The derivation
of increased local significance levels in conjunction with futility stopping (in order to exhaust the overal signifi-cance level) is described in the Supplementary Material (see Additional file 1).
To calculate the βγ-optimal futility boundaries for a specific study situation, we implemented a search algo-rithm inRwhich at first determines all constellations of futility boundaries for both endpoints which simultane-ously maximally exhaust the prespecified thresholds for the probability of ‘wrongly’ stopping for futilityγ and for the power lossβl. Note that these are theβγ-admissible
boundaries. Subsequently the constellations of boundaries which maximize the probability of ‘correctly’ stopping for futility are determined, which are the βγ-optimal boundaries.
Results
To illustrate application of the proposed methods, the three group sequential designs incorporating two end-points are applied (by simulations) to a real clinical trial example. For these three designs, βγ-admissible and βγ-optimal futility boundaries are calculated and furthermore investigated in terms of overall power and probability of ‘correctly’ and ‘wrongly’ stopping for futility.
Clinical trial example and simulation design
The RENAAL study was a randomized, double-blind, placebo-controlled trial conducted to investigate the effect of losartan on renal and cardiovascular outcomes in patients with type 2 diabetes and nephropathy [29]. The primary outcome was a time-to-first event compos-ite endpoint, where the events correspond to doubling the baseline serum creatinin concentration, end-stage renal disease, and death. The recruitment time was fixed to 2 years and the minimal follow-up duration to 3.5 years. Patients were allocated to the placebo and the interven-tion group in a 1 : 1 ratio. The original planning assump-tions used for sample size calculation were given by estimated 5 year event rates of 0.58 and 0.464 in the placebo and the intervention group, respectively [30]. Assuming constant hazard functions over time (exponen-tially distributed survival times), the underlying hazards can be directly calculated from the given event rates [31]. The resulting hazard ratio for the composite end-point is given by λCCE/λICE = 0.0145/0.0104 = 1.394, wherethe parameterλdenotes the hazard function, which is assumed to be constant here, the indexCE stands for ‘composite endpoint’ and the group affiliation is expressed by the indexesIandCfor the intervention and the control group, respectively.
to investigate the components of a composite endpoint separately, in particular the most relevant components [32–34]. Therefore, it might provide a relevant gain in information to include this endpoint in the analysis strat-egy instead of exclusively considering the composite end-point. The two endpoints under consideration are thus given by a composite endpoint combining doubling of baseline serum creatinin concentration, end-stage renal disease, and death and by the endpoint death alone. Thus, whenever a death occurs, this corresponds to an event in both endpoints. However, the composite end-point consist of more events of other types. This illustrates that the two endpoints are correlated by construction. The assumed event rates for the endpoint death have not been published. For the sake of illustration, we assume a hazard ratio for death given by λCMC/λIMC = 0.01/0.0074 = 1.351, where the index MC stands for ‘main component’.
The presented example is appealing in the sense that the two endpoints correspond to a composite endpoint and a main component. In the specific case of a compos-ite endpoint, any additional confirmatory information on the components provides an important gain in informa-tion. Therefore, application of all three group sequential approaches presented in this manuscript can be illustrated by means of a unique example. In most other clinical trial applications only one of the proposed test problems fits the specific confirmatory requirements.
‘Correctly’ and ‘wrongly’ stopping for futility
In order to differentiate between ‘correctly’ and ‘wrongly’ stopping for futility, we modify the underlying hazard assumptions. Consequently, we consider different haz-ard ratios for the main component that deviate from the original planning assumption given byλCMC/λIMC = 0.01/0.0074 = 1.351. Of course, deviations from the planning assumptions could also occur in the composite endpoint or in both endpoints. As every event in the main component also corresponds to an event in the composite endpoint and for sake of an easier illustration, we restrict our considerations to deviations in the main component. The following 7 hazard ratio scenarios for the main com-ponent are considered{1.351; 1.3; 1.25; 1.2; 1.15; 1.1; 1.05}, where without loss of generality the hazard in the inter-vention group was fixed to λIMC = 0.0074 and devia-tions in the hazard ratio are due to variadevia-tions from the assumptions forλCMC. Scenario 1 corresponds to the orig-inal planning assumptions for the main component while the remaining Scenarios 2 to 7 correspond to decreasing treatment effects in the main component. To determine
βγ-optimal futility boundaries according to Definition 2, the largest effect under the alternative hypothesis has to be determined for which stopping the study for futil-ity would still be considered as ‘correct’. In the RENAAL
study, a hazard ratio ofλCMC/λIMC = 1.2 might be a rea-sonable choice for the main component. Consequently, mis-specifications of the hazard ratio given in Scenarios 2 and 3 might be acceptable, whereas for Scenario 4 to 7 it would be justified to stop the study early for futility. This threshold should be based on aspects of clinical relevance and should be discussed with clinical experts. Note that we base for sake of simplicity the threshold for ‘correctly’ stopping for futility in this example only on deviations from the planning assumptions in the main component. This threshold can also depend on the composite end-point or even on both endend-points.
Sample size considerations
On the way to determineβγ-optimal futility boundaries and especially to assess the overall power lossβl, at first
the reference group sequential design without stopping for futility has to be fixed. For this illustrating example, we apply a two-stage group sequential design where the interim analysis is performed after an anticipated infor-mation fraction of 0.5 and where the local significance levels are adjusted according to Pocock [1]. Moreover, we assume that patient recruitment is stopped during the interim analysis. All these settings could be chosen differ-ently and are only of illustrative purpose here. We assume a target power ofβ=0.90 and an overall one-sided signif-icance level ofα=0.025 for the reference design without stopping for futility. The required sample sizes for these reference designs are then given by 1260 (630 per group) for Approach 1 and by 820 (420 per group) for the less stringent Approach 2 where the main component is tested for non-inferiority with a non-inferiority margin of 0.9 in terms of the hazard ratio. The correlation of the test statistics are then given byr1 = 0.83 andr2 = 0.82 for
Approach 1 and Approach 2, respectively. For Approach 3, testing exclusively the composite endpoint yields a sam-ple size of 730 (365 per group). An analytical derivation of the required sample sizes and the correlations between the test statistics is difficult and the results are thus based on simulations. More details on the sample size derivations are described in the Supplementary Material (see Additional file 2).
Simulation results
For varying constellations of futility boundaries the cor-responding values of overall power and probability of stopping for futility differ consequentially. A search algo-rithm (compare “Defining optimal binding futility bound-aries” section) finally chooses the constellation of futility boundaries yielding an acceptable power loss while min-imizing wrongly stopping for futility. This algorithm can be obtained from the authors on request.
Optimal to non-optimal futility boundaries
In order to calculate theβγ-admissible andβγ-optimal futility boundaries the maximal acceptable power loss with stopping for futility is set to βl = 0.05 and the
admissible ‘wrongly’ stopping for futility rate is chosen as
γ =0.025.
For Approach 1, futility bounds given byαCEf =0.43 and
αMC
f = 0.44 maximize the ‘correctly’ stopping for
futil-ity rate at 0.117. In Approach 2, theβγ-optimal futility boundaries are given byαCEf =0.65 andαfMC=0.37 with a probability of ‘correctly’ stopping for futility of 0.087. Approach 3 yieldsβγ-optimal boundaries ofαCE
f = 0.69
andαfMC= 0.65 with a probability of ‘correctly’ stopping for futility of 0.085.
Comparison of design performance between optimal and non-optimal futility boundaries
As a reference, we compare the βγ-optimal futility bounds with a common futility boundary of αCEf =
αMC
f = 0.5 which is often applied in practice. For
Approach 1 and Approach 2 this choice is more liberal than theβγ-optimal boundaries. Therefore, the probabil-ity of ‘correctly’ stopping for futilprobabil-ity is smaller with 0.09< 0.117 for Approach 1 and 0.047 < 0.087 for Approach 2. Neither the probability of ‘wrongly’ stopping for futility (given as 0.016 for Approach 1 and 0.018 for Approach 2) nor the overall power loss (given as 0.017 for Approach 1 and 0.006 for Approach 2) exhaust the maximal admissi-ble valuesγ = 0.025 andβl = 0.05. However, a common
futility bound of 0.5 is contained in the set of admissi-ble boundaries for the first two approaches. For Approach 3 the reference futility boundaries correspond to stricter values than theβγ-optimal ones. Therefore, the probabil-ity of ‘correctly’ stopping for futilprobabil-ity is higher with 0.158> 0.085 but to the prize of a higher probability of ‘wrongly’ stopping for futility with 0.06 which exceeds the admissi-ble valueγ = 0.025 considerably. At the other hand the overall power loss of 0.04 does not exhaust the maximal admissible valueβl =0.05.
Impact of the planning assumptions on power loss and probability of stopping for futility
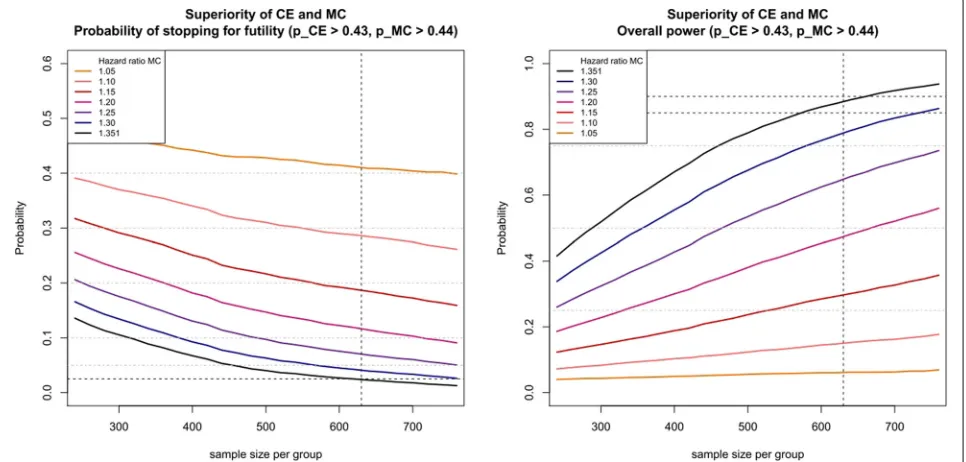
For Approach 1, Fig. 1 illustrates the dependency of the probability of stopping for futility (left plot) and the corre-sponding overall power (right plot) as function of sample size per group for the different hazard ratio scenarios of the main component given above for theβγ-optimal futility boundaries defined above. The differently colored
Fig. 1Probability of stopping for futility (left figure) and overall power (right figure) for Approach 1 using the futilityβγ-boundariesαCE
f =0.43 and
αMC
lines in Fig. 1 match the seven hazard ratio scenarios, where the black line corresponds to the original planning assumption.
The right plot shows the overall power where for the
βγ-optimal futility boundaries the line of the original assumption (black line) should not fall below the admissi-ble power 1−β−βl = 0.90−0.05 = 0.85 (horizontal
dotted line) for a sample size of 630. Decreasing the sample size or decreasing the hazard ratio (which corre-sponds to a larger deviation from the original planning assumptions) results in a monotone loss in overall power. Note that the global power depends on the correlation of the two test statistics. If the correlation is unknown in the planning stage, we recommend investigating the power by simulation. In general, the power increases with increasing absolute value of the correlation.
The left plot of Fig. 1 displays the probability of stopping for futility. In case of the original planning assumption (black line), the probability of ‘wrongly’ stopping for futil-ity is given by 0.025 forngroup = 630. As a hazard ratio
of 1.2 was considered as the largest effect under the alter-native hypothesis for which stopping the study for futility would still be considered as correct, the probability of ‘cor-rectly’ stopping for futility is given by 0.117. Decreasing the sample size or decreasing the hazard ratio (which cor-responds to a larger deviation from the original planning assumptions) results in a monotone increase of the prob-ability of stopping for futility. Note that for decreasing probability of ‘wrongly’ stopping for futility the probability of ‘correctly’ stopping for futility also decreases.
For Approach 2, the corresponding plots look simi-lar, but additionally the non-inferiority margin of the main component mainly influences the required sam-ple size. For Approach 3, the displayed curves are much closer to each other, which means that on the one hand the loss in power is less prominent but on the
other hand the probabilities of ‘correctly’ stopping for futility are also smaller. Figures for Approach 2 and Approach 3 are provided as Supplementary Material (see Additional files 3 and 4).
Influence of the choice of futility boundaries on power and probability of stopping - Admissible and optimal futility boundaries
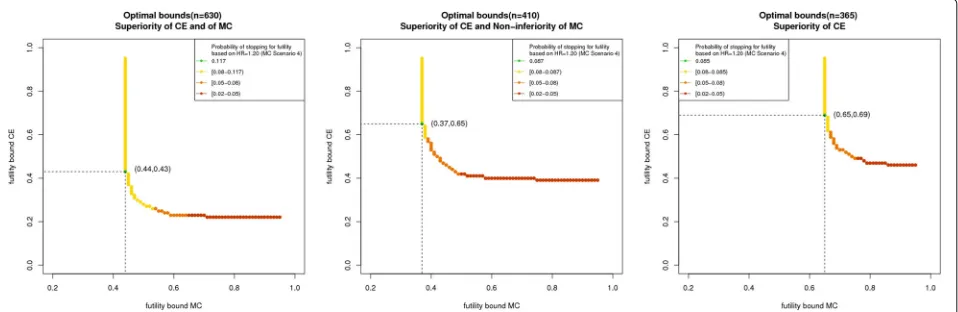
Figure 2 shows the constellations of futility boundaries which meet the admissible condition (Definition 1) for Approach 1 (left plot), Approach 2 (middle plot), and Approach 3 (right plot). As for larger futility bound-aries the overall power increases and the probability of ‘wrongly’ stopping for futility decreases, all boundary constellations right hand from the curves also fulfill the admissible condition. However, the probability of ‘cor-rectly’ stopping for futility also decreases with increasing futility boundaries. Theβγ-optimal pair of futility bound-aries for the composite endpoint and the main component must be an element of the plotted curve, but not all ele-ments of the curve are βγ-optimal. Colors from yellow to green show increasing probabilities of ‘correctly’ stop-ping for futility. In all three approaches, the left- hand side of the curves show higher probabilities of ‘correctly’ stop-ping for futility, whereas for increasing futility boundaries in the main component this probability decreases.
Approach 3 shows the largest futility boundaries as the efficacy proof is based only on the composite end-point and the overall power loss is thus most vulnerable to decreasing futility boundaries. Comparing the βγ -optimal futility boundaries of the first two approaches, Approach 2 shows a larger value for the composite end-point but a smaller for the main component. This is due to the fact that basing the efficacy proof on a non-inferiority test of the main component but on superiority for the composite assigns a higher impact to the composite
Fig. 2Lower bounds forβγ-admissible futility boundaries (yellow,orangeandred dots) andβγ-optimal futility boundaries (green dotwith
endpoint. Consequently, the overall power loss is more vulnerable to a decreasing futility boundary in the com-posite endpoint. For the specific clinical trial situation at hand, all approaches show medium and similar ‘correctly’ stopping for futility rates but Approach 1 by far requires the largest sample size. Approach 2 clearly provides more gain in information compared to Approach 3 as both end-points are included in the efficacy claim. For this reason, Approach 2 should be recommended here.
Discussion
By construction, the provided method of choosing futility boundaries maximizes the probability of detecting small or opposite effects while limiting the power loss and the probability of stopping the study ‘wrongly’. The sim-ulation results provided in “Simsim-ulation results” section clearly demonstrate the benefit of using such ‘optimal’ futility boundaries in the considered scenarios, especially compared to a futility bound of αf = 0.5 which is
commonly applied in practice. However, these criteria are generally applicable to any type of group sequential designs. In order to determine the most suitable two-stage design out of the three approaches presented in “Investigated group sequential designs with futility stop based on two endpoints” section, we recommend to com-pare the performance properties of the designs under
βγ-optimal futility boundaries, which usually differenti-ate between the designs. The design is then chosen by considering the specific study situation, the gain in infor-mation provided by the design, and the probability of ‘cor-rectly’ stopping for futility under theβγ-optimal futility boundaries.
In this work we investigated binding futility bound-aries in order to quantify the performance properties of the corresponding group sequential designs. However, the resulting performance properties of a binding rule can also be used to approximate the performance proper-ties of more liberal non-binding rules as some deviations from the binding rule will not importantly influence the performance.
The performance investigations and calculations of the
βγ-optimal futility boundaries in “Clinical trial exam-ple and simulation design” section were done within the context of a composite endpoint and one relevant main component which refers to a situation of two correlated endpoints. We considered only deviations from the origi-nal planning assumptions in the main component, which is motivated by the fact that every event in the main component corresponds to an event in the composite endpoint. Similar investigations could be made for devi-ations in the other endpoint or simultaneous devidevi-ations in both endpoints. Generally, our proposed designs could equivalently be applied to endpoints with other, poten-tially differing, scale levels. In particular, it would also be
of interest to consider the performance properties of our designs for uncorrelated endpoints. A systematic inves-tigation of all possible sequential designs and endpoint settings within the current work was not feasible. There-fore, we encourage to perform further simulations in order to determine a suitable two-stage design for the specific situation at hand. Further, in this work we chose the Pocock approach for the local significance levels, which facilitates stopping the study early at the interim analysis. Allowing decision criteria that are more conservative in stopping at the interim analysis as, for example, proposed by O’Brien and Fleming [2] will improve the overall power. The general principles of optimal futility boundaries might be transferred similarly to group-sequential designs with more than two stages or patient-wise interim looks as long as the number of interim looks is fixed in advance. The implementation of our ideas in these situations will be the task of future work.
Conclusion
In this paper, we presented general optimality crite-ria for the choice of suitable futility boundaries which maximize the probability of detecting small or opposite treatment effect while limiting the power loss and the probability of stopping the study ‘wrongly’. We illustrated the criteria on three different group sequential designs including two endpoints, which are motivated by the fact that in many clinical trial applications it is not suf-ficient to consider only one primary endpoint in order to adequately describe the efficacy of a new treatment. As the properties of futility boundaries are often not con-sidered in practice and unfavorably chosen futility bound-aries may have serious consequences with respect to the performance of the study design, we recommend assessing the impact of these boundaries according to the proposed admissibility and optimality criteria.
Additional files
Additional file 1:Derivation of local significance levels in case of binding futility boundaries. Details on the derivation of local significance levels in case of binding futility boundaries. (PDF 201 kb)
Additional file 2:Sample size calculation of the reference design. Details on the sample size calculation of the reference design for the clinical trial example. (PDF 66 kb)
Additional file 3:Probability of stopping for futility and overall power for Approach 2. Plot of probability of stopping for futility (left figure) and overall power (right figure) for Approach 2 using the futilityβγ-boundaries
αCE
f =0.65 andα MC
f =0.37 for composite endpoint and main component,
respectively. (JPG 238 kb)
Additional file 4:Probability of stopping for futility and overall power for Approach 3. Plot of probability of stopping for futility (left figure) and overall power (right figure) for Approach 3 using the futilityβγ-boundaries
αCE
f =0.69 andα MC
f =0.65 for composite endpoint and main component,
Acknowledgements
We acknowledge financial support by Deutsche Forschungsgemeinschaft and Ruprecht-Karls-Universität Heidelberg within the funding programme Open Access Publishing.
Funding
Not applicable.
Availability of data and materials
Not applicable.
Authors’ contributions
SS developed the methods, conducted the underlying simulations and exemplary applications and was the major contributor in writing the manuscript. MK and GR critically reviewed, discussed and adapted the methodology. All authors read and approved the final manuscript.
Ethics approval and consent to participate
For this type of study formal consent is not required.
Consent for publication
Not applicable.
Competing interests
The authors declare that they have no competing interests.
Publisher’s Note
Springer Nature remains neutral with regard to jurisdictional claims in published maps and institutional affiliations.
Author details
1Institute of Medical Biometry and Informatics, University of Heidelberg, Im
Neuenheimer Feld 130.3, 69120 Heidelberg, Germany.2Institute of Medical
Biometry and Epidemiology, University Medical Center Hamburg Eppendorf, Martinistr. 52, 20246 Hamburg, Germany.
Received: 25 January 2017 Accepted: 30 June 2017
References
1. Pocock S. Group sequential methods in the design and analysis of clinical trials. Biometrika. 1977;64(2):191–9.
2. O’Brien P, Fleming T. A multiple testing procedure for clinical trials. Biometrics. 1979;35(3):549–56.
3. Jennison C, Turnbull B. Group Sequential Methods with Applications to Clinical Trials. Boca Raton: CRC Press; 1999.
4. Snapinn S, Chen M, Jiang Q, Koutsoukos T. Assessment of futility in clinical trials. Pharm Stat. 2006;5(4):273–81.
5. Lan K, Simon R, Halperin M. Stochastically curtailed tests in long–term clinical trials. Seq Anal. 1982;1(3):207–19.
6. Lachin J. A review of methods for futility stopping based on conditional power. Stat Med. 2005;24(18):2747–64.
7. Spiegelhalter D, Freedman L, Parmar M. Bayesian approaches to randomized trials. J R Stat Soc Ser A Stat Soc. 1994;157:357–416. 8. Heitjan D. Bayesian interim analysis of phase ii cancer clinical trials. Stat
Med. 1997;16(16):1791–802.
9. Emerson S, Kittelson J, Gillen D. On the use of stochastic curtailment in group sequential clinical trials. 2005. UW Biostatistics Working Paper Series. Working Paper 243. (See http://biostats.bepress.com/uwbiostat/ paper243/).
10. He P, Lai T, Liao O. Futility stopping in clinical trials. Stat. Interface. 2012;5: 415–23.
11. Pampallona S, Tsiatis A. Group sequential designs for one-sided and two-sided hypothesis testing with provision for early stopping in favor of the null hypothesis. J Stat Plan Infer. 1994;42(1):19–35.
12. Pampallona S, Tsiatis A, Kim K. Spending functions for the type i and type ii error probabilities of group sequential tests. Technical report, Technical Report, Dept. of Biostatistics, Harvard School of Public Health, Boston. 1995.
13. Asakura K, Hamasaki T, Sugimoto T, Hayashi K, Evans S, Sozu T. Sample size determination in group-sequential clinical trials with two co-primary endpoints. Stat Med. 2014;33(17):2897–913.
14. Cheng Y, Ray S, Chang M, Menon S. Statistical monitoring of clinical trials with multiple co-primary endpoints using multivariate b-value. Stat Biopharm Res. 2014;6(3):241–50.
15. Hamasaki T, Asakura K, Evans S, Sugimoto T, Sozu T. Group-sequential strategies in clinical trials with multiple co-primary outcomes. Stat Biopharm Res. 2015;7(1):36–54.
16. Kosorok M, Yuanjun S, DeMets D. Design and analysis of group sequential clinical trials with multiple primary endpoints. Biometrics. 2004;60(1):134–45.
17. Tamhane A, Mehta C, Liu L. Testing a primary and a secondary endpoint in a group sequential design. Biometrics. 2010;66(4):1174–84.
18. Glimm E, Maurer W, Bretz F. Hierarchical testing of multiple endpoints in group-sequential trials. Stat Med. 2010;29(2):219–28.
19. Cook R, Farewell V. Guidelines for monitoring efficacy and toxicity responses in clinical trials. Biometrics. 1994;50(4):1146–52. 20. Jennison C, Turnbull B. Group sequential tests for bivariate response:
interim analyses of clinical trials with both efficacy and safety endpoints. Biometrics. 1993;49:741–52.
21. Chow S, Wang H, Shao J. Sample Size Calculations in Clinical Research. Boca Raton: CRC Press; 2007.
22. Wassmer G. Statistische Testverfahren Für Gruppensequentielle und Adaptive Pläne in Klinischen Studien: Theoretische Konzepte und Deren Praktische Umsetzung mit SAS. Köln: Mönch; 1999.
23. Lan K, DeMets D. Discrete sequential boundaries for clinical trials. Biometrika. 1983;70(3):659–63.
24. Kim K, DeMets D. Design and analysis of group sequential tests based on the type i error spending rate function. Biometrika. 1987;74(1):149–54. 25. Hwang I, Shih W, De Cani J. Group sequential designs using a family of
type i error probability spending functions. Stat Med. 1990;9(12):1439–45. 26. Bretz F, Koenig F, Brannath W, Glimm E, Posch M. Adaptive designs for
confirmatory clinical trials. Stat Med. 2009;28(8):1181–217. 27. Liu G, Zhu G, Cui L. Evaluating the adaptive performance of flexible
sample size designs with treatment difference in an interval. Stat Med. 2008;27(4):584–96.
28. Kieser M, Rauch G. Two-stage designs for cross-over bioequivalence trials. Stat Med. 2015;34(16):2403–16.
29. Brenner B, the RENAAL study Investigators. Effects of losartan on renal and cardiovascular outcomes in patients with type 2 diabetes an nephropathy. N Engl J Med. 2001;345:861–9.
30. Brenner B, Cooper M, de Zeeuw D, Grunfeld J, Keane W, Kurokawa K, McGill J, Mitch W, Parving H, Remuzzi G, et al. The losartan renal protection study–rationale, study design and baseline characteristics of renaal (reduction of endpoints in niddm with the angiotensin ii antagonist losartan). J Renin-Angiotensin-Aldosterone Syst. 2000;1(4):328–35. 31. Koller M, Raatz H, Steyerberg E, Wolbers M. Competing risks and the
clinical community: irrelevance or ignorance? Stat Med. 2012;31(11–12): 1089–97.
32. ICH. Statistical principles for clinical trials - e9. Technical report. 1998. 33. CPMP. Points to consider on multiplicity issues in clinical trials. Technical
report. 2002.