http://www.sciencepublishinggroup.com/j/ogce doi:10.11648/j.ogce.20180605.14
ISSN: 2376-7669 (Print); ISSN: 2376-7677(Online)
Research and Application Effect of High Precision
Contemporanenous Display of River Channel and Sand
Body Technology Based on Algorithm Optimization
Jiaguo Ma, Jun Ming, Jianli Wang, Teng Wang
Tianjin Branch of CNOOC Ltd, Tianjin, China
Email address:
To cite this article:
Jiaguo Ma, Jun Ming, Jianli Wang, Teng Wang. Research and Application Effect of High Precision Contemporanenous Display of River Channel and Sand Body Technology Based on Algorithm Optimization. International Journal of Oil, Gas and Coal Engineering. Vol. 6, No. 5, 2018, pp. 102-109. doi: 10.11648/j.ogce.20180605.14
Received: August 21, 2018; Accepted: September 10, 2018; Published: September 25, 2018
Abstract:
The contemporaneous presentation of river channel, sand body and mud on the seismic attribution slice is the research that seismogeology personnel desire to realize. Especially at the oil field development stage, the research is very important to deploy the location of injection and production well. This paper takes A oil field, Bohai Bay area as the target region, on the basis of negative 90 degree rotation data volume, selects out the best Algorithm to depict river channel and sand body precisely and realizes the river and sand attributes data fusion. Based on this, the relationship between river, sand and mud were contemporaneously presented. Through combined research on well data, it verifies that the profile and slice of seismic data are in accord with well data. Based on this technology, the development and evolution of river channel and the internal structure of point bar were studied, and the historical evolution process of meander river channel was recovered, which provides a strong basis for residual oil research and high production adjusting well deployment.Keywords:
Multi-Attributes Fusion, High Precision Reservoir Prediction, Oilfield Development1. Introduction
Large well spacing and relatively lack of well data is the major features of offshore oilfield, so in-depth application of seismic data to carry out reservoir fine research becomes an important technical means. In fact, in recent years, seismic datas have been widely used in the development of offshore oil fields, such as seismic data combined with production dynamic data to study reservoir configuration, the use of coherent technology and seismic attributes to fine study the distribution of river channel, lateral accretion sand bodies and single point bars, so as to improve the reliability of reservoir research. It is of great significance and application value to guide oilfield development plan and to excavate the potential of remaining oil in old oilfields. With the development of oilfield in the middle-late period, the single sand body attribute, river channel attribute and sedimentary facies can not provide an absolute reliable basis for the decision of the injection and oil well location deployment.
of river sand mud contemporaneously.
2. Oilfield and Seismic Data
The A oilfield is located in the middle part of Bohai bay, and drilled wells reveal the structural amplitude is relatively low, about 40 meters. Vertically, the reservoir is developed, and laterally sand body is large in scale, which is middle - high curved meandering river sedimentary. The main reserves are concentrated in the upper and lower Ming Dynasty. Lithologic reservoirs and structural reservoirs are the mainly reservoirs in the oilfield which are developed by single sand horizontal wells. The comprehensive water cut rate reaches 95% in the middle-late stage of development, and excavate remaining oil is the main means of stable production. According to the differences of the dynamic characteristics of horizontal production wells, the fine depiction of single channel, abandoned channel, single point bar and its internal configuration unit is the primary geological control condition for the study of residual oil law.
Seismic data of target region adopts double-source six-cable collection method. 3D surface element density is 18.75×12.5m, effective bandwidth is 5~110Hz and dominant frequency is about 55Hz. In the process of seismic data processing, the accurate velocity field is used to improve signal to noise. The inverse Q filter is applied to compensate for the high frequency components which is attenuated with the increase of depth, and the maximum frequency bandwidth can be obtained in the effective frequency range as far as possible. After the migration velocity field is set up, smoothed and the drilling velocity is calibrated to obtain high precision migration velocity, the phase shift 3D migration is applied to obtain the ideal interface position effect. By strict control in the process of high resolution data acquisition and processing, seismic data with high density and wide band frequency is obtained, which provides a basis for fine depiction of small scale river and abandoned river.
3. 90 Degree Phase-Shift Technique
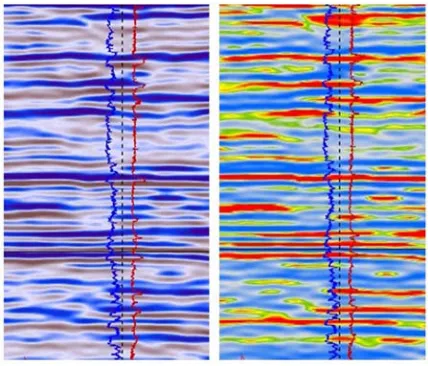
The conventional seismic data is zero phase which has the following cadvantages: the wavelet symmetry, the central lobe consistenting with the reflection interface, and the high resolution. But the zero phase seismic data also has shortcomings: there is no direct correspondence between the sand body and the seismic reflection axis, so the zero phase body is generally used as a structural interpretation, which is not suitable for the study of sand bodies, especially for the thin interbedded sand bodies. The 90 degree phase rotation technology was first proposed by the Zeng hongliu (2005). By phase shifting, the maximum amplitude is referred to the center of the thin layer, so that the main seismic reflection axis corresponds to the center of the geological thin sand layer, that is, the wave peak or the trough on the seismic profile directly corresponds to the top and bot of the sand body (Figure 1), so the seismic phase also has the significance of lithostratigraphy [3]. After 90 degrees phase
rotation, the interpretability of profile is improved, especially the interpretation of thin sand body. In this study, the coherence attribute is extracted from the 90 degree phase-shifting body and displayed along the sand body interpretation layer [4-5], which greatly improves the depiction effect of the final-phase river channel and the abandoned river.
Figure 1. Contrast of zero phase and 90° rotate phase seismic profile.
4. Algorithm Optimization
4.1. River Channel Attribute Optimization
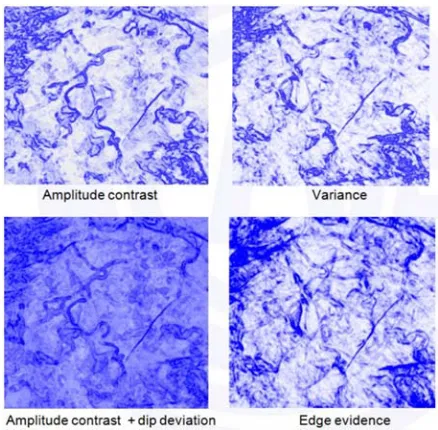
The edge detection attribute is using some mathematical changes to describe the spatial discontinuity of seismic data, and suppression of continuity makes the display of faults and abnormal geological phenomena clear and intuitive. This technique can be used to identify faults, special lithology bodies and river channels, and also helps interpreters quickly recognize the spatial distribution characteristics of faults and lithology in the entire area, so as to improve the speed and precision of interpretation and shorten the exploration period. Commonly used algorithms include ant tracking, edge enhancement, coherence cube and so on. The ESP module of Landmark software adopts the Manhattan distance based coherence algorithm, and its calculation formula is (1). The GeoFrame software adopts the way of obtaining the variance body to reflect the discontinuity of seismic data, and its calculation formula is (2). The amplitude contrast property in Petrel software is an improved coherent algorithm[6-9], which adaptively calculates the three-dimensional amplitude gradient to describe the tiny differences in seismic data, and its calculation formula is (3).
(
)
/2
/2 /2
/2
( , ) 100 k t N
k k d k t N
k t N
k k d k t N
G H
S t d
G H = + + = − = + + = − − = ∗ +
∑
∑
(1)In the formula:
N is the number of data involved in the calculation (time window length (L) / seismic data sampling rate);
t is the current sample point; d is the scanning angle.
/2 2 /2 1 2 /2 2 /2 1 ( ) ( )
j t L I
j t ij j
j t L i
t j t L I
j t ij
j t L i
w x x
w x σ = + − = − = = + − = − = − =
∑
∑
∑
∑
(2)In the formula:
Wj-t is a triangle weight factor function;
the amplitude of seismic data for the j point of i channel; is the average amplitude of all i channel data at j point time;
L is the length of time window to calculate the variance. I is the number of data used to calculate the variance.
2 2 2
x y z
G G weighting G Gon
I
+ + ∗
=
∑
(3)1 0
1
2 0
2
1 0
1
Gx
−
+
A
= −
+ ∗
−
+
1
2
1
0
0
0
1
2
1
Gy
−
−
−
A
=
∗
+
+
+
In the formula:
Gx, Gy and Gy represent the image of edge detection in the direction of X, Y and Z respectively, and I represents the original image.
The results of different algorithms are different. This study makes a comparative study of different algorithms. Finally, the best effect of amplitude contrast plus inclination correction attributes is chosen to describe the river channel. For example, the lower left of Figure 2, compared with other attributes, it can be more clearly depicted the boundary of the ancient river and the abandoned river.
Figure 2. Contraste of different menthod of edge detection.
4.2. Optimization of Sand Body Attributions
Most of the amplitude attributes, spectrum properties and statistical properties can reflect the sand body to a certain extent. The main problem is that whether the accuracy of the boundary of sand body and the internal structure of sand body can meet the demand of research scale. Even the same attribute, different software algorithms are slightly different, and the visual effect maybe not exactly the same. In this paper, on the basis of 90 degree phase shift body, the original amplitude, relative impedance, sweetness, and chaos and other attributes slice are compared with the commonly used RMS attribute. We preferred that the trough integral attribute in Petrel software is clearer and the plane signal to noise ratio is higher. (Figure 3).
Figure 3. a. RMS attribute in GF b. Trough integral attribute in Petrel.
5. River sand Attribute Fusion
5.1. The Effect of River sand Fusion
According to the idea of river and sand fusion, this paper focus on the integration display of river and sand in order to realize the simultaneous display of river sand and mud, to achieve a visual understanding of the underground geological condition, and to provide a reliable basis for the optimization of well position. The attributes of the selected river and sand are fused. From the result of fusion, the attribute of the fusion can clearly identify the distribution of abandoned River and final-phase river channel, and the relationship between the river and the sand body, such as Figure 4.
Figure 4. The effect of river and sand attribute fusion.
5.2. Small Scale Channel Verification
seismic data, we have the following understanding: When the channel width is greater than 100m, the river channel can be identified independently in the seismic section, as shown in Figure 5b, the width of the L channel is about 130m, which can be identified independently on the 90°phase-shifting section. When the width of river channel is more than 25m and less than 100m, for example, the width of the S channel
shown in Figure 5a is about 25m, it is combined with the reflection axis of the underlying sandstone strata in the 90°phase-shifting profile and cannot be identified independently. Leeder's (1973) study of meandering rivers indicates that the width W and depth H of a channel with a curvature greater than 1.7 should satisfy the relationship: W=6.8H1.54
Figure 5. Slice and profile characteristics of small scale river.
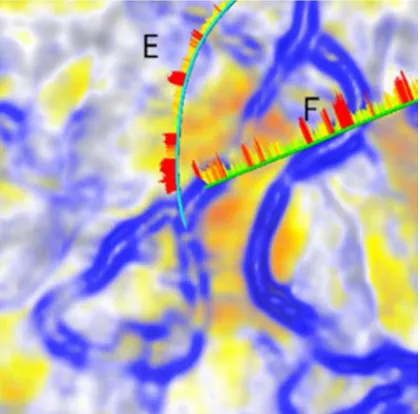
Carefully study the GR curve of the remaining channel drilled by the Well E and F in the study area and found that the peak value of the curve is between pure sand and pure mudstone baseline, which should be siltstone. This infers that the river was gradually losing the role of water flow path and new river gradually formed. In the process of diversion, the final geological record is the streamline position of the remaining channel, which covers on the underlying point bar(Figure 6).
Figure 6. The small scale channel and well logging curve.
5.3. Point Dam Sand Body Verification
channel, point bar, mud, proving that the river channel-point bar fusion can reflect the true subsurface geologic feature
effectively [10] (Figure 7).
Figure 7. Drilling date verified the correctness of fusion date.
6. Application of River Sand Fusion Technology
6.1. Study on Development and Evolution of River
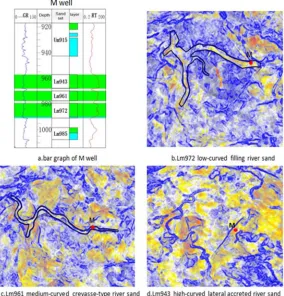
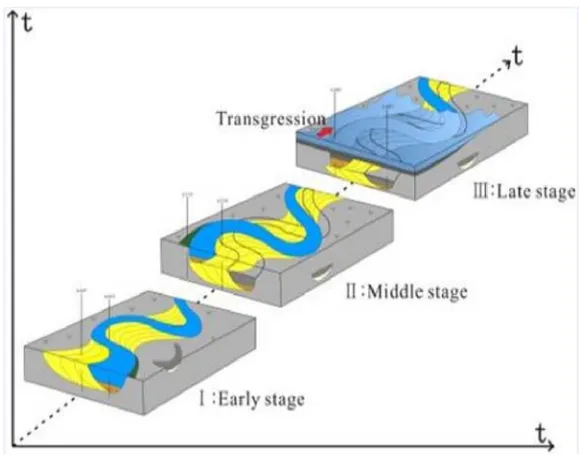
Most researches on river evolution are based on static seismic attribute and well data, while multiplicity of high curved meandering stream makes the evolution research of river channel difficult to approximate to the underground truth. The fusion can trace the development and evolution of iver channel visibly with the resolution ratio of seismic date sampling rate. In the research area, Well M drills sand body Lm972, Lm961 and Lm943 in the early, middle and late phase of the same river, which provides powerful base to study the evolution of river channel. From the fusion slice attribute, it can be seen sand body Lm972 is low-curved filling river sand and the river morphology is clear, as shown in Fig 8b. It evolves into medium-curved crevasse-type river sand in the medium phase, as shown in Fig 8c. It evolves into a high-curved lateral accreted river sand, as shown in Fig 8d. The last phase of mobile water channel is shown in the slice and multi-set lateral accretion body verified by drilling during river channel migration process [11-12].
6.2. Four Dimensional Reconstruction of Channel Evolution in Point Bar
None of the logging patterns correspond uniquely to one particular environment, so the logging facies interpretation must be synthesized with other relative factors. Therefore, the detailed description of abandoned channel and single point bar must be combined with the distribution of phases and the combination of all well log curves because even drilled into the same single point bar, different part of it shows different thickness, logging curve shape and elevation. However, the identification of the abandoned channel and the its plane position can be used to segment the meandering river sand body into a single point bar[13-15]. Recognizing boundaries of abandoned channel truly and directly is the basis for fine study on internal architecture of single point bar within a single river (Figure 9a, b).
a
c
a. Swaying process of partial river channel; b. Formation process of abandoned river channel and point bar;c. Evolution process of river channel space.
Figure 9. Schematic diagram of evolution of end channel and single point bar.
Hence, errors are existing when identify single channel according to the discontinuous interchannel sand, abandoned river channel, the difference of sand thickness or curve shape got from traditional drilling data[16-17]. In the present study, it is found that river channels from different directions may cover on the early deposition at the end of meandering river sedimentary period, and rapid water inflows can preserve the last scene of the ancient river under the quick subsidence condition of mudstone, as shown in Figure9c. So the real situation of the subsurface may be more complex than the current understanding.
According to the precise identification of geological details by the fusion slice, the sedimentary space process of sand body of the meandering river point bar is studied from the angles of the ancient river channel, the abandoned river channel, the initial position of the river, the river flow line and so on, to explain the structure of the interior of the point bar and the space superposition law. The structural analysis of the fluvial facies reservoir is not only in the result level, but is focused on restoring and rebuilding the historical evolution process of meandering river. It makes the anatomical results of the sand body structure more reasonable and credible, and completes the reconstruction of the history of the sedimentary evolution of the single sand layer.
7. Conclusion and Prospect
The research realizes clear and vivid presentation of final-phase river channel and abandoned river through the fusion data, which agrees to the drilling truth and verifies the reliability of fusion volume. Through slicing, the river, sand and mud are displayed at the same time, so as to achieve a visual understanding of the underground geological conditions, and provide important basis for the deployment
of injection and production well position and drilling decision.
Through carefully research on well curve of drilling single river channel and combining with the fusion slice, the paper presents that there may exists error in taking discontinuous river sand, abandoned river channel, sand height difference of river channel and curve morphological difference got by relying on drilling data as four signs of single river channel. The underground truth is complicated. It must be studied by combining with the plane phase position of well and dynamic evolution of river channel.
The meticulous depiction of ancient river channel and abandoned river channel provides reliable basis to research on the interpretation of architectural structure and its spatial superposition law inside the point bar in the perspective of cause process. It provides possibility to make the architectural structure analysis of river phase reservoir not merely stay at result level, but focus on restoring and rebuilding the historical evolution process of meandering river in the perspective of cause and process.
References
[1] ZENG Hongliu. Henry Stephen C, Riola John P. Stratal slicing, partII:Real 3-D seismic data[J]. Geophysics, vol. A63(2), pp. 514- 522, 1998.
[2] ZENG Hong-liu. Seismic Sedimentology in China: A Review[J]. Acta Sedimentologica Sinica, vol. A29(3), pp. 417-423, 2011.
[4] WANG Dawei, LIU Zhen, CHEN Xiaohong, et al. Progress of Seismic Coherence and Its Application to Petroleum Exploration [J]. Geological Science and Technology Information, vol. 24(2):71-76, 2005.
[5] WANG Peng, Gao Wei, Zhang Hongbin. Application of seismic slice evolution technique in A block of Chad [J]. Oil Geophysical Prospecting, vol43(1), pp. 115-118, 2008.
[6] LU Zong qi, LIANG Cheng. Edge Thinning Based on Sobel Operator [J]. JOURNAL OF IMAGE AND GRAPHICS, vol. 5(6):516-520, 2000.
[7] SHI Shu-yuan, HU Su-yun, FENG Wen-jie et al. Building Geological Knowledge Database Based on Google Earth Software[J]. Acta Sedimentologica Sinica, vol. 30(5), pp. 870-877, Oct. 2012
[8] Ma Jiaguo;Hou Dongmei;Jiang Zhiheng. Identification of small-scale latest channel based on seismic attributes [J]. Complex Hydrocarbon Reservoirs, vol. 9(4), pp. 22-25, Dec, 2016.
[9] SUI Xin Guang, ZHAO Minjiao, QU Yonghong. Application of latent power tapping in horizontal wells in remaining oil of thick reservoirs in the later period of strong water sensitivity of Daqing Oil Field [J]. Journal of Daqing Petroleum Institute, vol. 30(1), pp. 112-119, 2006.
[10] SUI Xinguang. A Study on Internal Architecture of Channel Sand in Meandering River [D]. Da Qing petroleum institute, 19-22, 2006.
[11] MA Shi zhong, YANG Qing yan. The Depositional Model, 3-D Architecture and Heterogeneous Model of Point Bar in Meandering Channels [J]. ACTA SEDIMENTOLOGICA SINICA, vol. 18(2), pp. 241-247, 2000.
[12] MA Shi-zhong1, SUN Yu, FAN Guang-juan, et al. The Method for Studying Thin Interbed Architecture of Burial Meandering Channel Sandbody [J]. Acta Sedimentologica Sinica, vol. 26(4), pp. 632-639, 2008.
[13] Ma Shizhong, Lü Guiyou, Yan Baiquan. Research on three-dimensional heterogeneous model of channel sandbody controlled by architecture [J]. Earth Science Frontiers, vol. 15(1), pp. 57-64, 2008.
[14] ZHANG Changmin, YIN Taiju, YU Chen. Reservoir Architectural Analysis of Meandering Channel Sandstone in the Delta Plain Based on the Depositional Process [J]. Acta Sedimentologica Sinica, vol. 31(4), pp. 653-662, 2013.
[15] XIAO Dianshi, ZHANG Feifei, LU Shuangfang, et al. Single channel identification in compound sand bodies by well and seismic data integration:An example in area of Chao 44 region, Fuyu Oilfield [J]. Oil Geophysical Prospecting, vol. 51(1), pp148-158, 2016.
[16] FAN Ting'en, HU Guang yi, MA Liangtao, et al. Architecture pattern characterization of meandering river reservoirs based on high-resolution geostatistics inversion [J]. Oil Geophysical Prospecting, vol. 52(3), pp. 573-582, 2017.