http://www.sciencepublishinggroup.com/j/ajpc doi: 10.11648/j.ajpc.20170606.12
ISSN: 2327-2430 (Print); ISSN: 2327-2449 (Online)
A Study of Gamma Unfolding for PB, HC Single Shields and
Multilayers Containing PB Shield
M. S. Hossain
1, S. M. A. Islam
2, M. Asaduzzaman
1, M. A. Zaman
21Dept. of Physics, Bangladesh Army University of Engineering & Technology (BAUET), Qadirabad Cantonment, Natore, Bangladesh
2Dept. of Physics, Jahangirnagar University, Savar, Dhaka, Bangladesh
Email address:
[email protected] (M. S. Hossain), [email protected] (S. M. A. Islam), [email protected] (M. Asaduzzaman), [email protected] (M. A. Zaman)
To cite this article:
M. S. Hossain, S. M. A. Islam, M. Asaduzzaman, M. A. Zaman. A Study of Gamma Unfolding for PB, HC Single Shields and Multilayers Containing PB Shield. American Journal of Physical Chemistry. Vol. 6, No. 6, 2017, pp. 110-118. doi: 10.11648/j.ajpc.20170606.12
Received: December 29, 2016; Accepted: April 10, 2017; Published: January 15, 2018
Abstract:
The gamma ray spectrum obtained from a 3.7 × 10⁴ Bq 252Cf source after passing through different shielding materials at different thicknesses and different arrangements were detected with a NaI(Tl) detector was fed to a computerized MCA to have a spectrum. This was then stored and subsequently unfolded. The unfolded dose spectra of the fission gamma ray spectrum of the 252Cf source were also measured for some specific shield thicknesses for all the shielding arrangements studied. Theoretical calculations have been performed to study the characteristics of the above mentioned shielding setups by using the three dimensional Monte Carlo computer code MCNP for fission gamma rays. These are then compared with the experimentally obtained values. The agreement is quite satisfactory. Gamma ray fluxes and corresponding dose values have also been calculated. The purpose of the investigation was to determine the effectiveness of the materials and their multilayers as the gamma ray shielding. It has been found that the materials (single layer and multilayer) studied are very effective as the shield for gamma rays.Keywords:
Gamma Unfolding, PB (Poly Boron), HC (Heavy Concrete), PB Single Shields, Multilayers, Monte Carlo Computer Code MCNP, Fission Gamma Rays1. Introduction
Since the discovery of x-rays and radiations from radioactive substances and their harmful effects, shielding against all these penetrating radiations has been a matter of some concern and study. Initial periods of the new subject did not show much promise and it had to wait for due recognition till the nuclear reactors were invented.
Most radiation fields of interest are the combinations of different kinds of radiation. The most significant radiations are [1], fast neutrons, thermal neutrons, primary gamma rays, and secondary gamma rays.
An important factor that is required to be considered in shielding design is the choice of most suitable material from which the main part of the shield should be built and which also satisfies all other requirements. Other factors which are to be considered include the weight of the material, the amount of the material needed for shielding purpose etc.
Main radiation of interest is the primary gamma rays which can best be shielded with lead or other high density materials [2]. And the last one - the secondary gamma rays with an energy of 2.2 MeV are produced as a result of the capture of thermal neutrons by hydrogen.
be developed by forming multilayers of the composite shielding materials.
We consider the shielding phenomenon for gamma rays. There have traditionally been two distinct approaches to the study of gamma ray shielding. The theoretical approach considers the interaction cross section of different materials with a view to developing the required shield specifications. The experimental method generally yields gross results and is concerned only with the total effect on half value thicknesses and build up factors. Similar results were found from single shields and multilayers [4, 5].
The studies of the shielding of gamma ray include theoretical as well as experimental investigations. In reviewing the present trend of studies, it is found that most of the studies have been done on the applied radiation sources requiring shielding. Among all the applied radiation sources, diagnostic x-ray machines got the priority [6].
Shielding experiments have been performed on a few shields for neutron and gamma ray transmission. The results are then compared with those obtained through calculations using MCNP code. The transmission aspects of neutrons and gamma rays have thus been covered.
The 252Cf source, used in the present work has been chosen as it simultaneously emits neutrons and gamma rays. The gamma rays emitted from the 252Cf source have different energies and intensities. Hence it was necessary to identify the components of the gamma rays, and a part of the present work is devoted to this aspect of unfolding study of gamma rays. The total dose due to these gamma rays unfolded in three energy bins, namely, 25, 50 and 100 keV was evaluated.
2. The Concept of Unfolding
The differential pulse height spectrum N(H) observed from any radiation detector is related to (i) the response function, R(H,E) of the detector, and (ii) the energy distribution S(E) of the incident radiation.
N(H) = ∫R(H,E)S(E)dE (1)
The response function usually is dependent on [7] (i) the operating conditions of the detector, (ii) the source detector geometry, and (iii) the detector counting rate.
For the case of a multichannel analyzer we have a different discrete form of the recorded count in the channel (Ni).
Ni = ∑RijSj (2)
Here Rij is the response matrix coupling the ith pulse height interval with the jth energy interval. Sj is the radiation intensity in the jth energy interval.
At times we become interested in deducing the energy distribution of the incident radiation. As the recorded spectrum is made up of M values of Ni we may write M simultaneous equations like the equation (2). Assuming that the response matrix Rij is known, the process solving the equation for all the Sj elements for M ≥ L is known as
spectrum unfolding. Unfolding methods have been thoroughly developed for application area, of spectra recorded by gamma ray spectrometers employing either NaI(Tl) scientillators or Ge(Li) detectors.
2.1. Unfolding Method
a. Mathematical Formulation
If we assume that R is the response matrix then its inverse R-1 is used to convert any pulse height spectrum to photon spectrum. The conversion is achieved in accordance with the following relation:
S(Ei) ∆Ei = ∑ Rij-1 N(Ej) ∆Ej (3)
Here N(Ej) = The number of counts per sec unit pulse height in bin j
Rji-1 = The inverted response elements J = The maximum energy bin converted Now from the equation (2) the operation
S = R-1N (4)
should give the required photon strength, S; but it has a number of disadvantages: (i) direct matrix inversion amplifies small statistical fluctuations resulting in violent oscillations and (ii) sometimes negative strengths of photons in the unfolded spectrum is observed. These disadvantages are avoided by adopting Gold’s iterative technique [8].
b. The Dose Rate
The dose rate D now can be expressed as [9]
D = K (Ei) Ei S(Ei) µa (Ei) dEi (5)
where K(Ei) = a conversion factor, Ei =Photon energy,
S(Ei) = Number of photons calculated per unit energy, per sec and per cm2
µa(Ei) = energy absorption coefficient, defined as
µa(Ei) = Ē
µ(Ei) (6)
In terms of Ki and Ej the dose rate may be expressed as
D = K(Ei) Ēi S(Ei) µ(Ei)dEj (7)
here Ēi = average energy transferred by photons per collision in the medium, and
µ(Ei) = linear absorption coefficient. c. Calculation for R
In the work the response matrix R(H,E) described in Eqn. (2) has been calculated. The following procedure was adopted for the purpose.
The detector used was a 3"×3" NaI(Tl) detector with the following amplifier gains:
Coarse gain = 4 Fine gain = 1
Applied high voltage = 750 volts.
polarity.
The output obtained from the NaI detector was fed to the input of a computerized multi channel analyzer (MCA). The MCA was calibrated using some known sources. Eight different known gamma sources (e.g., 241Am, 109Cd, 54Mn, 57Co, 133Ba, 22Na, 137Cs, 60Co) have been used for the
purpose. Each of the sources were kept at a distance of 5 to 10 cm from the detector. The channels were selected before
calibration and times were also preset. After this, the spectrum was collected for sources of different energy and source strengths keeping the distance between the source and the detector 5 to 10 cm and for a preset time. The spectrum was then stored in the hard disc of the computer. The energies together with the yield per cent of the sources [10] and their distances from the detector has been shown in Table 1.
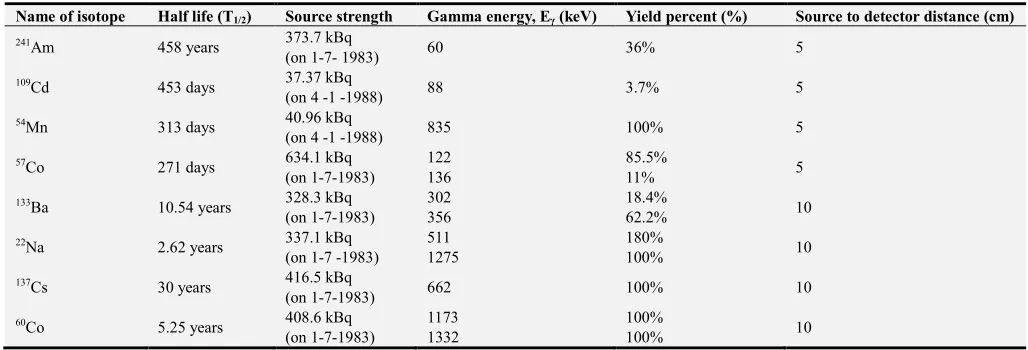
Table 1. Half-life, source strength, energy, yield percent and the distance of the sources from the detector used for the unfolding experiment.
Name of isotope Half life (T1/2) Source strength Gamma energy, Eγ (keV) Yield percent (%) Source to detector distance (cm)
241Am 458 years 373.7 kBq
(on 1-7- 1983) 60 36% 5
109Cd 453 days 37.37 kBq
(on 4 -1 -1988) 88 3.7% 5
54Mn 313 days 40.96 kBq
(on 4 -1 -1988) 835 100% 5
57Co 271 days 634.1 kBq
(on 1-7-1983)
122 136
85.5%
11% 5
133Ba 10.54 years 328.3 kBq
(on 1-7-1983)
302 356
18.4%
62.2% 10
22Na 2.62 years 337.1 kBq
(on 1-7 -1983)
511 1275
180%
100% 10
137Cs 30 years 416.5 kBq
(on 1-7-1983) 662 100% 10
60Co 5.25 years 408.6 kBq
(on 1-7-1983)
1173 1332
100%
100% 10
For each of the above mentioned sources the count spectra were collected by a computerized MCA. Using the software GANNAS and MCA all these spectra were converted from binary to ASCII. The background was then subtracted from all the spectra using the program LOTUS. Total counts for 10 channels of every spectra were calculated using this program. The strength of the sources must be known apriori and its strength on the date of collecting the spectrum was calculated by using the formula:
A = Ao exp (-λt) (8)
=Ao exp (-0.693t/T1/2) where
A = Activity of the source on the date of experiment, Ao = Initial activity (on the date of production), T(1/2) = Half life,
t= Total time elapsed between production and experiment. λ= Decay constant
The number of gamma photons incident on the detector surface was found using the following formula:
S(E) = (A/4π)×(a/r2) (9)
where
A= activity of the source on the date of experiment (a/r2) = solid angle subtended at the source point by the detector
a = surface area of the detector = πd2 (d = detector radius) and
r = source to detector distance.
Therefore, S(E) = number of photons incident per second on the detector = (A/4) × (d/r)2.
If the source is a multiple energy one then the number of photons incident on the detector per second for each energy had to be determined. For this the yield (%) had to be added up for all the energies. S(E) was then divided by the sum of these yield (%) and subsequently multiplied by the yield (%) of the expected energy. The sum of counts of 10 or 20 channels (sum count) was divided by S(E) × total time. This gives the efficiency of the detector per photon.
i.e. Efficiency = [Sum count] / [S(E) × time].
A reasonable question comes up automatically here regarding the channel number up to which the efficiency has to be determined. This varies from source to source and for variation of their energy as well.
The final channel has to be considered as the one up to which the peak area starts. Then the efficiency versus energy curves are to be drawn listing different source energies for different range and efficiency. For this problem graphs are to be drawn one after another for 20 or 30 channels. And from this, efficiencies are to be calculated for both energies and also for all cases. A matrix has to be made for efficiency versus energy from these calculations.
3. The Experiment
different thickness values for a preset time.
4. Results and Discussions
4.1. Unfolding of Gamma Rays: Unfolded Dose Spectra for the Single Shields
a. PB
The unfolded dose spectra of fission gamma after passing through the shield PB of different thicknesses e.g., 4, 16.5, 33.8 and 54 cm are shown in Figure 1. All the four different thicknesses of the shield show the same positions of the peaks. With increasing shield thickness the peak strength decreases. The main peak positions are found between 150 to 450 keV. The peaks have extension on both the sides. On the lower energy side the extension occurs down to 50 keV. The dose rate between 50 to 150 keV is approximately one-third of that in between 150 to 250 keV. On the higher energy side the dose rate falls even at a quicker rate and practically maximum 850 keV gammas also contributes to the total dose.
The total dose values for 4, 16.5, 33.8 and 54 cm shield thicknesses are respectively 12.13, 10.39, 7.58, 2.03 µSv/h. Compared to these 100 keV bin results the corresponding total dose values found for the 50 keV and 25 keV bins are observed to be the same approximately. The values are given in the legends. The peak positions of the main peak of the latter two cases (Figures 2 and 3) are again found to be the same. This means that the maximum number of gamma photons are found to possess energy in between 250 to 350 keV. Even when the shield thicknesses are increased these energy limits do not change although the total number of gamma photons reduce abruptly. In every case peak heights decrease with decrease of energy bins, as expected.
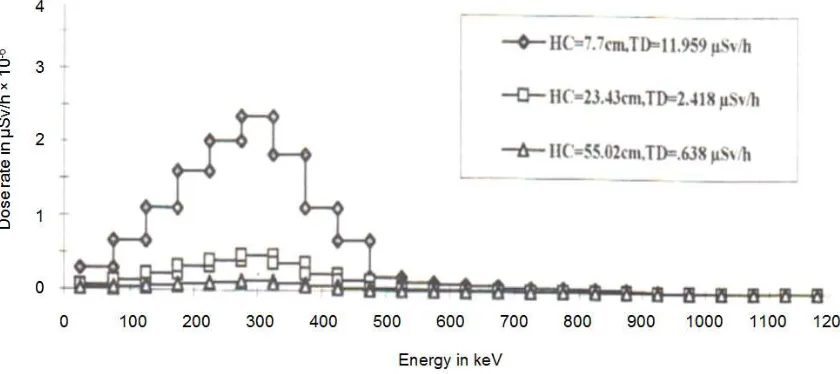
b. HC
As in the previous cases the position of the main peak of the dose spectra of fission gamma after passing through the shield HC is found (Figures 4-5) at 300 keV for the 100 and 50 keV bin cases. The 25 keV bin peak, of course, shifts by around 25 keV towards the lower energy side (Figure 6).
The total dose values of the three different shield thicknesses 7.7, 23.43 and 55.02 cm are approximately the same in all the different bins. These values respectively 11.5594, 2.4183 and 0.6313 µSv/h for the three different shield thicknesses are changed at a very quicker rate with shield thickness. This observation is acceptable as HC being a heavy material is a good gamma shield.
An extra feature observed between 450 to 850 keV for the 100 keV bin spectra (Figure 4) is also present in the 50 and 25 keV bin cases. Gamma photon number for the energy values between 50 to 150 keV is more than that between 450 to 550 keV. This observation is common for all the shielding arrangements. That high energy gamma photon number is less is the effect of the shield. A better shield will prove better suitability in reducing this number. In that way it is expected that HC, being a heavy shield, will act as a good shield for the high energy gamma photons.
The maximum number of gamma photons are found to
possess energy between 250 to 350 keV. This energy range was observed previously for different shield thicknesses and also in the 50 and 25 keV spectra.
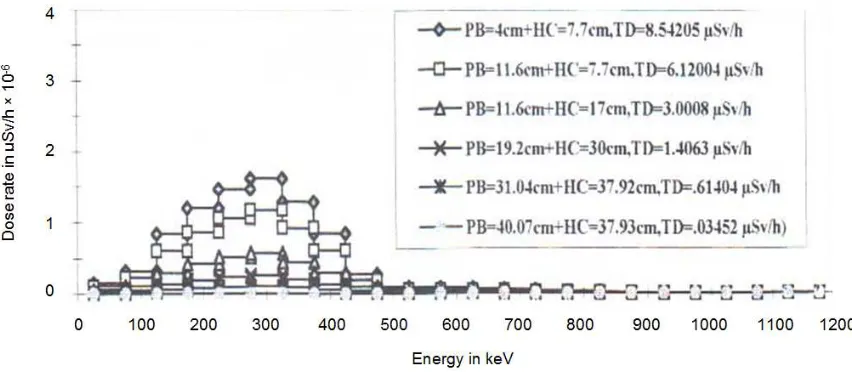
4.2. Unfolding of Multilayers Containing PB
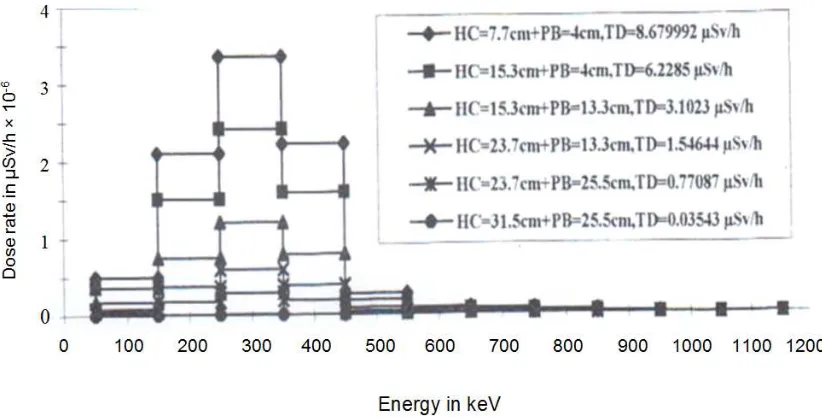
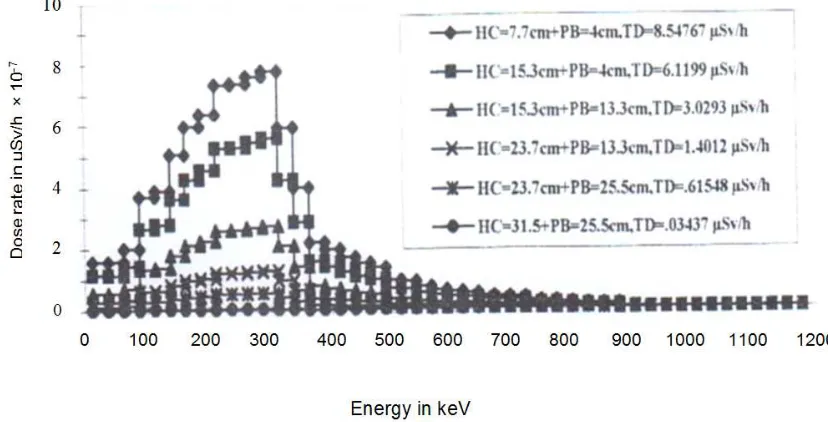
a. Unfolded Dose Spectra for the Shields PB+HC and HC+PB
The unfolded dose spectra (100, 50 and 25 keV bins) of fission gamma after passing through different thicknesses of the shields PB+HC and HC+PB are given in Figures 7-12. The features present in the spectra are characteristics of the component shields. As of the previous cases the maximum number of gamma photons are found to possess energy between 250 to 350 keV.
With shield thickness the spectra are found to be depressed. The depression is also observed due to the reversion of the component shields. If the heavy component shield is placed first depression occurs in the corresponding dose spectrum. The total dose rate values for the different cases are given in the legends. The position of the main peaks together with their relative heights are similar to the previous cases. A comparatively less amount of dose rate values could be observed between 450 to 850 keV energy range. Practically no dose rate value could be observed beyond this energy limits.
Other features like the position of the main peak (250 to 350 keV), fall of the peak at quicker rate on the higher energy side, invariance of the position of higher energy feature are again observed in all the cases of different bins and different shield thicknesses.
When a multilayer is formed by placing the heavier shield first the total dose rate values are found to be less than that of their reversed arrangement. This provocates better suitability of the heavier component shield than the lighter one. The legends of the figures give exact values of the total dose rate.
5. Conclusions
In the present study two single layer shields e.g., PB and HC and their multilayers e.g., PB+HC, and their reversed combination have been studied. Flux spectra and dose spectra for fission gamma rays shielding have been investigated for all the above setups. The unfolded dose spectra of the fission gamma rays were measured for some specific shield thicknesses for these arrangements. MCNP calculations have been done to compare with the experimental measurements.
The fission gamma ray flux spectra of the PB-multilayer shields shows some special features. These features include an initial peak at 0.3 MeV, a trough at 1 MeV, a second small peak observed at 1.5 MeV, a trough at 3 MeV, a third peak at 4 MeV and a constant photon flux between 5 to 10 MeV (Figures 4-12).
In all the shielding arrangements it is observed that the transmitted gamma photons unfolded by using three energy bins, contain maximum number of photons in the range between 250 to 350 keV. On reversing i.e., by forming a multilayer placing the heavier element first, the dose rate values are found to decrease. Beyond the 850 keV energy, practically no gamma photons were observed (Figures 1-12).
The predictions of the MCNP calculations that are carried out for the single as well as multilayer shields are found to agree well with experimental data. On the basis of the above discussions it may be concluded that multilayer shields can be made by adding two single layers alternately - a heavy shield which is able to attenuate gamma rays effectively.
A multilayer containing more than two layers and having a
heavy shield placed first is found to be a better gamma shield compared to its reversed setup. Multilayers are found to be more effective at larger thicknesses of the shields. Characteristics of PB-multilayers for fission gamma rays are found to be dependent on their uncommon component shields. On reversing the components the shielding characteristics change, but the relative characteristics of the uncommon components do not.
For fission gamma ray shielding, for small thickness, HC+PB multilayer shows equal shielding ability as a better choice for gamma ray shielding purpose and this is supported by experiments as well as theoretical ( MCNP ) calculations (Table 2).
Table 2. Gamma Half value, 25% transmission, Tenth value and 5% transmission fission gamma.
Shielding Material 50% transmission 25% transmission 10% transmission 5% transmission
MCNP Expt. MCNP Expt. MCNP Expt. MCNP Expt
PB 44 53.0 74.0 * * * * *
HC 15.0 12.6 24.6 24.2 38.0 39.5 48.0 51.0
PB+HC 25.3 22.2 38.0 40.5 58.5 66.0 74.5 83.5
HC+PB 21.1 19.0 34.9 40.0 54.2 62.5 71.5 81.0
Once the choice is made about the suitable shielding arrangement, the results obtained from the present study in the form of polynomial fits can give the quantitative information about the exact value of the shield thickness necessary. This is one of the beauties of the present investigation.
Figure 1. Unfolded dose spectra (100 keV bin) of fission gamma after passing through different thicknesses of the shield PB.
Figure 3. Unfolded dose spectra (25 keV bin) of fission gamma after passing through different thicknesses of the shield PB.
Figure 4. Unfolded dose spectra (100 keV bin) of fission gamma after passing through different thicknesses of the shield HC.
Figure 6. Unfolded dose spectra (25 keV bin) of fission gamma after passing through different thicknesses of the shield HC.
Figure 7. Unfolded dose spectra (100 keV bin) of fission gamma after passing through different thicknesses of the shield PB+HC.
Figure 9. Unfolded dose spectra (25 keV bin) of fission gamma after passing through different thicknesses of the shield PB+HC.
Figure 10. Unfolded dose spectra (100 keV bin) of fission gamma after passing through different thicknesses of the shield HC+PB.
Figure 12. Unfolded dose spectra (25 keV bin) of fission gamma after passing through different thicknesses of the shield HC+PB.
References
[1] Neutron Gamma Shielding, Reactor Experiments, Inc. USA Catalogue 24, p 2.
[2] F. E. Senetle and P. Philbin, Health Phys., 23(1972)529-532.
[3] R. M. Megahid, Int. Jr. Appl. Radiat. Isot. 36(1985)307-310.
[4] M S Hossain, S. M. A. Islam, M. Asaduzzaman, and M. A. Zaman, A Study of Gamma Unfolding for PB, BX Single Shields and Multilayers Containing PB Shield, NUB Journal of applied Sciences, Vol -3, Issue- 1, May 2016.
[5] M S Hossain, M. A. Quasem, S. M. A. Islam and M. A. Zaman Study of shielding behaviour of some multilayer shields
containing PB and BX, Journal of Applied Physics, India, 2010.
[6] G. F. Knoll, Radiation Detection and Measurements, 1979, John Wiley and Sons, Inc. p 732.
[7] J. H. Hubble, Rev. Sci. Instr. 29(1958)65.
[8] R. Gold, TID, 18304(1963).
[9] C. A. Bisselle, R. A. Karam and J. A. Wethington JR., University of Florida, Gainesville, Fia. Appl. Radiat. Isot., 5(1964)529-539.