ISSN: 2306-9007 Charlotte, Olanrewaju & Ige (2014) 929
I
www.irmbrjournal.com June 2014I
nternationalR
eview ofM
anagement andB
usinessR
esearchVol. 3 Issue.2
R
M
B
R
Students Perception of Service Quality Encountered and their
Future Enrichment: Implication for Academic Quality
Assurance in Nigeria Polytechnics
IRO-IDORO, CHARLOTTE BOSE
Office Technology and Management, Federal Polytechnic, Ilaro, Ogun State Email: [email protected]
Tel: +2348037133216
AYODELE, KOLAWOLE OLANREWAJU
Office of Institutional Effectiveness (OIE) Babcock University Ilishan, Ilishan, Ogun State, Nigeria
Email: [email protected]
Tel: +2348060253428
ORIJA, JAMES IGE
Office Technology and Management Federal Polytechnic Ilaro, Ogun State Tel: +2348057679536
Abstract
Quality is one of the core functions for service organisations, which is an ongoing process of building and sustaining relationships by assessing, anticipating and fulfilling stated and implies needs. It is inevitable to measure the students’ perception on the service quality encountered from Nigerian Polytechnic for their future enrichment. Hence, the present study uses the ‘SERVQUAL’ scale developed by Pariseau & McDaniel (1997) and Tan, et al (2010) to measure the service quality. One thousand eight hundred and fifty (1850) randomly selected students from two Polytechnics in Ogun State, Nigeria took part in the study. Data analysis involved mean and standard deviation as descriptive statistics and Pearson product moment correlation, t-test and regression analysis as inferential statistics. The study showed that the students’ perceptions on service quality encountered are not up to their level of expectations; and there were statistically significant differences in their perception based on gender (t = 2.286, P< 0.05), career choice (t = 5.337, P< 0.05), and on school type (t = 1.581, P>0.05). Also, the results revealed composite (R =.657, R2= .389) contributions of the service quality dimensions on students’ perception of their future enrichment. Tangible (β = .801, t = 7.111, P < .05) has been identified as the most potent predictor of good service quality as compared to other four (4) dimensions; reliability (β = .209, t = 1.614, P < .05), responsiveness (β = .733, t = 5.505, P < .05), assurance (β = .717, t = 5.203, P < .05) and empathy (β = .444, t = 3.181, P < .05). Recommendations and implication for academic quality assurance in Nigeria Polytechnics were given.
ISSN: 2306-9007 Charlotte, Olanrewaju & Ige (2014) 930
I
www.irmbrjournal.com June 2014I
nternationalR
eview ofM
anagement andB
usinessR
esearchVol. 3 Issue.2
R
M
B
R
Introduction
In Nigeria today, education industry (especially public polytechnics) with the sporadic springs of private universities and polytechnics all around is facing an environment characterized by increased competition, changes in student age range, and new social contexts among others. This is making the present moment a critical period in which Polytechnics in Nigeria must deal with the opportunities and threats to ensure their competitiveness.
Higher education institutions share the same characteristics as those of other service businesses. From the student‘s vantage point, the perception of institutional services is inseparable from the people who deliver those services—the service providers. Their services are intangible, heterogeneous, variable, and perishable and the students themselves participate in the service delivery process because they must interact with the service providers (Gronroos, 1992).
Unlike other service businesses, however, many higher education institutions erroneously view students as a captive audience and consider the demand for their educational services as inelastic. As competition intensifies between private, public, and online education providers, the business methods for measuring customer satisfaction will prove valuable to higher education institutions (Shank, Walker, & Hayes, 1995).
According to Combrinck (2006) service quality within education is a subject, which is debated from a number of viewpoints in the literature. Almost all the research undertaken agrees that service quality has many faces and is multi-dimensional. In this regard the following position is taken up by Le Blanc & Nguyen (1997); they state that the design of quality measures for specific service providers should lead to a better understanding of the construct and to the adaptation of quality improvement programmes which correspond to service company needs. From the design perspective, dependable measures of service quality for specific service industries are a viable research strategy to pursue (Brown & Koenig, 1993; Carman, 1990; Cronin & Taylor, 1992; Finn & Lamb, 1991; Zeithaml, 1988). Service quality has five dimensions: Reliability, Assurance, Responsiveness, Tangibles and Empathy.
We tweaked the elements in each of the five dimensions to suit the study in an institution of higher learning as adopted by Adenuga & Ayodele (2012) and Tan, Wong, Lam, Ooi, Ng, (2010). These five dimensions appear as the knowledge and courtesy of the teachers and in their ability to convey trust and confidence to students (assurance), the willingness to perform prompt service to students (responsiveness), the ability to provide accurate and promised service to students (reliability), the appearance of the physical facilities, equipment and personnel (tangibles) and the ability to show care and personal attention to students (empathy).
Educational institutions that are committed to serving students are often focused on the continuous improvement of the students‘ experience. They strive to understand students‘ expectations and anticipate their future requirements. To accomplish these tasks, these educational institutions strive to listen to their students and gather their feedback regarding items such as academics, admissions, rules and policies, facilities, and registration, to name a few.
ISSN: 2306-9007 Charlotte, Olanrewaju & Ige (2014) 931
I
www.irmbrjournal.com June 2014I
nternationalR
eview ofM
anagement andB
usinessR
esearchVol. 3 Issue.2
R
M
B
R
Service Quality Dimensions and Students’ Perception
Assurance: the level of the service delivered to customers that is believable and can be trusted (Parasuraman et al., 1988). It is the ability of lecturers and administrative staff to provide trust and confidence to students.
Responsiveness:It is the level of services provided and able to help customer promptly (Yong, 2000). It involves the willingness to provide prompt or favourable services by the lecturers and administrative staff to students. If not perceived by the students, the services are deemed to have a negative impact.
Reliability:It is the level of the knowledge and information learnt that are accurate (Yong, 2000; Garvin, 1987). If the knowledge learnt from the lecturers is incorrect, inaccurate and not up-to-date, the sharing of knowledge among students will give a negative result, even about the future prospects.
Tangibles: refers to the tangible condition and facilities in higher learning institutions. It involve the presence of equipment and facilities like well-equipped laboratories; adequate stocked library with textbooks, reference books and etc; updated computer facilities; comprehensive information system and also the support facilities like sports and recreation centres. If the equipment and facilities are insufficient and unavailable, the transmission of knowledge will be more challenging.
Empathy: It is the ability of the organization to provide personal attention and care to customers
(Parasuraman et al., 1985; Yong, 2000). The empathydimension of service quality is defined as
showing care and provides individualized attention to students. A good academic environment in a higher learning institution is not only to establish a good teaching and learning culture for sharing of knowledge but also to be able to involve in the student‘s personal development as well as academic matters by giving care and advice.
In a study conducted by Chineze (2012) on students‘ perception of academic staff quality: a measure of quality assurance in South-South Nigerian higher institutions, it was found that the students rated the quality of the academic staff high, especially in terms of professional competence, but rated their supervision low. He also reported that the students felt that the lecturers do not have enough time for students and do not prepare their lectures well.
The study conducted by Adenuga & Ayodele (2012) on the dimensions of service quality on postgraduate students‘ thesis writing in Southwest Nigeria reported that postgraduate students‘ thesis writing was not satisfactory, while significant difference was observed in the students‘ thesis writing which were linked to the service quality experienced. They also reported that all the five variables of the dimensions of service quality significantly contributed to postgraduate students‘ thesis writing.
Statement of the problem
ISSN: 2306-9007 Charlotte, Olanrewaju & Ige (2014) 932
I
www.irmbrjournal.com June 2014I
nternationalR
eview ofM
anagement andB
usinessR
esearchVol. 3 Issue.2
R
M
B
R
service quality encountered on their future enrichment. In specific terms, what would be the implication of the service quality encountered by the students on academic quality in Nigeria Polytechnics?
Research Questions
1. Would there be any significant composite contribution of the service quality dimensions on
students‘ perception of their future enrichment?
2. Would there be any significant relative contribution of the service quality dimensions on students‘
perception of their future enrichment?
3. Would there be any statistical significant difference in students‘ perception of service quality based on gender, career choice, and school type?
4. What are the students‘ perceptions of service quality encountered during their course of program
in the polytechnic?
Methodology
Design
This study employed ex-post – facto research design in which the existing status of the independent variables were only determined during data collection without any manipulation of the variables by the researchers.
Sample
A total of one thousand eight hundred and fifty (1850) respondents, who had spent at least one academic year with their institutions, were selected for the study, using purposive sampling technique. The stratified sampling technique was used to select respondents to reflect strata of the disciplines (course of study), which include the science based and non-science based courses. The proportionate random sampling technique was adopted to select respondents from each of the selected Polytechnics in Ogun State of Nigeria on the basis of population.
1. However, two Polytechnics were selected for the study using purposive sampling method: Federal
Polytechnics Ilaro and Moshood Abiola Polytechnic, Abeokuta, Ogun State. The age range of the respondents is between 17- 28 years with mean age of 19.53 and standard deviation of 7.71. The respondents consist of 1001 (54.1%) males and 849 (45.9%) females. Also, 890 (48.1%) of the respondents were offering science oriented courses while 960 (51.9%) of them were not.
Instrumentation
Two validated instruments were used for collection of data for the study. They are:
Service Quality Dimensions Inventory (SQDI)
ISSN: 2306-9007 Charlotte, Olanrewaju & Ige (2014) 933
I
www.irmbrjournal.com June 2014I
nternationalR
eview ofM
anagement andB
usinessR
esearchVol. 3 Issue.2
R
M
B
R
lecturers give prompt service to students‘ (responsiveness); ‗Good lecturers have students‘ best interest at heart‘ (empathy); ‗Good lecturers perform services right the first time‘ (reliability) and ‗A good faculty has modern equipment‘ (tangibles). The SQDI have a Cronbach alpha‘s value range of .793 and .832 which are greater than .70, thus the measurement of the variables are valid and reliable.
Students’ Perception of Education and Future Enrichment (SPEFE)
SPEFE was a self-developed questionnaire by the researchers to tap into the students‘ perception of the education they are receiving now and the hope of it for the betterment of their lives and communities in
future to come. It is 15-items scales ranging from strongly agree (5) to strongly disagree (1). Sample items
include: ‗I can compete favourably with my colleagues in other higher institutions‘ ‗The education I am receiving today is really preparing me for the future‘ and ‗I can be self-reliant after completing my education in the polytechnic‘. The reliability was ascertained by establishing the test on 100 students of the Polytechnic of Ibadan who are not part of the original study. A spilt half reliability coefficient of 0.77 and validity co-efficient index of 0.81 was obtained (Ayodele & Iro-idoro, 2012). Thus, the instrument was reliable and valid to use.
Administration of the Instruments
The researchers and three (3) other colleagues administered the measuring scales, which guarantee confidentiality and anonymity of the respondents. The researchers consulted with the Registrars and the Deputy Registrars of the selected institutions, in order to intimate them with the purpose of the study. The researchers explained all aspects of the questionnaire to the respondents. The researchers through the help of one officer or the other in the institutions were able to administer the questionnaire with ease. However, it took the researcher a period of two weeks to administer and retrieve the distributed measuring scales. Meanwhile, out of 2000 copies of questionnaire administered in the selected tertiary institutions, 1933 were returned and out these 1850 were adequately filled and valid for the purpose of the study. Thus, 92.5% success of questionnaire administration and retrieval was achieved.
Data Analysis
The data collected through the questionnaires was analyzed using simple percentages and frequency counts for demographic information about the respondents, while research questions were tested using independent t-test and Multiple Regression. However, all the research questions generated for the study were tested at 0.05 alpha levels.
Results
Table 1: Regression Analysis on the combined effect of service quality dimensions on students‘ perception of their future enrichment
Significant at 0.05 alpha level
Results presented in Table 1 show the composite contribution of the service quality dimensions on students‘ perception of their future enrichment. The total variance accounted for by the predictor variables
Regression Analysis of Variance
Analysis Source SS MS DF Beta F
R = 0.667 Regression 1526.425 305.285 5
R2 = 0.513 Residual 23743.344 12.876 1844 0.377 23.710
ISSN: 2306-9007 Charlotte, Olanrewaju & Ige (2014) 934
I
www.irmbrjournal.com June 2014I
nternationalR
eview ofM
anagement andB
usinessR
esearchVol. 3 Issue.2
R
M
B
R
on students‘ perception of future enrichment is 51.3% (R2 = 0.513). Analysis of variance shows that this value is significant (F = 23.710, P > .05). Therefore, 51.3% of the total variability in students‘ perception of their future enrichment is accounted for by service quality dimensions.
Table 2: Beta Coefficients and t ratio for relative contribution the service quality dimensions on students‘ perception of their future enrichment
Unstandardized Coefficients
Standardized coefficient
Model B SE Beta t-ratio Sig
(constant) Assurance Responsiveness Reliability Tangibles Empathy 2.003 .282 .366 .293 .388 .300 .109 .031 .058 .036 .077 .043 .256 .343 .280 .361 .287 9.111 .918* 1.234* .991* 1.389* 1.035* .000 .010** .028* .000* .017* .031**
a. Dependent variable: students‘ perception of their future enrichment; *Significant at <.05
Table 2 shows the relative contribution of each predictor variable to the variance in students‘ perception of their future enrichment. Tangible has the highest beta value (β = .361; t = 1.389; p < .05) significant at less than .05 alpha level; followed by responsiveness (β = .343; t = 1.234; p < .05), empathy (β = .283; t = 1.035; p < .05); reliability (β = .280; t = .991; p < .05); and lastly by assurance (β = .256; t = .918; p < .05). Therefore, all the service quality dimensions are potent factors to students‘ perception of their future enrichment.
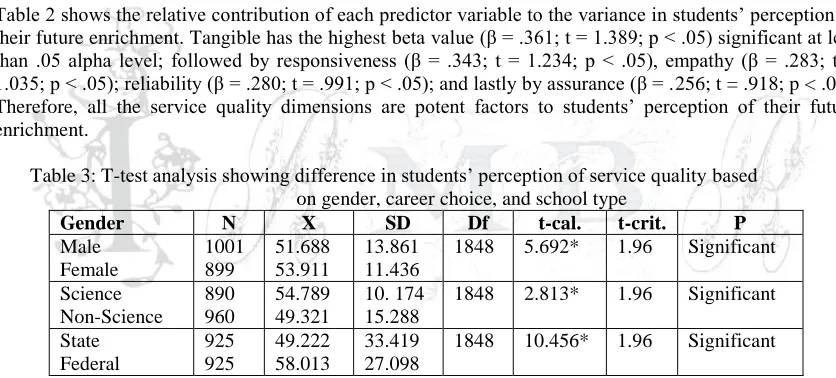
Table 3: T-test analysis showing difference in students‘ perception of service quality based on gender, career choice, and school type
Gender N X SD Df t-cal. t-crit. P
Male Female 1001 899 51.688 53.911 13.861 11.436
1848 5.692* 1.96 Significant
Science Non-Science 890 960 54.789 49.321 10. 174 15.288
1848 2.813* 1.96 Significant
State Federal 925 925 49.222 58.013 33.419 27.098
1848 10.456* 1.96 Significant
The results presented in Table 3 revealed that the obtained value of t is 5.692 for the gender difference in the students‘ perception of their future enrichment based on the service quality encountered which is greater than the t- critical value of 1.96 at 1.96 degree of freedom and 0.05 level of significance. This implies that there is a significant gender difference. Further analysis of the result based on the respondents‘ mean scores reveal that female students with average mean score of 53.911 expected more than their male counterparts with a mean score of 51.688 in terms of service quality encountered.
The section that measures the difference between science and non-science students revealed that science students with an average mean score of 54.789 shows that they perceived the service quality encountered better than their non-science counterparts with a mean score of 49.321. Therefore, there is a significant difference between science and non-science students on service quality encountered.
ISSN: 2306-9007 Charlotte, Olanrewaju & Ige (2014) 935
I
www.irmbrjournal.com June 2014I
nternationalR
eview ofM
anagement andB
usinessR
esearchVol. 3 Issue.2
R
M
B
R
perceived the service quality encountered better than their state counterparts with a mean score of 49.222. Therefore, there is a significant difference in students‘ perception of service quality based on school type.
Table 4: Students‘ Perception of Service Quality on their Future Enrichment
Variable N Minimum Maximum Mean Std. Dev
Service quality encountered 1850 22.00 65.00 28.333 12.019
Table 4 reveals that students‘ perceptions of service quality encountered during their course of program in the polytechnic with a mean score of 54.333 (43.589%), which is not really satisfactory. This is because it is less than 50%, though higher than the minimum score of 22 which is 33.846%. It could then be deduced generally that students‘ perceptions of service quality encountered during their course of program in the polytechnic is not encouraging and satisfactory, which may be as a result of some factors inherent in the students or in the school.
Discussion of Findings
This study examined the students‘ perception on the service quality encountered from Nigerian Polytechnic for their future enrichment. It provides a picture of service quality in Nigerian polytechnics as perceived by the students who are the primary consumer of the services based on the five service quality dimensions in SERVQUAL model as proposed by Parasuraman et al. (1985) in association with the knowledge sharing as a tool for continuous improvement in fulfilling or exceeding the students‘ expectation (Adenuga & Ayodele; Tan, Wong, Lam, Ooi, Ng, 2010).
Results of the students‘ perceptions of service quality encountered during their course of program in the polytechnic is not encouraging and satisfactory, while there are composite and relative contributions of the service quality dimensions on students‘ perception of their future enrichment. The magnitude of the relationship between the service quality dimensions in predicting students‘ perception of their future enrichment is reflected in the values of coefficient of multiple regression (R2= .513; F = 23.710, P > .05). As for the extent to which each of the five independent variables contributed to the prediction, it could be concluded that all the service quality dimensions are potent factors to students‘ perception of their future enrichment, while tangible and responsiveness are potent than the others. This finding corroborates the findings of Al-Naggar, et al (2012); Chineze (2012); and Adenuga &Ayodele, (2012) who reported that success and completion of any academic endeavour among tertiary students to a large extent depend on the intellectual environment of the departments, access to equipment, level of research funding available, lecturer-students‘ relationship, among other things.
The results of the students‘ perception of their future enrichment based on gender, field of study, and school type revealed demographic effects. This finding lends credence to the findings Adenuga & Ayodele (2012), Al-Naggar, et al (2012); Yong, (2000); Garvin, (1987).
Conclusion and Recommendations
ISSN: 2306-9007 Charlotte, Olanrewaju & Ige (2014) 936
I
www.irmbrjournal.com June 2014I
nternationalR
eview ofM
anagement andB
usinessR
esearchVol. 3 Issue.2
R
M
B
R
The important role of assessing service quality in Nigeria higher institution cannot be over emphasized in achieving quality education and fostering students‘ satisfaction. Therefore, there is need for tertiary education service providers to participate in service quality training that promotes friendly and caring service, problem solving, flexibility, and recovery from mistakes, which are critical elements to building student satisfaction and promoting quality education all year round.
Also, students‘ academic need is not only the major services students expect to find satisfactory in schools, social, and emotional needs are of equal importance. As such, there is a need for the institution‘s executive management team to paying ―lip service‖ to the overall development of the students in our schools. This can be achieved by having functional counseling centers or students support services.
References
Adenuga, A & Ayodele, K (2012). Service Quality Dimensions and Thesis Writing among Postgraduate
Students in South-West Nigeria. Universal Journal of Education and General Studies, 1(7), 188-194.
Available online http://www.universalresearchjournals.org/ujegs
Al-Naggar, R, Al-Sarory, S, Al-Naggar, A & Al-Muosli, M (2012) Doctorate International Students‘ Satisfaction and Stress on Academic Supervision in a Malaysian University: a Qualitative Approach.
Educational Research, 3, 3, 264-269.
Bourke S, Holbrook A, Lovat T, Dally K (2004). Characteristics, Degree Completion Times and Tthesis Quality of Australian Ph.D. Candidates. Paper presented at the Quality in Postgraduate Research Conference: Re-imagining Research Education, Adelaide, South Australia.
Buttery E, Richter E, Filho W (2005). An Overview of the Elements that Influence Efficiency in
Postgraduate Supervisory Practice Arrangements. International Journal of Educational Management,
19, 7–26.
Chineze M. Uche (2012). Students‘ Perception of Academic Staff Quality: A Measure of Quality
Assurance in South-South Nigerian Higher Institutions. International Journal of Educational Science,
4(2): 163-173.
Gasson S, Reyes L (2004). Ph.D. Completion within four years. Paper presented at the Quality in Postgraduate Research Conference: Reimagining Research Education, Adelaide, South Australia.
Harman G (2002). Producing Ph.D. Graduates in Australia for the Knowledge Economy. Higher
Education Research and Development, 21, 1, 179–190.
Heath T (2002). A Quantitative Analysis of PhD students‘ views of Supervision. Higher Education
Research and Development, 21, 1, 41–53.
Leonard D, Metcalfe J, Becker R, Evans J (2006). Review of literature on the Impact of Working Context and Support on the Postgraduate Research Student Learning Experience. New York, NY: The Higher Education Academy.
Li S, Seale C (2007). Managing Criticism in Ph.D Supervision: A Qualitative Case Study. Studies in Higher Education, 32, 4, 511–526.
Ijaiya, Y. (2001). From Quality Control to Quality Assurance: A Panacea for Quality Education in Nigeria
System. In: NA Nwagwu, EP Ehimametah, MA Ogunu, M Nwadieni (Eds.): Current Issues in
Educational Management inNigeria. Benin City: NAEAP, pp. 150-161.
Kumaran, P & Anbazhagan B (2011) A Study on Quality in Higher Education: Student's Perspective
Journal for Bloomers of Research, Vol. 3, No. 2,222-226
Mbakwem, J. & Okeke, F. (2007). Enhancing internal and External Quality Assurance Mechanism in Nigerian Universities through ICT Compliance. In: JB Babalola, GD Akpa, AO Ayeni, SO Adedeji
(Eds.): HigherEducation. Ibadan: NAEAP, pp. 307-315.
ISSN: 2306-9007 Charlotte, Olanrewaju & Ige (2014) 937
I
www.irmbrjournal.com June 2014I
nternationalR
eview ofM
anagement andB
usinessR
esearchVol. 3 Issue.2
R
M
B
R
Nek, K., Salomawati, I., Ahmad, Z. (2010) Motivation, Empowerment, Service Quality and Polytechnic Students‘ Level of Satisfaction in Malaysia. International Journal of Business and Social Science, 1, 1, 120-128
Okorie, N., & Uche, C. (2004). Total Quality Management (TQM) in education: Its imperatives and key
content. In: POM Nnabuo, NC Okorie, OG Agabi, LEBIgwe (Eds.): Fundamental of Educational
Management. Owerri: Versatile Publishers, pp. 43-78.
Pearson M, Brew A (2002). Research Training and Supervision Development. Studies in Higher Education
27, 135–150.
Pearson M, Kayrooz C (2005). Enabling Critical Reflection on Supervisory Practice. International Journal
ofAcademic Development, 9, 99–116.
Tan, B., Wong, C., Lam, C., Ooi, K., Chee-Yee Ng, F (2010). Assessing the link between Service Quality
Dimensions and Knowledge Sharing: Student perspective.African Journal of Business Management,
4, 6, 1014-1022.
Vilkinas T (2005). The Supervisor‘s Role as Manager of the Ph.D. Journey. In P. Green (Ed.), Supervising Postgraduate Research: Contexts and processes, theories and practices (pp. 163–177). Melbourne, Australia: RMIT University Press.
Wright T, Cochrane R (2002). Factors Influencing Successful Submission of Ph.D. Thesis. Studies in Higher Education, 25, 182– 195.
Zainal AN (2007). Challenges in Ph.D Studies: The Case of Arts Student. European Journal of Social Sciences, 5, 2, 83-93.