Published online December 22, 2014 (http://www.sciencepublishinggroup.com/j/ijmi) doi: 10.11648/j.ijmi.20140206.14
ISSN: 2330-8303 (Print); ISSN: 2330-832X (Online)
Computed tomography evaluation of urinary stones
densities compared to in vitro analysis of its chemical
composition
Hamdy Ibrahim
1, Nagwa Wilson
2, Mahmoud Abdel Wahab
3, Haney Heneidy
4, *1
Departments of urology, Faculty of Medicine, Fayoum University, Fayoum, Egypt 2
Department of Radiology, McGill University, Montreal, Canada 3
Department of Biochemsitry, Faculty of Medicine, Fayoum University, Fayoum, Egypt 4
Department of Radiology, Medical Research Institute, Alexandria University, Alexandria, Egypt
Email address:
[email protected] (H. Ibrahim), [email protected] (N. Wilson), [email protected] (M. Wahab), [email protected] (H. Heneidy)
To cite this article:
Hamdy Ibrahim, Nagwa Wilson, Mahmoud Abdel Wahab, Haney Heneidy. Computed Tomography Evaluation of Urinary Stones Densities Compared to in Vitro Analysis of Its Chemical Composition. International Journal of Medical Imaging. Vol. 2, No. 6, 2014, pp. 141-145. doi: 10.11648/j.ijmi.20140206.14
Abstract:
Purpose: The aim of the study was to compare between the urinary stones of different chemical composition and their radio-densities (Computed Tomography attenuation values or Housefield Units). The prediction of the stone type would in turn lead to better selection of the interventional modalities. Materials & Methods: A retrospective review was performed for patients who underwent pretreatment Non Contrast Computed Tomography scan for urinary stones. When measuring stone density in Hounsfield unit (HU) on Computed Tomography, a Standard Deviation (SD) was calculated for the measured area of interest that contained several pixels and a standardized area of interest of 0.026 cm2, equivalent to 25 pixels, was used. Determination of chemical constituents of stones/fragments was done using Fourier Transform Infrared Spectroscopy (FT-IR spectroscopy). Our laboratory report indicated stones of mixed composition by listing the components in rank order with quantification of their presence and we compared the Hounsfield density of the stones with the chemical findings. Results: The chemical composition of uric acid, mixed oxalate and calcium oxalate monohydrate stones was accurately identified based on the absolute Computed Tomography value. The mean Housefield Unit (HU) density for uric acid stone was 459±80, which was considerably lower than those of other stones. Mixed oxalate calculi could be distinguished from uric acid, calcium oxalate monohydrate and apatite stones by the absolute Computed Tomography value (the mean Housefield Unit density was 777±224). Moreover, calcium oxalate monohydrate stones were easily distinguished from all stones using the absolute Computed Tomography value (the mean Housefield Unit density was 1158±156) except when compared to apatite containing stones, which were not commonly encountered. The difference of Computed Tomography value, among the above-mentioned stones, was statistically significant (p<0.001). Conclusion: This study demonstrated that Computed Tomography scanning could predict the chemical composition of urinary stones. The Hounsfield density was a convenient radiographic measure that correlated well with the chemical composition. A significant correlation between the stone size and Housefield Unit values was also demonstrated.Keywords:
Stones, Density, Infrared Spectroscopy, Chemistry1. Introduction
There is considerable interest in using radiologic imaging to predict kidney stone fragility before treatment. Non contract computerized tomography (NCCT) is currently the preferred method for investigating suspected renal colic, and may be used to identify stone composition. Accurate
142 Hamdy Ibrahim et al.: Computed Tomography Evaluation of Urinary Stones Densities Compared to in Vitro Analysis of Its Chemical Composition
However, what is needed is preoperative knowledge of stone composition while the stone is still in situ. Predicting urinary stone composition based on some type of preoperative imaging has been studied by various investigators. Spiral computerized tomography (CT) has been used to identify accurately calculus composition in vitro.1, 2 Knowledge of stone composition in vivo may affect the choice of therapy because some hard stones are not amenable to extracorporeal shock wave lithotripsy. 3
As determined from standard NCCT, stone density may provide prognostic information on stone fragility and shock wave lithotripsy (SWL) success. High resolution computed tomography (CT) and micro CT technology can predict stone composition and internal structure.2,4,5
The purpose of our study was to compare the CT density of stones (expressed in Hounsfield units [HU]) in vivo and their chemical composition using infrared spectrophotometry as the reference standard.
2. Materials and Methods
A retrospective review was performed for patients who underwent different treatment modalities for urinary stones. The local institutional review board approved the study. Fifty one patients with known urolithiasis (44 men and 7 women; 20 patients had a single stone and 31 had multiple stones) underwent multi-detector CT (MDCT) examination for evaluation of the stone characteristics. All patients who were subsequently treated with extracorporeal shock wave lithotripsy (n = 12), percutaneous nephrolithotomy (n = 13), ureterorenoscopy either flexible or semi-rigid (n = 25) and one underwent cystolithotripsy, were included in the analysis. For these 51 patients, infrared spectrophotometry of the collected stones was performed.
2.1. The Imaging Protocol
All examinations were performed with a Philips MDCT
(Brilliance CT 16-slice system). Imaging protocol consisted
of an unenhanced spiral scan on the whole abdomen, acquired along the craniocaudal direction, with the patient in the supine position. Technical parameters for the unenhanced abdominal scan were as follows: tube voltage 120 kVp; reference tube current 250 mA with automatic exposure control: pitch factor 0.9:1; acquisition slice thickness 5 mm; reconstruction slice thickness 1.5 mm; reconstruction increment 1.5 mm, gantry rotation time 0.5 second; filter kernel B30f (medium smooth); field of view 35 cm; and detector configuration 24 × 1.2 mm. Scanned images were analyzed on a PACS workstation by 2 independent radiologists.
All the examinations were visualized on the axial, coronal, and sagittal planes. For each patient, we evaluated the number, location (kidney, ureter, or bladder), maximal diameter, and CT density (expressed in Hounsfield units [HU]) of stones. For each calculus the maximal axial or coronal diameter was measured to the closest 0.1 mm. Measurements were recorded at 2 window settings, including
standard soft tissue window (window width-320 and window level-50), standard bone window (window width-1, 120 and window level-300).
Stone attenuation in Housefield Unit (HU) was determined from a pretreatment NCCT image that represented the stone in its largest diameter. Mean stone attenuation was calculated from 3 non overlapping regions of interest (area 0.026 cm2 or 25pixels) chosen for stones > 1 cm. Relatively smaller stones ≤ 1 cm, consistent areas of interest (25 pixels) were centrally chosen to minimize the volume averaging that occurs when measurements include the stone edge. The SD for each attenuation measurement was also determined as a measure of stone heterogeneity
2.2. The Laboratory Protocol
The chemical constituents of the stones were determined using FT-IR spectra (NICOLET AVATAR STONE ANALYSER).
Preparation of sample for analysis: Each sample from the
homogenized stone was mixed with potassium bromide to form a standard (transparent) pellet used for infrared analysis.
Analyzing a sample: From the OMNIC application, the
spectrum of the sample to be analyzed is selected. The software then would begin to analyze the spectrum selected. A summary of the analysis results and a reliability index would appear immediately below the table of data. Our laboratory report indicated stones of mixed composition by listing the components in rank order with quantification of their presence.
2.3. Statistical Analysis
Collected data were computerized and analyzed using Statistical Package for Social Science (SPSS) version 16. Descriptive statistics were used to describe variables; percent, proportion for qualitative variables. Mean, Standard Deviation (SD) and range for Quantitative variables. Comparison of quantitative variable HU density between groups was done using independent t- test for 2 groups and the Analysis of Variance (ANOVA) test followed by post-hoc tests for more than two groups. Two Way ANOVA test was done to explore interaction between factors. P-Values with significance of less than 5% were considered statistically significant.
3. Results
A total of 51 patients were included in the study; 29 (56.8%) with kidney stones, 21 (41.2%) with ureter stones and one (2%) with bladder diverticulum; the characteristics of which are summarized in Table 1. The mean stone length was 16.8±12.6 mm (range, 4–57 mm), and the mean stone CT density was 871 ± 333.8 HU (range, 309–1585 HU).
(OMUA), and 11 pure uric acid (UA) stones. The groups
Stone composition Stone site
Kidney Ureter
MOAp 5 (9.8) 2 (3.9)
Cystine 0 (0) 1 (2)
OM 9 (17.6) 6 (11.8)
OMOD 6 (11.8) 10 (19.6)
OMUA 1 (2) 0 (0)
UA 8 (15.7) 2 (3.9)
Total 29 (56.9) 21 (41.
Mixed oxalates with apatite (MOAp), calcium oxalate monohydrate mixed oxalate monohydrate and oxalate dihydrate (OMOD), mixed oxalate and uric acid (OMUA), uric acid (UA) stones.
The HU values for different types of calculi are shown in Table
2
. From the least to the most denseuric acid (UA) stones, mixed oxalate stones (OMOD), pure calcium oxalate monohydrate (OM), and oxalates apatite (MOAp).
The mean HU density for uric acid stone was 459±80, which was considerably lower than those of other stones. Mixed oxalate calculi could be distinguished from uric acid,
Table 2. HU Density of the stones according to their chemical compositions
Stone composition Mean density Std. Deviation
MOAp 7 (13.7) 1164.7143 245.36144 OM 15 (29.4) 1158.0000 156.32978 OMOD 16 (31.4) 777.2500 224.17449 UA 11 (21.6) 459.4545 80.18898 Total 51 (100) 871.0784 333.80772
Table 3 represents the P values for the differentiation of stone composition using the absolute HU
containing stones (the mean HU density was 1164±245) could be differentiated from mixed oxalate stones (P<0.027) and from pure uric acid stones (P<0.001). Also, rega
calcium oxalate monohydrate stones with the mean HU
Table 3
Stone type
MOAp
OM
Fig.1(a)
Fig. 1(a, b, c and d) 33 years old male presented with right loin pain and hematuria
window and (d) bone window CT images demonstrate the presence of multiple calculi, the largest in the renal pelvis with mixed monohydrate. The Housefield density for the larger stone
pure uric acid (UA) stones. The groups with one calculus were excluded
Table 1. The characteristics of the stones
Stone size (mm) CT Density ( HU)
Ureter Bladder ≤ 10 > 10 ≤ 1000
2 (3.9) 0 (0) 2 (3.9) 5 (9.8) 2 (3.9) 0 (0) 1 (2) 0 (0) 1 (2) 6 (11.8) 0 (0) 4 (7.8) 11 (21.6) 3 (5.9) 10 (19.6) 0 (0) 11 (21.6) 5 (9.8) 14 (27.5)
0 (0) 1 (2) 0 (0) 1 (2) 2 (3.9) 1 (2) 3 (5.9) 8 (15.7) 11 (21.6)
(41.1) 1 (2) 22 (43.1) 29 (56.9) 32 (62.7)
Mixed oxalates with apatite (MOAp), calcium oxalate monohydrate (OM), (OMOD), mixed oxalate
The HU values for different types of calculi are shown in . From the least to the most dense they were; pure uric acid (UA) stones, mixed oxalate stones (OMOD), pure and oxalates with
The mean HU density for uric acid stone was 459±80, which was considerably lower than those of other stones. Mixed oxalate calculi could be distinguished from uric acid,
calcium oxalate monohydrate and
by the absolute CT value (the mean HU density was 777±224). Moreover, calcium oxalate monohydrate stones were easily distinguished from all stones using the absolute CT values (the mean HU density was 1158±156) except when compared to apatite containing stones
commonly encountered. The difference of CT value among the above-mentioned calculi was statistically significant (p<0.001). Thus, the chemical composition of uric acid, mixed oxalate and calcium oxalate monohy
accurately identified based on the absolute CT value.
HU Density of the stones according to their chemical compositions
Std. Deviation Std. Error 95% Confidence Interval for Mean Lower Bound Upper Bound 245.36144 92.73791 937.7928 1391.6358 156.32978 40.36418 1071.4275 1244.5725 224.17449 56.04362 657.7958 896.7042 80.18898 24.17789 405.5829 513.3262 333.80772 46.74243 777.1935 964.9634
values for the differentiation of stone composition using the absolute HU values;
apatite-stones (the mean HU density was 1164±245) could be differentiated from mixed oxalate stones (P<0.027) and from pure uric acid stones (P<0.001). Also, regarding the calcium oxalate monohydrate stones with the mean HU
density of 1158±156, it could be differentiated from mixed oxalate stones and pure uric acid stones (P<0.000). Thus, apatite containing stones and calcium oxalate monohydrate were differentiated from mixed oxalate stones and pure uric acid stones, but not from each other.
3. Multiple Comparisons: Dependent Variable; HU Density
Other stone compositions Significance
OMOD .027
UA .001
OMOD .000
UA .000
Fig.1(b) Fig.1(c)
old male presented with right loin pain and hematuria. (a)Axial soft tissue window, (b) bone window, (C) axial soft tissue window and (d) bone window CT images demonstrate the presence of multiple calculi, the largest in the renal pelvis with mixed
for the larger stone was 1124 HU and for the smaller one was 1172.
excluded from the statistical analysis.
CT Density ( HU)
Total
> 1000
5 (9.8) 7 (13.7) 0 (0) 1 (2) 12 (23.5) 15 (29.4) 2 (3.9) 16 (31.4) 0 (0) 1 (2) 0 (0) 11 (21.6) 19 (37.3) 51 (100)
calcium oxalate monohydrate and apatite containing stones by the absolute CT value (the mean HU density was 777±224). Moreover, calcium oxalate monohydrate stones were easily distinguished from all stones using the absolute (the mean HU density was 1158±156) except d to apatite containing stones, which were not commonly encountered. The difference of CT value among calculi was statistically significant Thus, the chemical composition of uric acid, mixed oxalate and calcium oxalate monohydrate stones were accurately identified based on the absolute CT value.
Interval for Mean
Min. Max. Upper Bound
1391.6358 822.00 1585.00 1244.5725 864.00 1468.00 488.00 1264.00 309.00 586.00 309.00 1585.00
could be differentiated from mixed oxalate stones and pure uric acid stones (P<0.000). Thus, apatite containing stones and calcium oxalate monohydrate from mixed oxalate stones and pure uric acid stones, but not from each other.
Significance
Fig.1(d)
144 Hamdy Ibrahim et al.: Computed Tomography Evaluation of Urinary Stones Densities Compared to in Vitro Analysis of Its Chemical Composition
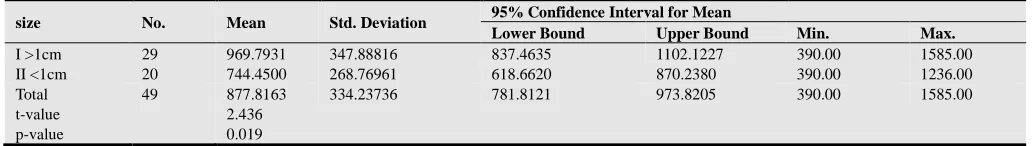
Further statistical analysis has been done to assess the effect of stone size on CT density; group I those with stones size > 1 cm and group II in which stones < 1 cm. There were
significant correlations between the stone size and HU values regardless the stone type (t-value=2.436, P-value=0.019) as shown in table 4.
Table 4. Correlations between the stone size and the HU values
size No. Mean Std. Deviation 95% Confidence Interval for Mean
Lower Bound Upper Bound Min. Max.
I >1cm 29 969.7931 347.88816 837.4635 1102.1227 390.00 1585.00
II <1cm 20 744.4500 268.76961 618.6620 870.2380 390.00 1236.00
Total 49 877.8163 334.23736 781.8121 973.8205 390.00 1585.00
t-value 2.436
p-value 0.019
4. Discussion
Previous knowledge about the chemical composition of urinary stone is an essential part of the preoperative evaluation. The nature of the stone influences the management and postoperative recurrence prevention.6-8 Determination of stone component is of particular importance because many uric acid stones could be treated with urinary alkalinization while the surgical treatment being reserved for stones that are resistant to conservative management. On the other hand, calcium-containing stones and cysteine stones of certain attenuation are extremely difficult and are hard to fragment with Shock Wave lithotripsy (SWL). CT could be used not only for diagnosis of urinary tract stones regarding its location and size, but used to determine stone composition as well.9-11
In a previous study done by Hidas et al, they classified urinary stones to three groups: uric acid, cysteine and calcium stones and measured the attenuation ratio for each of them using a multi-detector CT scan. They concluded that multi-detector CT depicts the composition of urinary stones.6
Bellin et al10performed a helical CT assessment for urinary stones with analysis of the CT attenuation density using a single energy CT and found that stone composition was correctly differentiated from calcium stones and uric acid stones on the basis of different attenuation values. They found that attenuation value was lower in uric acid stones and higher in calcium stones. They showed success in differentiating uric acid, cystine, calcium oxalate monohydrate (COM) and brushite calculi with accuracy rate exceeding 85%. This was in agreement with our study, which showed that the oxalates with apatite (MOAp) stones, stones of pure calcium oxalate monohydrate (COM), mixed oxalate stones (OMOD) and pure uric acid (UA) stones could be differentiated by the HU density. The differences were statistically significant.
The mean HU density of the uric acid stone (459±80) was considerably lower than those of other stones. The Mixed oxalate calculi were distinguished from uric acid, calcium oxalate monohydrate and apatite containing stones by the absolute CT value (777±224), while the calcium oxalate monohydrate stones were easily distinguished from all stones (1158±156). The difference of CT value among the above-mentioned calculi was statistically significant (p<0.001).
Thus, the chemical composition of uric acid, mixed oxalate and calcium oxalate monohydrate stones were accurately identified based on the absolute CT value.
A pilot study on renal stone assessment with dual energy multi-detector CT, done by Boll et al, studied the CT density range of uric acid and mixed calcium stones and concluded that analysis of low- or high-energy DE multi-detector CT attenuation values alone was not enough to enable us to identify mixed renal calculi on the basis of attenuation profiles alone, whereas clusters of attenuation profiles for pure uric acid stones, cystine calculi, and struvite concretions were identified even though partial overlap of attenuation value clusters was found. This means that dual energy study is not a must in study of stone composition using CT density.13
On the other hand, Kambadakoneet al9 reported that, differentiation among stones was more complicated and less reliable in vivo and it was dependent on the size and accurate placement of the region of interest. Furthermore, attenuation measurement became more complicated in stones of mixed composition (35%–65% of stones). They assumed that stones of mixed composition, as well as struvite, cystine, and calcareous stones, had overlapping attenuation ranges in vivo while our study did not show the same results.9,14 They also stated that the most important factors influencing decisions regarding urologic intervention were stone location, size, composition, and patient symptoms.
In the literature, there were no reports correlating between stone size and its density as a predictor to its composition. However, in our study we tried to figure out a relationship between the stone size and the HU values, we found that the larger the stone size, the more the stone density would be. There was a significant correlation between the stone size and HU values regardless to the stone type (t-value=2.436, P-value=0.019).
averaging of adjacent organs.16
In our study we adjusted our technique to minimize volume averaging at the stone periphery by measuring stone attenuation in a small region of interest of area and taking the standard deviation (SD) of each attenuation measurement as previously detailed in methodology.
5. Conclusion
This study demonstrates that, CT scanning can predict the chemical composition of urinary stones. The Hounsfield density is a convenient radiographic method, which correlates well with the chemical composition. A significant correlation between the stone size and HU values were also demonstrated. The prediction of the stone type would help in treatment planning.
References
[1] Mostafavi MR, Ernst RD, Saltzman B. Accurate determination of chemical composition of urinary calculi by spiral computerized tomography.J Urol. 1998; 159:673-675. [2] Saw KC, McAteer JA, Monga AG, Chua GT, Lingeman JE,
Williams JC,Jr. Helical CT of Urinary Calculi: Effect of Stone Composition, Stone Size, and Scan Collimation. Am J Roentgenol. 2000; 175:329.
[3] Williams J,James C., Saw KC, Paterson RF, Hatt EK, McAteer JA, Lingeman JE. Variability of renal stone fragility in shock wave lithotripsy. Urology. 2003; 61:1092-1096. [4] Williams JC Jr, Kim SC, Zarse CA, McAteer JA and
Lingeman JE: Progress in the use of helical CT for imaging urinary calculi. J Endourol, 2004; 18 (10): 937-941.
[5] Williams J,J C., Saw KC, Monga AG, Chua GT, Lingeman JE, McAteer JA. Correction of helical CT attenuation values with wide beam collimation: in vitro test with urinary calculi. AcadRadiol. 2001; 8:478-483.
[6] Hidas G, Eliahou R, Duvdevani M, et al. Determination of renal stone composition with dual-energy CT: in vivo analysis and comparison with x-ray diffraction. Radiology. 2010;257:394-401.
[7] Manglaviti G, Tresoldi S, Guerrer CS, et al. In vivo evaluation of the chemical composition of urinary stones using dual-energy CT. AJR.American journal of roentgenology. 2011;197:W76-W83.
[8] Graser A, Johnson TRC, Bader M, et al. Dual energy CT characterization of urinary calculi: initial in vitro and clinical experience. Invest Radiol. 2008; 43:112-119.
[9] Kambadakone AR, Eisner BH, Catalano OA, Sahani DV. New and evolving concepts in the imaging and management of urolithiasis: urologists' perspective. Radiographics : a review publication of the Radiological Society of North America, Inc. 2010;30:603.
[10] Bellin M, Renard-Penna R, Conort P, et al. Helical CT evaluation of the chemical composition of urinary tract calculi with a discriminant analysis of CT-attenuation values and density. EurRadiol. 2004;14:2134-2140.
[11] Sheir KZ, Mansour O, Madbouly K, Elsobky E, Abdel-Khalek M. Determination of the chemical composition of urinary calculi by noncontrast spiral computerized tomography. Urol Res. 2005; 33:99-104.
[12] Mostafavi MR, Ernst RD, Saltzman B. Accurate determination of chemical composition of urinary calculi by spiral computerized tomography. J Urol. 1998; 159:673-675. [13] Boll DT, Patil NA, Paulson EK, et al. Renal stone assessment
with dual-energy multidetector CT and advanced postprocessing techniques: improved characterization of renal stone composition--pilot study. Radiology. 2009; 250:813-820. [14] Da Silva SFR, Silva SL, Daher EF, Silva Junior GB, Mota
RMS, Bruno da Silva CA. Determination of urinary stone composition based on stone morphology: a prospective study of 325 consecutive patients in an emerging country. Clinical chemistry and laboratory medicine: CCLM / FESCC. 2009; 47:561.
[15] Williams JC, Paterson RF, Kopecky KK, Lingeman JE, McAteer JA. High resolution detection of internal structure of renal calculi by helical computerized tomography. J Urol. 2002;167:322-326.