
Formulation and evaluation of gastroretentive floating tablets of venlafaxine hydrochloride
7
0
0
Full text
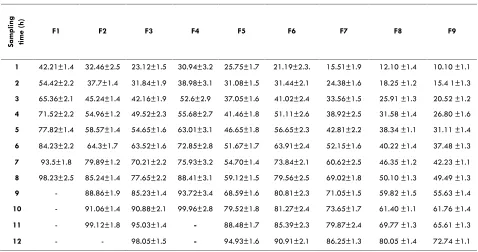
(2) 77 Evaluation of tablet properties The prepared tablets were tested for Weight variation, Hardness (Monsanto hardness tester), Thickness (Vernier caliper), Friability (Roche Friabilator) and drug content. Floating property The tablets were placed in a 100 ml beaker containing 0.1N HCl. The time required for the tablet to rise to the surface and float was determined as floating lag time and total duration of time by which dosage form remain buoyant is called total floating time12. In vitro Drug Release Study The release rate of Venlafaxine HCl floating tablets was determined using USP Type 2 Apparatus. The dissolution test was performed in triplicate, using 900ml of 0.1N HCl, at 37± 0.5˚C at 50 rpm for 12 hrs. A 5ml sample was withdrawn from the dissolution apparatus at specified time points and the samples were replaced with fresh dissolution medium. The samples were filtered through a 0.45µm membrane filter and diluted if necessary. Absorbance’s of these solutions were measured at 224 nm using U.V-Visible Spectrophotometer. Mechanism of drug release To analyze the mechanism of the drug release rate kinetics of the dosage form, the obtained data were fitted into zeroorder, first order, Higuchi, and Korsmeyer Peppas release model. FT-IR spectroscopy Study The infrared spectra of Venlafaxine HCl pure drug, physical mixture of optimized formulation were recorded between 400 to 4000cm-1 on FT-IR Spectroscopy. The IR spectra for the test samples were obtained using KBr disc method using an FT-IR spectrometer.. Results and Discussion. The powder blend of nine formulations (F1 to F9) was evaluated for angle of repose, bulk density, tapped density, carr’s index and hausner ratio showed the pre-compressed blend has good flow property (Table 2).. and linearly correlated with the weight of the tablets. Friability test of all the formulations was found satisfactory showing enough resistance to the mechanical shock and abrasion. Drug content uniformity in all formulations was calculated and the presence of active ingredient ranged from 97-99%. Evaluation of buoyancy of the tablets The in vitro buoyancy studies in pH 1.2, revealed good buoyancy for all the formulations (Table 4). Citric acid and sodium bicarbonate combination was used as the effervescent base. Upon contact with the acidic medium, the fluid permeated into the tablet, causing neutralization reaction to occur, which generates carbon dioxide (CO 2). The swelling polymer traps the CO2 so generated and thus provides continued buoyancy. Preliminary studies were done to estimate the ideal amount of the effervescent base needed to obtain short floating lag time together with prolonged buoyancy. This revealed that citric acid and sodium bicarbonate in the amount 10 mg and 70 mg were optimum for the desired formulation to provide good buoyancy with floating lag time less than a minute. All the tablets floated in the buffer solution for more than 12 h. The gas generating base decreases the lag time by accelerating the hydration of the swelling polymer, thus allowing a higher floating duration because of constant generation and subsequent trapping of CO2. Citric acid was used to accelerate the CO2 generation; also it permits the generation of CO2 even if the gastric pH is abnormally high13. In vitro dissolution studies of all formulations are depicted in table 5. Formulation F1, F2 and F3 prepared with HPMC K4M were done in 0.1 N HCl and the drug release from formulations F3 was 98.05 in 12 h, formulations F1 and F2 unable to sustain the drug release for desired period of time this was considered due to different polymer concentrations in all the three formulations. All these three formulations floated for 12 h. Formulations F1 and F2 failed to show desired drug release profile. Formulation F3 showed the desired drug release profile and floated with a lag time of 30 sec, for this reason it was considered as best formulation among all the three formulations(Figure 1).. The physical evaluation parameters and drug content were also tested for the tablets (Table 3).The total weight of each formulation was maintained constant; the weight variation of the tablets were within the permissible limits of 7.5%, as specified for tablet weighing less than 325 mg . Weight of the tablet was fixed at 250 mg and the weight variation for every batch was tested and found within the acceptable limits. Hardness of the tablet was fixed 4kg/cm2 and was maintained for all the batches in order to minimize the effect of hardness on the drug release because the effect of polymer concentration is the only area of interest.. In vitro dissolution study of formulations F4, F5 and F6 prepared with HPMC K15M were done in 0.1N HCl and the drug release from formulations F5 and F6 was 94.93 and 90.91 in 12 h respectively. Formulation F4 unable to sustain the drug release within the desired period of time. On the other hand formulations F5 and F6 failed to meet the desired drug release profile. In vitro dissolution study of formulations F7 to F9 prepared with HPMC K100M were also done in 0.1N HCl and the drug released was calculated. The results indicated that higher viscosity grade of polymer concentrations retarded greatly release of drug (Figure 2, 3).. Tablet thickness was also used to assess the quality of tablets. Under uniform conditions of manufacture, the total weight of tablet and thickness were linearly related. The thickness of floating tablets ranged from 3.18 to 3.50 mm. The above results were in good agreement by study of Sunada and Xu14 who reported that HPMC contents was the predominant controlling factor as the HPMC content. Int. J. Pharm & Ind. Res. Vol - 01. Issue - 02. Apr - Jun 2011.
(3) 78 increased, the drug release rate decreased and vice versa. An increase in polymer concentration causes increase in viscosity of the gel as well as the gel layer with longer diffusion path. This could cause a decrease in effective diffusion coefficient of the drug and a reduction in drug release rate. Formulations containing higher HPMC viscosity grades have slower drug release rates when compared to formulations with lower HPMC viscosity grades i.e. formulations F1, F2, F3 containing HPMC K4M have showed the fastest and formulations F7, F8, F9 containing HPMC K100M showed the slowest drug release rates. The amount of drug released for a particular drug polymer ratio was found to be in the order of K4M > K15M> K100M.. FT-IR spectra of the Venlafaxine HCl and drug with HPMC K4M revealed that there is no shifting of the peaks indicating the compatibility of the HPMC K4M polymer with the drug (figure 4a, 4b). Floating tablet of venlafaxine HCl was formulated as an approach to increase gastric residence time and there by improve its bioavailability. Formulation F3 showed better controlled drug release in comparison to the other formulations, the extent of drug release was found to be 98.05% at the desired time 12 hrs. The drug release pattern of formulation F3 was best fitted to Korsmeyer-Peppas model and first order kinetics. Further the results reflect that release of drug from the tablets by non-fickian diffusion or anomalous diffusion. Drug-excipient interaction of formulations F3 was carried out by using FT-IR spectroscopy in these analysis drug-excipients interactions was not observed. Hence it was concluded that formulation F3 can be taken as an ideal or optimized formulation of gastroretentive tablets for 12 hours as it fulfils all the requirements for extended release tablet.. The mechanism of release for the optimized formulations was determined by finding the R 2 value for each kinetic model viz. Zero-order, First-order, Higuchi, and Korsmeyer-Peppas corresponding to the release data of formulations (Table 6). For most of the formulations the R 2 value of KorsmeyerPeppas and first-order model is very near to 1 than the R 2 values of other kinetic models. Thus it can be said that the drug release follows Korsmeyer-Peppas and first-order model mechanism.. Acknowledgement. Authors are thankful to Mr.Usha Kiran Kumar,M.Tech., President, Browns college of pharmacy, Khammam for providing the facilities for completion of this research work. We the authors extent our thanks to Lupin pharmaceuticals, Pune for their gift sample of venlafaxine HCl.. The n-values of Korsmeyer-Peppas model of the best formulations are in between 0.55-0.85. Therefore the most probable mechanism that the release patterns of the formulations followed was non-fickian diffusion or anomalous diffusion.. Table: 1 Formulation composition of floating tablets of venlafaxine Ingredients (mg/tablet) Venlafaxine HCl HPMC K4M HPMC K15M HPMC K100M Sodium bi carbonate Citric acid MCC Mg.Stearate Talc. F1. F2. F3. F4. F5. F6. F7. F8. F9. 37.5 37.5 70 10 90 2.5 2.5. 37.5 75 70 10 52.5 2.5 2.5. 37.5 112.5 70 10 15 2.5 2.5. 37.5 37.5 70 10 90 2.5 2.5. 37.5 75 70 10 52.5 2.5 2.5. 37.5 112.5 70 10 15 2.5 2.5. 37.5 37.5 70 10 90 2.5 2.5. 37.5 75 70 10 52.5 2.5 2.5. 37.5 112.5 70 10 15 2.5 2.5. Table: 2 Flow properties of powder blends Formulation F1 F2 F3 F4 F5 F6 F7 F8 F9. Int. J. Pharm & Ind. Res. Angle of Repose 28.13 25.45 28.67 30.89 24.34 23.13 28.15 29.67 30.90. Bulk Density 0.486 0.468 0.431 0.463 0.521 0.541 0.561 0.421 0.458. Vol - 01. Tapped Density 0.614 0.623 0.591 0.591 0.632 0.642 0.632 0.621 0.581. Carr’s Index 18.12 19.43 22.10 24.67 17.32 18.45 21.78 28.68 25.90. Issue - 02. Hauser Ratio 0.154 0.142 0.065 0.110 0.146 0.098 0.141 0.056 0.078. Apr - Jun 2011.
(4) 79 Table: 3 Physical evaluation parameters and drug content Formulation code. Hardness (Kg/cm2). Thickness (mm). Weight Variation (mg). Friability (%). Drug Content (%). Table: 4 Buoyancy of Venlafaxine HCl tablets. F1 F2 F3 F4 F5 F6 F7 F8 F9. 4.5±0.24 3.75±0.18 4.45±0.37 3.80±0.26 4.55±0.54 4.40±0.35 4.50±0.48 4.45±0.25 4.50±0.50. 3.384±0.4 3.276±0.6 3.186±0.3 3.186±0.4 3.234±0.6 3.45±0.06 3.38±0.05 3.45±0.25 3.50±0.04. 248.60 ±5.12 249.33±4.45 245.80±4.63 246.09±2.43 248.05±4.51 245.37±3.89 250.09±4.12 246.65±4.20 244.15±4.61. 0.1 0.27 0.19 0.22 0.18 0.21 0.16 0.16 0.12. 97.23 99.12 98.32 99.54 99.43. 98.67 98.97 98.28 99.43. Formulation code. Lag time (sec). F1 F2 F3 F4 F5 F6 F7 F8 F9. 26 20 30 36 28 39 46 49 51. Total floating time (h) >12 >12 >12 >12 >12 >12 >12 >12 >12. Sampling time (h). Table:5 In vitro dissolution studies: Cumulative percent drug release of formulation with HPMC K4M. F1. F2. F3. F4. F5. F6. F7. F8. F9. 1. 42.21±1.4. 32.46±2.5. 23.12±1.5. 30.94±3.2. 25.75±1.7. 21.19±2.3.. 15.51±1.9. 12.10 ±1.4. 10.10 ±1.1. 2. 54.42±2.2. 37.7±1.4. 31.84±1.9. 38.98±3.1. 31.08±1.5. 31.44±2.1. 24.38±1.6. 18.25 ±1.2. 15.4 1±1.3. 3. 65.36±2.1. 45.24±1.4. 42.16±1.9. 52.6±2.9. 37.05±1.6. 41.02±2.4. 33.56±1.5. 25.91 ±1.3. 20.52 ±1.2. 4. 71.52±2.2. 54.96±1.2. 49.52±2.3. 55.68±2.7. 41.46±1.8. 51.11±2.6. 38.92±2.5. 31.58 ±1.4. 26.80 ±1.6. 5. 77.82±1.4. 58.57±1.4. 54.65±1.6. 63.01±3.1. 46.65±1.8. 56.65±2.3. 42.81±2.2. 38.34 ±1.1. 31.11 ±1.4. 6. 84.23±2.2. 64.3±1.7. 63.52±1.6. 72.85±2.8. 51.67±1.7. 63.91±2.4. 52.15±1.6. 40.22 ±1.4. 37.48 ±1.3. 7. 93.5±1.8. 79.89±1.2. 70.21±2.2. 75.93±3.2. 54.70±1.4. 73.84±2.1. 60.62±2.5. 46.35 ±1.2. 42.23 ±1.1. 8. 98.23±2.5. 85.24±1.4. 77.65±2.2. 88.41±3.1. 59.12±1.5. 79.56±2.5. 69.02±1.8. 50.10 ±1.3. 49.49 ±1.3. 9. -. 88.86±1.9. 85.23±1.4. 93.72±3.4. 68.59±1.6. 80.81±2.3. 71.05±1.5. 59.82 ±1.5. 55.63 ±1.4. 10. -. 91.06±1.4. 90.88±2.1. 99.96±2.8. 79.52±1.8. 81.27±2.4. 73.65±1.7. 61.40 ±1.1. 61.76 ±1.4. 11. -. 99.12±1.8. 95.03±1.4. -. 88.48±1.7. 85.39±2.3. 79.87±2.4. 69.77 ±1.3. 65.61 ±1.3. 12. -. -. 98.05±1.5. -. 94.93±1.6. 90.91±2.1. 86.25±1.3. 80.05 ±1.4. 72.74 ±1.1. Data represents mean ± SD (n=3) Table 6 Release kinetics of optimized formulations. S. No.. Formulation. Zero order. First order. Higuchi. Korsmeyer & Peppas. Peppas (n). 1. F3. 0.9668. 0.9850. 0.9887. 0.9943. 0.585. Int. J. Pharm & Ind. Res. Vol - 01. Issue - 02. Apr - Jun 2011.
(5) 80 Figure: 1 Cumulative % Drug release. 120 100 80. F1. 60. F2 F3. 40 20 0 0. 2. 4. 6. 8. 10. 12. 14. Time(h). Cumulative % drug release from HPMC K4M. Cumulative % Drug release. Figure: 2 120 100 80. F4. 60. F5 F6. 40 20 0 0. 2. 4. 6. 8. 10. 12. 14. Time (h). Cumulative % drug release from HPMC K15M Figure: 3 Cumulative % Drug release. 120 100 80. F7. 60. F8 F9. 40 20 0 0. 2. 4. 6. 8. 10. 12. 14. Time (h). Cumulative % drug release from HPMC K100M. Int. J. Pharm & Ind. Res. Vol - 01. Issue - 02. Apr - Jun 2011.
(6) 81 Figure: 4.a. Figure: 4.b. The FT-IR spectra: 4. a) pure drug, 4.b) Physical mixture of optimized formulation. Int. J. Pharm & Ind. Res. Vol - 01. Issue - 02. Apr - Jun 2011.
(7) 82. Reference. 1. Sood A, Panchagnula R. Design of Controlled Release Delivery Systems Using a Modified Pharmacokinetic Approach: A Case Study for Drugs having a Short Elimination Half-life and a Narrow Therapeutic Index. Int J Pharm. 261, 2003, 27-41. 2. Garg S, Sharma S. Gastroretentive Drug Delivery Systems. Buisness Briefing: Pharmatech. 1, 2003, 160166. 3. Singh BN, Kim KHJ. Floating Drug Delivery System: An Approaches to Oral Controlled Drug Delivery via Gastric Retention. Contr Release. 63, 2000, 235-259. 4. Keith S. Advances in Psychotropic Formulations. Prog Neuro Psycopharmacol Biol Psych. 30, 2006, 996-1008. 5. ric AM J, Moyer A, Haskins JT, Andree TH,.Husbands GEM. Biochemical, Neurophysiological, and Behavioral Effects of Wy-45,233 and other Identified Metabolites of the Antidepressant Venlafaxine. Drug Dev. Res. 23, 1991, 191-199. 6. Simona JS, Aguiar LM. Extended Release Venlafaxine in Relapse Prevention for Patients with Major Depressive Disorders, J Psychiatr Res. 38, 2004, 249-257. 7. Troy S.M, Parker VD, Fruncillo RJ, Chiang ST, The Pharmacokinetics of Venlafaxine When Given in a Twicedaily Regimen. J Clin Pharmacol. 35, 1995, 404-409.. Int. J. Pharm & Ind. Res. Vol - 01. 8. Shah D, Shah Y, Rampradhan M. Development and Evaluation of Controlled Release Diltiazem Hydrochloride Microparticles Using Cross-linked Poly Vinyl Alcohol. Drug Dev Ind Pharm. 23, 1997, 567-564. 9. Aulton ME and Wells TI. Pharmaceutics: The science of Dosage Form Design. Churchill Livngstone, London,1998, pp. 247-248. 10.Lachman L, Liberman HA, Kanig JL. The Theory and Practice of Industrial Pharmacy, Lea and Febiger, Philadelphia, 1987, pp. 317-318. 11.Cooper J, Gunn C. Powder flow and compaction: Tutorial pharmacy, CBS Publishers and Distributiors, New Delhi, 1986, p.p. 211-213. 12.Ponchel R, Irache JM. Specific and Non-Specific Bioadhesive Particulate System for Oral Delivery to the Gastrointestinal Tract. Adv Drug Del Rev., 34, 1998, 191219. 13.Groning R, Bernyten M. Estimation of the Gastric Residence Time Magnetic Dosage Forms Using the Heidlberg Capsule. pharmazie. 51, 1996, 328-331. 14.Xu G, Sunada H. Influence of Formulation Change on Drug Release Kinetics from Hydroxypropylmethyl Cellulose Matrix Tablets. Chem Pharm Bull. 43, 1995, 483-487.. Issue - 02. Apr - Jun 2011.
(8)
Figure
Related documents
( لكش 2 ماظنب ايرتكبلا صيخشت) E Api 20 5 - ةينقتب صيخشتلا Vidas UP Salmonella(SPT) مغرلا ىلع نم قئارطلا لامعتسا ةيديلقتلا يف فشكلا لامعتسا اثيدح متي هنا لاا
“Synthesis of Fe 2 O 3 nanoparticles by planetary ball mill method and their catalytic activity in the thermal decomposition of ammonium perchlorate”,
The variables assessed in this study were duration of menopause, menopausal symptoms such as sleep disruption, hot flushes, night sweats, and mood swings; body mass
In Ryther's hypothesis it was shown that if a phytoplankton community was governed by small flagellates, then the number of links in any subsequent food chain
We explored statistical and spectral analysis on HRV, HR, R-H, P-H, PRQ, QRS, QT, QTC and ST segments derived from ECG signal to investigate which segments should be considered for
randomized controlled trial of fall prevention by a high-intensity functional exercise program for older people living in residential care facilities.. Wagner LM, Capezuti E, Taylor
We also compared the AUC of machine learning using the network topology to the logis- tic regression based on the standard financial measures (non-network information): firm
The most important problem in our case was the emergency treatment of bleeding esophageal varices in a patient with portal hypertension secondary to portal vein thrombosis..
