Benchmarking and Assessment Working Group 2014 Progress Report
November 2014
Current Members:
Kate Willett (Chair) UKMO Hadley Centre, UK Claude Williams NCDC, USA
Ian Jolliffe Exeter Climate Systems, University of Exeter, UK
Robert Lund Department of Mathematical Sciences, Clemson University, USA
Lisa Alexander Climate Change Research Centre, University of New South
Wales, Australia
Stefan Brönnimann University of Bern, Switzerland
Lucie A. Vincent Climate Research Division, Environment Canada, Canada Steve Easterbrook Department of Computer Science, University of Toronto,
Canada
Victor Venema Meteorologisches Institut, University of Bonn, Germany David Berry National Oceanography Centre, Southampton, UK
Rachel Warren College of Engineering, Mathematics and Physical Sciences, University of Exeter, UK
Giuseppina Lopardo, Istituto Nazionale di Ricerca Metrologica (INRiM), Italy Renate Auchmann Oeschger Center for Climate Change Research & Institute of
Geography, University of Bern, Switzerland
Enric Aguilar Centre for Climate Change, Universitat Rovira i Virgili, Spain
Matt Menne NCDC, USA
Colin Gallagher Department of Mathematical Sciences, Clemson University, USA
Zeke Hausfather Berkeley Earth, USA
Thordis Thorarinsdottir Statistical Analysis, Pattern Recognition, and Image Analysis (SAMBA), Norwegian Computing Centre, Norway
Peter Thorne (ex-officio) – NERSC, Norway
New Members: NA
Ex-Members: NA
October 2013 to October 2014 Objectives:
1) Submit Benchmark Cycle concepts paper to GIMDS.
2) Finalise the fully functioning open source software for producing the analog-clean-worlds and submit a methods paper.
3) Create a first suite of analog-clean-worlds (open and blind).
5) Create a first suite of analog-error-worlds (open and blind).
6) Finalise assessment statistics and statistical tools and create software for assessing the results of tests on the benchmarks ready for the Benchmark cycle. 7) Have a prototype working assessment framework by Summer 2014.
8) Create a platform for guiding users of the benchmarks in how to use them and how the assessment works
9) Publicise the aims and objectives of both the ISTI and the work of the
Benchmarking and Assessment working group widely and engage with as many similar efforts as possible
Objectives Met:
1) Benchmark Cycle concepts paper submitted to GIMDS.
This has been done and the paper is now published and available:
Willett, K. M., C. N. Williams, I. Jolliffe, R. Lund, L. Alexander, S. Brönniman, L. A. Vincent, S. Easterbrook, V. Venema, D. Berry, R. Warren, G. Lopardo, R. Auchmann, E. Aguilar, M. Menne, C. Gallagher, Z. Hausfather, T. Thorarinsdottir, P. W. Thorne, 2014: A framework for benchmarking of homogenisation algorithm performance on the global scale, Geoscientific Instrumentation, Methods and Data Systems, 3, 187-200, doi:10.5194/gi-3-187-2014.
http://www.geosci-instrum-method-data-syst.net/3/187/2014/gi-3-187-2014.html
2) Finalise the fully functioning open source software for producing the analog-clean-worlds and submit a methods paper.
Significant progress has been made on this to the extent that clean world station data can now be created for the globe using the vast majority of ISTI stations.
Methods are still being finessed to bring in more ISTI stations and improve on the key characteristics (standard deviation of climate anomaly difference series,
autocorrelation of climate anomaly difference series). Code has been developed in Python and R.
The methods will be published in two papers. The first focuses on the fundamental method for reproducing a small network of station time series using Vector
Autoregression and background trends from a GCM. This is ready to be submitted. The second paper will describe how to do this on the global scale, bringing in a distance function to deal with messy station data, a neighbour disconnect method to avoid edge effects, factorisation to provide global scale shock terms and adding non-linear background trends from a global climate model. This has not been started yet.
4) Finalise error-world distribution statistics and probability framework and create software for producing the analog-error-worlds.
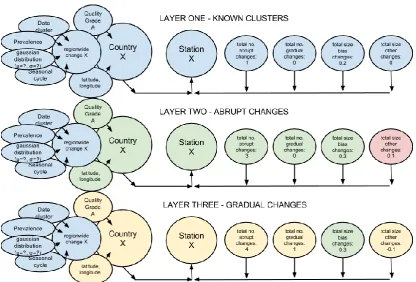
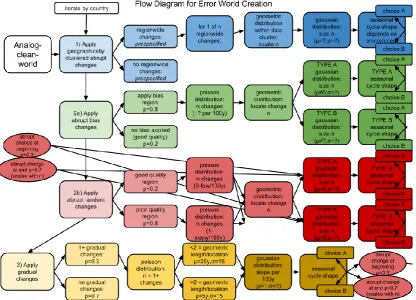
Figure 2. An example flow chart for how inhomogeneities may be applied to a station object. First, regionwide inhomogeneities are applied. For every change a date is selected, a size from a Gaussian distribution and then a shape type. Then abrupt inhomogeneities are applied. These are separated into biased and random changes. Biased inhomogeneities come from a non-zero mean distribution and may or may not be permanent. Random inhomogeneities come from a zero-mean distribution and may or may not be permanent. In both cases a changepoint is located, a size selected and then a shape. Gradual changes are then applied by selecting the number, location, slow, seasonal shape and then optionally adding an abrupt cahngepoint at the beginning and or end.
9) Publicise the aims and objectives of both the ISTI and the work of the
Benchmarking and Assessment working group widely and engage with as many similar efforts as possible
April 2014
Invited EGU talk given by Enric Aguilar.
July 2014
September 2014
Benchmarking concepts paper published, blogged and tweeted.
October 2014
Invited talk on ISTI and benchmarking given to Edinburgh University
Objectives Not Met:
2) Finalise the fully functioning open source software for producing the analog-clean-worlds and submit a methods paper.
Mostly met – see above.
3) Create a first suite of analog-clean-worlds (open and blind). Partially met – see above.
4) Finalise error-world distribution statistics and probability framework and create software for producing the analog-error-worlds.
Partially met – see above.
5) Create a first suite of analog-error-worlds (open and blind). This work has not been started yet.
6) Finalise assessment statistics and statistical tools and create software for assessing the results of tests on the benchmarks ready for the Benchmark cycle. There has been some discussion around this but little progress has been made due to time spent on clean world creation. We have agreed on four assessment levels and that we will focus on level 1, 2 and then 4. These are the ability of algorithms to return the climate characteristics of the data, the changepoint detection skill (assessed both in terms of location and inhomogeneity size/shape) and then the comparison of the benchmarks with reality.
7) Have a prototype working assessment framework by Summer 2014. Not achieved.
8) Create a platform for guiding users of the benchmarks in how to use them and how the assessment works
No progress.
Other Efforts and Achievements:
Rachel Warren’s PhD continues to develop a benchmarking process for daily data and work in collaboration with ISTI. Daily benchmarks for four regions of the USA and 3 worlds have now been publically released as blind worlds. Richard Chandler visited the Met Office to assist with methodology for
The SAMSI/IMAGe workshop was very beneficial to the benchmark work.
Improvements were implemented. Global scale benchmarks were created for the first time. Errors in the methodology were fixed. By the end of the workshop the benchmark code was able to simulate 20000+ stations of monthly mean
temperature data with reasonable cross-correlation and autocorrelation. The issues remaining were: updating to use the latest version of the ISTI databank; updating the GCM used; improving the distance function to include elevation; improving the agreement with real station data in terms of the standard deviation of the difference series and autocorrelation of the difference series; and rolling out the method for more of the ISTI databank stations.
The distance function can now incorporate vertical elevation. This was derived from fitting to the real data. However, for the lag one function we had to use the same decay as for the lag zero to prevent issues of non-positive definiteness in the matrices.
The new ISTI databank version is now being used. We still found some issues with stations having identical locations and correlating with r=1.0. These stations have not been included in the benchmarks. There are also issues with some stations not having an elevation. Some stations are too short (< 3 years of data within a 15 year period).
A new GCM is now used and interpolation has been improved following Finn Lindgren’s help at the SAMSI/IMAGe workshop.
A new clean world version has just been completed and is currently being assessed to see if it is sufficiently good to go with.
A second paper has been submitted by Robert Lund and Kate Willett describing the basics of clean world creation on the small scale.
2014 Annual Overview:
Progress during 2014 has been slower than hoped initially and the benchmarks are still not completed. This is partly due to Kate having time off for a back operation and also the complexity of getting the clean world methods up and running on the global scale. We have held fewer teleconferences than would be ideal, but this is largely due to lack of progress between calls. The SAMSI/IMAGe workshop, getting a working version of the clean world code and getting the concepts paper published have been major successes and so although progress is slow there is no reason to think that the benchmark working group will not succeed in creating complete benchmarks eventually. The latest deadline for the benchmarks was New Year 2015. This will not be met. However, Kate will visit Renate and Stefan in December,
Objectives for October 2014 to October 2015:
Table 1. Suggested timeline and plan for achieving objectives.
Objective Description Responsible
Members
Deadline Advocacy of ISTI and the
benchmarks and support for users
Presentation of concepts and progress at relevant conferences and events
All Ongoing
Up to date reference list of work on homogenisation/ benchmarking: https://sites.google.com/a/ surfacetemperatures.org/h ome/benchmarking-and- assessment-working-group?pli=1#Reference%20 Literature
Add to this as widely as possible
All Ongoing
Analog-clean-worlds open worlds
Create software to produce analog-clean-worlds on a global scale, produce enough to create the open error worlds Team Creation – lead by Robert Lund and Kate Willett December 2014 Analog-clean-worlds global scale production Produce analog-clean-worlds for all blind error worlds and submit methods paper 2
Team Creation – code run and data hosted by Kate Willett January 2015 Analog-error-worlds concepts finalised
Using the defined set of blind and open worlds define the distribution and statistical probability framework Team Corruption – lead by Claude Williams & Victor Venema February 2015 Analog-error-worlds open worlds
Analog-error-worlds blind worlds (official
benchmarks)
Produce error-worlds from the analog-clean-worlds ready for distribution as official benchmark data Team Corruption – lead by Claude Williams &Victor Venema July 2015 Validation concepts finalised
Decide upon number and type of tests with which to perform validation
Team Validation – lead by Ian Jolliffe
March 2015
Validation proof-of-concept Create software and score
system/intercomparison tables to run the
validation on a proof-of-concept scale and submit methods paper (if
desired?)
Team Validation – lead by Ian Jolliffe
July 2015
Validation global scale production
Produce software and framework ready for running on the global scale – automated or manual
Team Validation – lead by Ian Jolliffe
November 2015
Benchmark Cycle Release of analog-error-worlds
Release first official benchmarks – publicise widely
All – lead by Kate Willett
July 2015
Benchmarking Platform Design
Create a webpage showing step-by-step ‘How to benchmark’ with appropriate links to data, validation and
intercomparison tables with registration so that feedback can be
provided and contact maintained
All – lead by Kate Willett
July2015
Deadline for submission of benchmark results
Homogenisers to submit their homogenised benchmark data and a set of specified statistics
Dataset creators
July 2017
Benchmark Cycle – release of the ‘answers’
Release the ‘answers’ (analog-clean-worlds)
All – lead by Kate Willett
Return of assessment of benchmark
homogenisation
Supply all appropriate statistics to the dataset creators
Team Validation led by Ian Jolliffe and working group
January 2018
Organise benchmark cycle 1 wrap-up workshop
Plan and run a
workshop, perhaps in conjunction with full ISTI meeting or other
conference? Resource dependent.
All – lead by Kate Willett
Summer 2018
Publication of benchmark results and assessment of the cycle
Benchmarking working group
December 2018
Release of second benchmark cycle
Some improvements made from previous cycle and different issues explored with the error worlds
Benchmarking working group