www.ann-geophys.net/27/1717/2009/
© Author(s) 2009. This work is distributed under the Creative Commons Attribution 3.0 License.
Annales
Geophysicae
Studies of magnetotail dynamics and energy evolution during
substorms using MHD simulations
S. Brogl1, R. E. Lopez2, M. Wiltberger3, and H. K. Rassoul4
1DLR – GSOC, Oberpfaffenhofen, Germany
2University of Texas at Arlington, Arlington, TX, USA 3HAO/NCAR, Boulder, CO, USA
4Florida Institute of Technology, Melbourne, FL, USA
Received: 6 March 2008 – Revised: 16 February 2009 – Accepted: 27 February 2009 – Published: 8 April 2009
Abstract. We examine the distribution and propagation of energy in the plasma sheet and lobes using observations and simulations for three substorms. The substorms occurred on 9 March 1995, 10 December 1996, and 27 August 2001 and have been simulated using the Lyon-Fedder-Mobarry magneto-hydrodynamic code. All three events occur over North America and show a clear substorm current wedge over the ground magnetometer chains of Alaska, Canada, and Greenland. The three simulations show the thinning of the plasma sheet during the growth phase of the event and an increase in the relative amount of thermal energy due to the compression of the plasma sheet. Generally, the total lobe energy, polar cap flux, and lobe magnetic field strength simultaneously increase during the growth phase, and polar cap flux and total lobe energy only start dropping at substorm onset, as measured by the CANOPUS magnetometer chain. Starting at time of onset and continuing throughout the ex-pansion phase a transfer of magnetic energy from the lobes into the plasma sheet occurs, with the increase in the plasma sheet energy ranging from 30–40% of the energy that is re-leased from the lobes.
Keywords. Magnetospheric physics (Magnetotail; Plasma sheet; Storms and substorms)
1 Introduction
Substorms are the process by which energy that was loaded into the magnetotail from the solar wind is explosively re-leased in the magnetosphere-ionosphere system. The
origi-Correspondence to: S. Brogl ([email protected])
nal definition of the substorm onset was the brightening of a pre-existing arc in the auroral oval (Akasofu, 1964). It has been widely agreed on that a substorm has three phases: a growth phase, an expansion phase and a recovery phase (e.g., Rostoker et al., 1988). The growth phase is considered to be the phase that loads energy via dayside reconnection from the solar wind into the magnetotail, leading to an increase in the magnetic field strength in the lobes as well as to a thin-ning and compression of the plasma sheet. The expansion phase is when a pre-existing auroral arc brightens, the sub-storm current wedge (e.g., McPherron et al., 1973) is created as the Earth’s magnetic field returns to a more dipolar con-figuration, and there is an injection of energetic particles into the near-Earth magnetotail (Lopez et al., 1990b). The recov-ery phase is characterized by the return of the system to a relaxed state (Pulkkinen et al., 1994).
down the tail when reconnection proceeds to open field lines, and this is generally thought to be coincident with the ex-pansion phase onset (Baker et al., 1985, 1996). The NENL model explains most of the physical findings and a wide range of observations fit naturally into the NENL framework (e.g., Angelopoulos et al., 1994; Baker et al., 1997).
What exactly causes the onset of the substorm expansion phase, how and when the substorm current wedge is gener-ated, and where the reconnection region is exactly located are still under discussion (Nagai et al., 2005). One of the difficul-ties in resolving these issues is that rarely are there sufficient spacecraft in the right position at the right time to be able to determine the proper sequence of events. Moreover it is dif-ficult to determine the global evolution of the magnetosphere during a substorm from single-point measurements.
To determine the evolution of a substorm multipoint ob-servations are necessary. Sometimes it is possible to find several satellites distributed in the tail that can measure the evolution and development of the substorm current wedge. Together with ground based magnetometer data it is possi-ble to determine where the current disruption region of the cross-tail current begins and whether it expands only longi-tudinally or also radially away from Earth (Lopez and Lui, 1990). One can also determine the difference between a pseudo-substorm onset and a standard onset (Ohtani et al., 1993) and connect the westward traveling surge to activity in the magnetotail (Lopez et al., 1990a, 1993).
Nevertheless these are only snapshots. Satellites can give an excellent view on the microscale level, but even with several spacecraft is it still difficult to capture dynamics in the magnetotail on larger scales, e.g. the energy dynamics and distribution during substorms. Originally it was thought that the energy loading and unloading processes were differ-ent during the growth and expansion phase of the substorm (Baker et al., 1985), but then it was clarified that both are due to reconnection processes of open and closed field lines in the dayside and nightside of Earth, respectively (Baker et al., 1996).
One of the most popular measures for the energy trans-fer from the solar wind to the magnetosphere is the epsilon-parameter (Akasofu, 1981). Most of the time it is seen as the transfer of solar wind Poynting flux into the magneto-sphere, but due to its unclear definition and lack of physi-cal foundation, the epsilon parameter can be interpreted in several different ways (Koskinen and Tanskanen, 2002). Al-though the epsilon parameter gives a very good first estimate of the energy input into the magnetosphere it does not take the dependence of energy transfer on the solar wind den-sity into account (Lopez et al., 2004). In comparison with global MHD simulations the epsilon parameter sometimes provides a good estimate of energy input, such as during the main phase of a storm (Palmroth et al., 2003), but it gives a very poor estimate of the energy input during the late phases of a substorm (Pulkkinen et al., 2006). What is needed is a way to capture the global behavior of the transfer of
en-ergy during a substorm. To achieve that global picture of the energy distribution and dynamics in the magnetosphere, the Lyon-Fedder-Mobarry magneto-hydrodynamic code was used to simulate three substorms and calculate the energy in the plasma sheet and lobes during these events. In this paper we present calculations for the substorms of 9 March 1995 (Lyon et al., 1998; Lopez et al., 1998), 10 December 1996 (Wiltberger et al., 2000; Pulkkinen et al., 1999) and 27 Au-gust 2001 (Wiltberger et al., 2005a). Our analysis includes calculations of the polar cap flux, lobe energy and plasma sheet energy during growth and expansion phase of the sub-storms. We present first a brief introduction of the code and procedures used to do this analysis, followed by a discussion of the energy dynamics of the three events showing that the results are consistent, followed by our conclusion.
2 Code description
The Lyon-Fedder-Mobarry magneto-hydrodynamic code (Lyon et al., 2004) is a three-dimensional code that solves the ideal MHD equations for the interaction of the solar wind with the magnetosphere-ionosphere system. It consists of two interlinked simulations (Fedder et al., 1995b; Fedder and Lyon, 1987; Mobarry et al., 1996; Lyon et al., 2004). The magnetospheric, MHD domain is coupled to a 2-D electro-static ionosphere model driven by the magnetosphere field aligned currents, and the model ionosphere includes empiri-cal enhancements to the auroral conductance (Fedder et al., 1995a; Slinker et al., 1995; Wiltberger et al., 2003). The ionosphere is simulated by solving a height-integrated elec-trostatic equation that has been coupled via empirical rela-tionships to the magnetospheric simulation (Wiltberger et al., 2003). The initial inputs to the ionosphere model are the F10.7 flux and the dipole tilt. The ionospheric conductivity is further modified by the field-aligned currents produced by the MHD code. The conductivity model is described in detail in Fedder et al. (1995a).
The magnetospheric simulation domain extends from XSM=30RE sunward toXSM=−300RE anti-sunward, and
includes 100REin bothYSMandZSMdirections. The inner
boundary is 2.5RE from the center of Earth. At that point
0.25RE long, and the largest cells in the areas with poorer
resolution have sizes of about 1.0 to 1.5RE.
3 Procedure
For this study we use runs of three specific events in which LFM was driven by solar wind data. These events occurred on 9 March 1995, 10 December 1996, and 27 August 2001. The simulation of 9 March 1995 is a low resolution run with a total number of cells of 50(radial)×24(polar)×32(azimuthal), which gives 40 424 cells. The other two substorms were run at a higher resolu-tion (50×48×64). These events have been previously stud-ied to explore issues such as substorm onset (Lopez et al., 1998; Lyon et al., 1998) and the occurrence of fast magne-totail flows (Wiltberger et al., 2000). Here we significantly extend the analysis of these events to determine a common pattern in the evolution of energy storage and release during substorms.
The analysis of the LFM results was done using the CISM Data Explorer (CISM-DX) (Wiltberger et al., 2005b). To se-lect the simulation cells that comprise the plasma sheet, a field line was traced from the center of every cell to deter-mine whether the field line was open or closed. All field lines that begin and end at the LFM inner boundary (and thus map to the ionosphere) were considered closed and therefore the cell was considered a cell of the plasma sheet. All field lines that were open and have a pressure of less than 0.01 nPa and a density of less than 0.2 cm−3were considered to be lobe cells. The pressure and density limits were taken from Guild et al. (2004), who found that these values provided a good identifier of cells in the magnetotail lobes.
The energy of these regions is calculated by mapping the energy per volume (kinetic, magnetic, and thermal) in units of [J/m3] to the center of the chosen cells. Using an inte-grated CISM-DX module called “Measure” it is possible to calculate the exact volume of the cell in m3. The volume of the cell is then multiplied by the energy per volume found in the center of the cell to receive the energy in J of each cell. All the energies of the chosen cells can then be added to de-termine the energy of the entire plasma sheet and the entire lobe region.
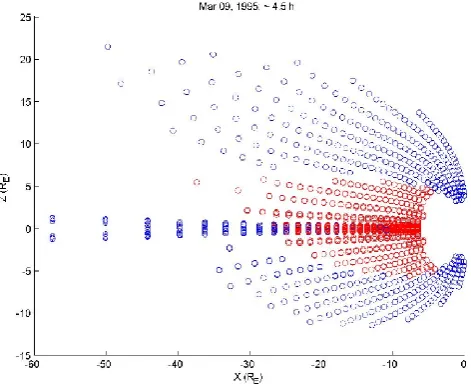
Figure 1 shows the XZ cut plane withY between±2RE
[image:3.595.311.547.63.255.2](which leads to a couple of double points) and the selected areas for the plasma sheet and the lobes. The lobes are shown in blue whereas the plasma sheet is depicted in red. The dots signify the center of the chosen cells and the posi-tions of where the energy is being measured. The energy of the plasma sheet is the sum of the energies at all the loca-tions marked in solid circles. The energy in the lobe region is the sum of all the energies chosen at the positions of the empty circles. Which cells belong to which regions is deter-mined for every time step of the simulation in order to track the development of the magnetic, kinetic, thermal energy in
Fig. 1. Plasma sheet (red circles) and the lobes (blue circles) in the
XZ-plane from the simulated substorm of 9 March 1995.
the lobes and plasma sheet as well as the change of the vol-ume of the two regions over the course of the three different substorms. Throughout this paper, when we refer to the en-ergy of the lobe we mean the enen-ergy in both the northern and southern lobes combined, whereas when we refer to the polar cap flux we refer to the open flux in the northern polar cap alone (we have verified that the flux in the southern polar cap is always the same as in the northern polar cap).
4 Simulation results
The chosen substorms have been analyzed in detail using ground magnetometer data and available satellites. The over-all history of the events can be determined from the CL index from ground based magnetometer data, which is calculated using the lower bound of the H component of stations from the CANOPUS Magnetometer Chain in Canada. Thus CL is calculated the same manner as the AL index is calculated using data from the 12 AL magnetometer stations. However, since the number of CANOPUS stations (although it applies to a smaller local time sector) is significantly greater that the number of AE stations in that sector, the CL index provides a much better estimate of the perturbation due to the maximum westward current in the Canadian sector.
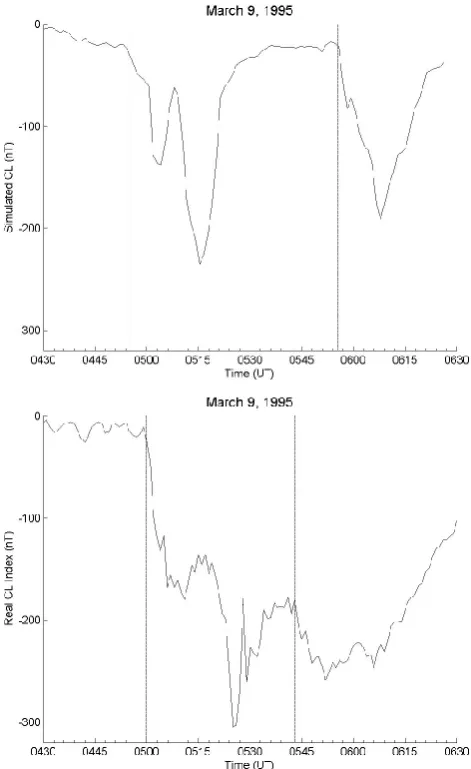
Fig. 2. Substorm expansion phase onset (first vertical line) and a
second onset (second vertical line) on 9 March 1995. The real CL index is in the bottom panel and the simulation index is in the top panel.
to construct an index. Interpolation to a single point in the ionosphere does not always provide a close match with re-ality, even when the simulation response as a whole is actu-ally quite reasonable (e.g., Wiltberger et al., 2003). More-over, even though the simulation is driven with solar wind data (generally from L1), this is still a propagation of a sin-gle point measurement and there is some significant uncer-tainty about what solar wind impacted the magnetosphere and when. For example, to includeBx in the simulation and
keep the divergence ofB zero, Bx is expressed as a linear
combination ofByandBz(Lyon et al., 2004). This imposes
a propagation direction on the solar wind that may or may not have been the direction the solar wind was actually flowing.
Therefore, given such uncertainties, in this study we do not consider the direct comparison of single point
measure-ments of the ground magnetometer data with the simulation in favour of determining a general correspondence between the simulation results and the actual observations. Once we have reviewed the evidence for such a correspondence, we can look at the evolution of the energy in the magnetosphere during the event and place those results in the original con-text of the evolution of the event from both the observational and simulation perspective.
4.1 9 March 1995
The first event we examine is a substorm that occurred on 9 March 1995 and which has been the subject of several in-vestigations (Lopez et al., 1998, 1999, 2001; Lyon et al., 1998). Figure 2 shows a comparison of the real CL index and the simulated index for the event. Also drawn on the fig-ures are two vertical lines, the first indicating the expansion phase onset and the second indicating a second onset. The CL data shows that there was an onset near 05:00 UT with an intensification at about 05:15 UT. After a partial recovery of the first onset there is a second onset at 05:43 UT. The sim-ulation index shows all the basic features of the measured index. It also shows that the simulation produced the initial onset of the substorm at 04:55 UT, about 5 min before it actu-ally happened, followed by the second onset at 05:55 UT. As discussed in previous papers, particularly Lyon et al. (1998), the correspondence is surprisingly good given the uncertain-ties in things like the solar wind input.
Thus both CL and the simulation index show a similar be-haviour for this multiple onset substorm, even though the cor-respondence is not exact. Both indices show an initial onset, an intensification, some recovery, and a second onset. Thus we have confidence that this event represents a case where the LFM reproduced the large-scale behaviour of the sub-storm, to the point of showing an intensification and second onset, though with a slightly different time-scale when com-pared to reality.
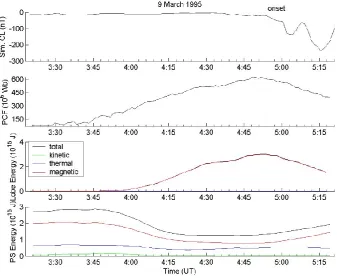
Given a substorm simulation in which we have some confi-dence, we can now examine the evolution of the energy stor-age and release during this event as produced by the simu-lation. The results for the energy dynamics for the 9 March 1995 substorm can be seen in Fig. 3. The top panel shows the simulated index. One can see very clearly the first onset at 04:55 UT with an intensification at 05:08 UT, followed by the initial recovery (which, in Fig. 2, is followed by the sec-ond onset at 05:55 UT). The secsec-ond panel in Fig. 3 shows the polar cap flux, and one can see that it increases during the growth phase of the substorm simultaneously with the total lobe energy, as shown in the third panel of Fig. 3. During the same time the sum of kinetic, magnetic, and thermal energies in the plasma sheet (presented in the bottom panel of Fig. 3) decreases.
Fig. 3. Panel 1 shows the simulated CL index, panel 2 shows the polar cap flux. The evolution of total (black), kinetic (green), thermal
(blue), and magnetic (red) energies in lobe and plasma sheet is seen in panels 3 and 4, respectively.
energies of the lobe (blue and green, respectively) are barely discernable in comparison to the magnetic energy. This is because the beta for the lobes is less than 0.06, where beta is the thermal energy divided by the magnetic energy. The average beta of the plasma sheet is much closer to one, as would be expected. One can see that although the total en-ergy of the plasma sheet decreases, the thermal enen-ergy does not decrease by the same relative amount. During the growth phase the total volume of the plasma sheet decreases as well as its total energy. The main component of the energy that decreases is the magnetic, and not the thermal energy. This leads to an increase in the thermal energy relative to the to-tal energy during the growth phase of the substorm, which fits with the idea that the plasma sheet is being compressed and therefore the plasma is being heated. Thus, even though the total amount of thermal energy decreases slightly (due to the shrinking volume of the plasma sheet) the fraction of the plasma sheet energy that is thermal energy increases.
By the time of the onset the plasma sheet energy has reached its lowest value, while polar cap flux and total lobe energy are at their peak values. When the expansion phase starts at substorm onset (marked by the vertical line) the po-lar cap flux and total lobe energy decrease, while the plasma sheet energy increases. In panel 4 of Fig. 3 again we can see that the energy that leads to the increase in plasma sheet energy is the magnetic energy. The thermal energy remains constant and the kinetic energy in the plasma sheet does not
seem to change significantly over the course of the substorm. Considering that the lobe is primarily magnetic energy, and the primary increase in plasma sheet energy is due to an en-hancement in magnetic energy, one can surmise that there is a transfer of magnetic energy from the lobes into the plasma sheet as the region of closed field lines grows and the volume of the plasma sheet increases.
The amount of transfer of energy from lobes into plasma sheet can be seen in Fig. 4. One can see the absolute de-crease of magnetic lobe energy and the absolute inde-crease of magnetic energy in the plasma sheet, after substorm onset. One can see that there is more energy coming out of the lobes than there is going into the plasma sheet. The ratio of energy that leaves the lobes versus the energy that enters the plasma sheet during this event is roughly 42%. This suggests a rough equipartition of magnetic flux from the reconnection region with half going tailward and half going earthward. We also note that the magnitude and the variation of the open flux during this event is very similar to values reported for other substorm events in which the open flux and its variation has been determined from observations (Milan et al., 2004; De-Jong et al., 2007).
4.2 10 December 1996
Fig. 4. The absolute amount of decrease in the lobes after the 9
March 1995 substorm onset and the absolute amount of increase of magnetic energy in the plasma sheet is shown. The ratio of the two is 42%.
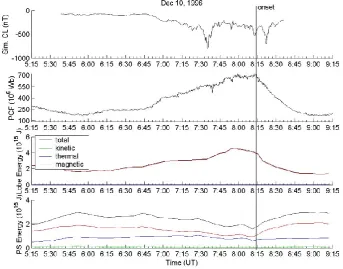
at 07:31 UT and the expansion phase onset just before 08:00 UT. Inspecting the CL data, it is not obvious why the initial activity at 07:31 UT is a pseudobreakup (e.g., Kosk-inen et al., 1993) and why the major onset is just before 08:00 UT. The identification of the 07:31 UT activity as a pseudobreakup was made by Pulkkinen et al. (1999) based on a variety of data, including auroral images. They found that the 07:31 UT activity was latitudinally limited, whereas the 08:00 UT activity was not. The simulation index also shows the times when electrojet activity increased, and these are marked on the figure. Following the real event we would expect that the initial activity should correspond to a pseu-dobreakup, while the second burst of activity should be the main onset. Actually, there are a number of correspondences between the LFM simulation of this event and observations, as discussed by Wiltberger et al. (2000). These include sur-prisingly realistic flows in the magnetotail as determined by a direct comparison to Geotail data.
Figure 6 shows energy calculations along with the simu-lation index, which shows a clear onset of activity just af-ter 07:30 UT and another period of activity around 08:15 UT. During the growth phase of the substorm up until the sec-ond onset around 08:15 UT the polar cap flux, lobe magnetic field and total lobe energy increase while the total plasma sheet energy decreases. The first period of activity can be seen in the plasma sheet energy but not in the polar cap flux or lobe energy. In fact, there is evidence in field line traces that the simulation did produce magnetotail reconnection at 07:30 UT, but the reconnection region did not reach the lobes and produce a free plasmoid. This is strong confirmation that the 07:30 UT activity was a pseudobreakup since it did not lead to a significant unloading of the tail flux. This is in
Fig. 5. A substorm pseudobreakup (first vertical line) followed by
a true substorm expansion phase onset (second vertical line) on 10 December 1995. The real CL index is in the bottom panel and the simulation index is in the top panel.
contrast to the development of the 9 March event, which did not feature a pseudobreakup.
[image:6.595.50.280.62.257.2]Fig. 6. Panel 1 shows the simulated CL index, panel 2 shows the polar cap flux. The evolution of total (black), kinetic (green), thermal
(blue), and magnetic (red) energies in lobe and plasma sheet is seen in panels 3 and 4, respectively.
plasma sheet. As in the 9 March case, the value for the lobe flux and its variation produced by the LFM simulation are very consistent with observations of substorms by Milan et al. (2004) and DeJong et al. (2007).
We surmise that the bulk of the energy in this event went tailward and was lost from the system. While initially the energy will be lost in the form of a closed flux region, i.e., a plasmoid, at a certain point the near-Earth reconnection re-gion becomes the new distant reconnection rere-gion once it has begun to reconnect lobe field lines. The flux that is ejected from the reconnection region from that point onward cannot be properly termed a plasmoid. It is simply reconnected solar wind flux that is lost down the tail. In addition, there will be energy loss in the ionosphere, however, given the form of the simulation (an electrodynamic 2-D ionosphere coupled to a 3-D MHD magnetosphere) energy is not strictly conserved in the total ionosphere-magnetosphere system. However, we believe that our results concerning the general behavior of the energy storage and release in the magnetotail are valid.
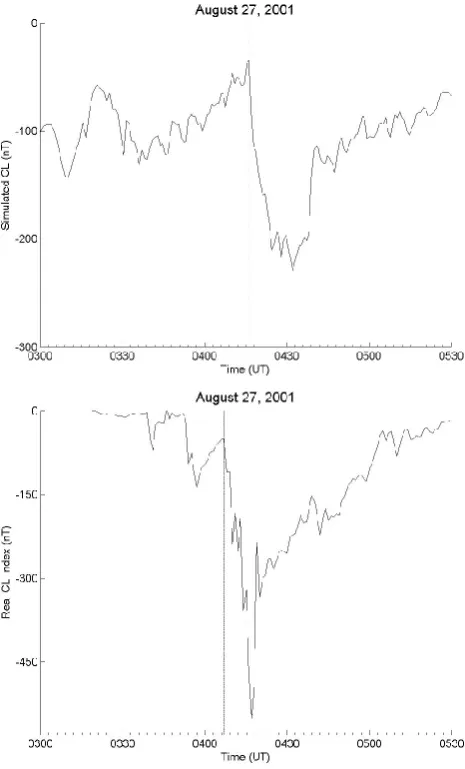
4.3 27 August 2001
The CL data and the simulation index for the substorm of 27 August 2001 are presented in Fig. 8. It can be seen that the real data recorded an onset at 04:08 UT while the onset in the simulation is at 04:12 UT and although the magnitude of the onset is smaller in the simulation, the basic features are
Fig. 7. The absolute amount of decrease in the lobes after the 10
December 1996 substorm onset and the absolute amount of increase of magnetic energy in the plasma sheet is shown. The ratio of the two is 34%.
nonetheless similar. After a brief intensification, the west-ward electrojet weakened as substorm recovery began.
[image:7.595.310.548.388.583.2]Fig. 8. Substorm expansion phase onset (vertical line) on 27
Au-gust. The real CL index is in the bottom panel and the simulation index is in the top panel.
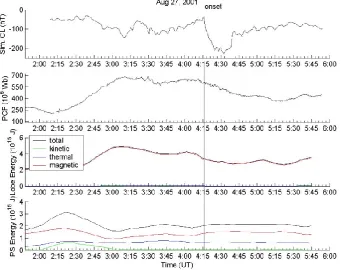
March 1995 and 10 December 1996, but with one interesting twist. The increase of polar cap flux and total lobe energy can be seen in Fig. 9 during the growth phase of this substorm that started at around 02:20 UT. During the growth phase the plasma sheet was compressed and the thermal energy in the plasma sheet increased relative to the total energy, as seen in panel 4. This continued up until about 03:00 UT when the polar cap flux and lobe energy start to slightly decay and the plasma sheet energy increased slowly, but no onset is visi-ble in the ground magnetometer data. It seems that there is lobe reconnection in the simulation during this growth phase but no actual onset. Since the LFM does not show any evi-dence of substorm activity at this time we presume that the balance between dayside merging and nightside reconnec-tion changed so that the rate at which flux was being added to the polar cap became negative without the formation of a new near-Earth neutral line as happens during substorms.
However, the solar wind data (not shown) do not indicate that the solar wind merging field decreased at this time, so that change must have been at the distant neutral line in the magnetotail.
The system remains in this slowly decaying state until the actual substorm onset at 04:12 UT, when the rate of recon-nection increases and the polar cap flux starts to decrease. This was due to a substorm reconnection region that sev-ered part of the tail in the classic substorm sequence. Due to reconnection, magnetic energy was transferred from the lobes into the plasma sheet (panels 3 and 4 of Fig. 9). This reduces the polar cap flux by reconnecting open flux in the tail, creating closed flux in the plasma sheet. Also the total lobe energy decreases while the total plasma sheet energy in-creases. About 26% of the energy that leaves the lobes enters the plasma sheet, as seen in Fig. 10. This value is lower than seen in the other events and it may be related to the unusual growth phase for this substorm, or the short duration of the expansion could be related to the solar wind driver during the expansion phase, as suggested by Pulkkinen et al. (2006).
5 Conclusions
We have shown that our simulations using the Lyon-Fedder-Mobarry magneto-hydrodynamic code can reproduce the characteristics of substorms. Each event presented here showed an onset of westward electrojet activity that was a fairly faithful representative of the overall activity in the real data, even if the details were not identical (particularly the exact timing or magnitude). This is true even if on initial inspection the simulation results did not look like the real ones. The simulation of 9 March produced an onset, inten-sification, recovery, and second onset all within reasonable temporal proximity to the real activity. The simulation of the 10 December event produced a pseudobreakup followed by a full onset, just as was seen in reality even though the exact times series of the real and simulated electrojet indices do not closely resemble each other. For the 27 August event, the simulation produced an onset just four minutes after the real one, and both the real and the simulated substorm expansion phases were of brief duration and did not include multiple onsets. And as pointed out above, each of these simulations has been compared to other datasets besides the CL index and the correspondence has been found to be reasonably good.
Fig. 9. Panel 1 shows the simulated CL index, panel 2 shows the polar cap flux. The evolution of total (black), kinetic (green), thermal
(blue), and magnetic (red) energies in lobe and plasma sheet is seen in panels 3 and 4, respectively.
The simulations show a stretching and compression of the plasma sheet, and the thermal energy increases as a proportion of the total plasma sheet energy during the growth phase. Simultaneously there is an increase of the polar cap flux and the total lobe energy. This represents the transfer of flux from the closed field line region to the open field line region due to merging on the dayside. Since the actual rate of change of the polar cap flux is the difference between day-side merging and nightday-side reconnection one can have a case such as 27 August where during the growth phase the po-lar cap flux actually decreases slightly as reconnection at the distant neutral line overpowers dayside merging.
At substorm onset the polar cap flux decreases together with the lobe energy. About 30–40% of the energy of the lobes is transferred into the plasma sheet and the total plasma sheet energy increases. This increase in the plasma sheet en-ergy is primarily in the form of magnetic enen-ergy from the lobes as the open field lines reconnect in the tail and are con-verted into closed plasma sheet field lines as the plasma sheet dipolarizes. Thus we find that substorm expansion phase in the plasma sheet is an endothermic process, as initially pro-posed by Hesse and Birn (1993). The rest of the energy re-moved from the lobes has to go tailward or be dissipated in the ionosphere. However, at this point it is not clear what factors might be controlling the efficiency of transfer of lobe energy into the plasma sheet during the expansion phase. Re-cent work by Pulkkinen et al. (2006) suggests that the control
Fig. 10. The absolute amount of decrease in the lobes after the 27
August 2001 substorm onset and the absolute amount of increase of magnetic energy in the plasma sheet is shown. The ratio of the two is about 26%.
[image:9.595.311.546.394.582.2]Acknowledgements. This material is based upon work supported by
CISM, which is funded by the STC Program of the National Sci-ence Foundation under Agreement Number ATM-0120950. The National Center for Atmospheric Research is sponsored by the Na-tional Science Foundation. The authors thank I. R. Mann and the CARISMA team for the CANOPUS data. CARISMA is operated by the University of Alberta, funded by the Canadian Space Agency. Topical Editor I. A. Daglis thanks two anonymous referees for their help in evaluating this paper.
References
Akasofu, S.-I.: The development of the auroral substorm, Plant. Space Sci., 12, 273–282, 1964.
Akasofu, S.-I.: Energy coupling between the solar wind and the magnetosphere, Space Sci. Rev., 28, 121–190, 1981.
Angelopoulos, V., Kennel, C., Coroniti, F., Pellat, R., Kivelson, M., Walker, R., Russell, C., Baumjohann, W., Feldman, W., and Gosling, J.: Statistical Characteristics of Bursty Bulk Flow Events, J. Geophys. Res., 99(A11), 21257–21280, 1994. Baker, D. N., Fritz, T. A., McPherron, R. L., Fairfield, D. H.,
Kamide, Y., and Baumjohann, W.: Magnetotail Energy Storage and Release During the CDAW 6 Substorm Analysis Intervals, J. Geophys. Res., 90(A2), 1205–1216, 1985.
Baker, D. N., Pulkkinen, T. I., Angelopoulos, V., Baumjohann, W., and McPherron, R. L.: Neutral line model of substorms: Past re-sults and present view, J. Geophys. Res., 101(A6), 12975–13010, 1996.
Baker, D. N., Pulkkinen, T. I., Hesse, M., and McPherron, R. L.: A quantitative assessment of energy storage and release in the Earth’s magnetotail, J. Geophys. Res., 102(A4), 7159–7168, 1997.
DeJong, A. D., Cai, X., Clauer, R. C., and Spann, J. F.: Aurora and open magnetic flux during isolated substorms, sawteeth, and SMC events, Ann. Geophys., 25, 1865–1876, 2007,
http://www.ann-geophys.net/25/1865/2007/.
Fedder, J. A. and Lyon, J. G.: The solar wind magnetosphere-ionosphere current-voltage relationship, Geophys. Res. Lett., 8, 880–883, 1987.
Fedder, J. A., Slinker, S., Lyon, J., and Elphinstone, R.: Global Nu-merical Simulation of the Growth Phase and the Expansion Onset for a Substorm Observed by Viking, J. Geophys. Res., 100(A10), 19083–19093, 1995a.
Fedder, J. A. and Lyon, J. G.: The Earth’s magnetosphere is 165 RE long: Self-consistent currents, convection, magnetospheric structure, and processes for northward interplanetary magnetic field, J. Geophys. Res., 100(A3), 3623–3635, 1995b.
Guild, T., Spence, H., Kepko, L., Wiltberger, M., Goodrich, C., Lyon, J., and Hughes, W. J.: Plasma Sheet Climatology: Geotail Observations and LFM Model Comparison, J. Atmos. Solar-Terr. Phys., 66(15–16), 1351–1360, 2004.
Hesse, M. and Birn, J.: On the Energy Budget in the Current Dis-ruption Region, Geophys. Res. Let., 20(14), 1451–1454, 1993. Koskinen, H. E. J., Lopez, R. E., Pellinen, R. J., Pulkkinen, T. I.,
Baker, D. N., and Bosinger, T.: Pseudobreakup and substorm growth phase in the ionosphere and magnetosphere, J. Geophys. Res., 97, 5801–5813, 1993.
Koskinen, H. E. J. and Tanskanen, E.: Magnetospheric energy bud-get and the epsilon parameter, J. Geophys. Res., 107(A11), 1415,
doi:10.1029/2002JA009283, 2002.
Lopez, R. E. and Lui, A. T. Y.: A Multisatellite Case Study of the Expansion of a Substorm Current Wedge in the Near-Earth Mag-netotail, J. Geophys. Res., 95(A6), 8009–8017, 1990.
Lopez, R. E., L¨uhr, H., Anderson, B., Newell, P., and McEntire, R.: Multipoint Observations of a Small Substorm, J. Geophys. Res., 95(A11), 18897–18912, 1990a.
Lopez, R. E., Sibeck, D. G., McEntire, R. W., and Krimigis, S. M.: The energetic ion substorm injection boundary, J. Geophys. Res., 94, 109–117, 1990b.
Lopez, R. E., Koskinen, H. E. J., Pulkkinen, T. I., B¨osinger, T., Potemra, T. A., and McEntire, R. W.: Simultaneous observation of the poleward expansion of substorm electrojet activity and the tailward expansion of current sheet disruption in the near-Earth magnetotail, J. Geophys. Res., 98, 9285–9295, 1993.
Lopez, R. E., Goodrich, C. C., Wiltberger, M., Papadopoulos, K., and Lyon, J. G.: Simulation of the March 9, 1995 Substorm and Initial Comparison to Data, in: Geospace Mass and Energy Flow: Results From the International Solar-Terrestrial Physics Program, AGU Monograph 104, edited by: Horowitz, J. L., Gal-lagher, D. L., and Peterson, W. K., 237–245, 1998.
Lopez, R. E., Wiltberger, M., Lyon, J. G., Goodrich, C. C., and Papadopoulos, K.: MHD simulations of the response of high-latitude potential patterns and polar cap boundaries to sudden southward turnings of the interplanetary magnetic field, Geo-phys. Res. Lett., 26, 967–970, 1999.
Lopez, R. E., Lyon, J. G., Wiltberger, M., and Goodrich, C. C.: Comparison of global MHD simulation results with actual storm and substorm events, Adv. Space Res., 28(12), 1701–1706, 2001. Lopez, R. E., Wiltberger, M., Hernandez, S., and Lyon, J. G.: Solar wind density control of energy transfer to the magnetosphere, Geophys. Res. Lett., 31, L08804, doi:10.1029/2003GL018780, 2004.
Lui, A. T. Y.: Extended consideration of a synthesis model for mag-netospheric substorms, in: Magmag-netospheric Substorms, edited by: Kan, J. R., Potemra, T. A., Kokubun, S., and Iijima, T., Geo-physical Monograph, AGU, 64, 43–59, 1991.
Lui, A. T. Y.: Current disruption in the Earth’s magnetosphere: Observations and models, J. Geophys. Res., 101(A6), 13067– 13088, 1996.
Lyon, J., Lopez, R. E., Goodrich, C. C., Wiltberger, M., and Pa-padopoulos, K.: Simulation of the March 9, 1995, substorm: Au-roral brightening and the Onset of Lobe Reconnection, Geophys. Res. Lett., 25(15), 3039–3042, 1998.
Lyon, J. G., Fedder, J. A., and Mobarry, C. M.: The Lyon-Fedder-Mobarry (LFM) global MHD magnetospheric simu-lation code, J. Atmos. Sol. Terr. Phys., 66, 1333–1350, doi:10.1016/j.jastp.2004.03.020, 2004.
McPherron, R. L., Russell, C. T., and Aubry, M. P.: Satellite stud-ies of magnetospheric substorms on August 15, 1968, 9. Phe-nomenological model for substorms, J. Geophys. Res., 78, 3131– 3149, 1973.
Milan, S. E., Cowley, S. W. H., Lester, M., Wright, D. M., Slavin, J. A., Fillingim, M., Carlson, C. W., and Singer, H. J.: Re-sponse of the magnetotail to changes in the open flux con-tent of the magnetosphere, J. Geophys. Res., 109, A04220, doi:10.1029/2003JA010350, 2004.
Geophys. Res., 101, 7859–7874, 1996.
Nagai, T., Fujimoto, M., Nakamura, R., Baumjohann, W., Ieda, A., Shinohara, I., Machida, S., Saito, Y., and Mukai, T.: So-lar wind control of the radial distance of the magnetic recon-nection site in the magnetotail, J. Geophys. Res., 110, A09208, doi:10.1029/2005JA011207, 2005.
Ohtani, S., Anderson, B. J., Sibeck, D. G., Newell, P. T., Zanetti, L. J., Potemra, T. A., Takahashi, K., Lopez, R. E., Angelopoulos, V., Nakamura, R., Klumpar, D. M., and Russell, C. T.: A Mul-tisatellite Study of a Pseudo-Substorm Onset in the Near-Earth Magnetotail, J. Geophys. Res., 98(A11), 19355–19367, 1993. Palmroth M., Pulkkinen, T. I., Janhunen, P., and Wu, C.-C.:
Storm-time energy transfer in global MHD simulation, J. Geophys. Res., 108(A1), 1048, doi:10.1029/2002JA009446, 2003. Pulkkinen, T. I., Baker, D. N., Koivanen, P. K., Pellinen, R. J.,
Friedel, R. H. W., and Korth, A.: Magnetospheric field and cur-rent distributions during the substorm recovery phase, J. Geo-phys. Res., 99, 10955–10966, 1994.
Pulkkinen, T. I., Baker, D. N., Cogger, L. L., Frank, A., Sigwarth, B., Kokubun, S., Mukai, T., Singer, H. J., Slavin, J. A., and Ze-lenyi, L.: Spatial extent and dynamics of a thin current sheet dur-ing the substorm growth phase on December 10, 1996, J. Geo-phys. Res., 104(A12), 28475–28490, 1999.
Pulkkinen, T. I., Palmroth, M., Tanskanen, E. I., Janhunen, P., Kosk-inen, H. E. J., and LaitKosk-inen, T. V.: New interpretation of magne-tospheric energy circulation, Geophys. Res. Lett., 33, L07101, doi:10.1029/2005GL025457, 2006.
Rostoker, G., Akasofu, S. I., Baumjohann, W., Kamide, Y., and McPherron, R. L.: The roles of direct input of energy from the solar wind and unloading of stored magnetotail energy in driving magnetospheric substorms, Space Sci. Rev., 46, 93–111, 1988. Slinker, S., Fedder, J., and Lyon, J.: Plasmoid Formation and
Evo-lution in a Numerical Simulation of a Substorm, Geophys. Res. Lett., 22(7), 859–862, 1995.
Wiltberger, M., Pulkkinen, T. I., Lyon, J. G., and Goodrich, C. C.: MHD Simulation of the magnetotail during the December 10, 1996, substorm, J. Geophys. Res., 105(A12), 27649–27663, 2000.
Wiltberger, M., Lyon, J. G., and Goodrich, C. C.: Results from the Lyon-Fedder-Mobarry Global Magnetospheric Model for the Electrojet Challenge, J. Atmos. Solar Terr. Phys., 65, 1213–1222, 2003.
Wiltberger, M., Elkington, S. R., Guild, T., Baker, D. N., and Lyon, J. G.: Comparison of MHD simulations of Isolated and Storm Time Substorms, in Inner Magnetosphere: Physics and Model-ing, Geophys. Monogr. Ser., AGU, 155, 271–281, 2005a. Wiltberger, M., Weigel, R. S., Gehmeyr, M., and Guild, T.: