www.biogeosciences.net/9/3901/2012/ doi:10.5194/bg-9-3901-2012
© Author(s) 2012. CC Attribution 3.0 License.
Biogeosciences
Riparian zone hydrology and soil water total organic carbon (TOC):
implications for spatial variability and upscaling of lateral riparian
TOC exports
T. Grabs1,2, K. Bishop1,3, H. Laudon4, S. W. Lyon2,5, and J. Seibert1,2,6
1Department of Earth Sciences, Uppsala University, Uppsala, Sweden
2Department of Physical Geography and Quaternary Geology, Stockholm University, Stockholm, Sweden
3Department of Aquatic Sciences and Assessment, Swedish University of Agricultural Sciences, Uppsala, Sweden 4Department of Forest Ecology and Management, Swedish University of Agricultural Sciences, Ume˚a, Sweden 5Bert Bolin Centre for Climate Research, Stockholm University, Stockholm, Sweden
6Department of Geography, University of Zurich, Zurich, Switzerland
Correspondence to: T. Grabs (thomas.grabs@geo.uu.se)
Received: 21 February 2012 – Published in Biogeosciences Discuss.: 14 March 2012 Revised: 22 July 2012 – Accepted: 24 August 2012 – Published: 10 October 2012
Abstract. Groundwater flowing from hillslopes through ri-parian (near-stream) soils often undergoes chemical transfor-mations that can substantially influence stream water chem-istry. We used landscape analysis to predict total organic carbon (TOC) concentration profiles and groundwater levels measured in the riparian zone (RZ) of a 67 km2catchment in Sweden. TOC exported laterally from 13 riparian soil profiles was then estimated based on the riparian flow–concentration integration model (RIM). Much of the observed spatial vari-ability of riparian TOC concentrations in this system could be predicted from groundwater levels and the topographic wetness index (TWI). Organic riparian peat soils in forested areas emerged as hotspots exporting large amounts of TOC. These TOC fluxes were subject to considerable temporal variations caused by a combination of variable flow condi-tions and changing soil water TOC concentracondi-tions. Mineral riparian gley soils, on the other hand, were related to rather small TOC export rates and were characterized by relatively time-invariant TOC concentration profiles. Organic and min-eral soils in RZs constitute a heterogeneous landscape mo-saic that potentially controls much of the spatial variability of stream water TOC. We developed an empirical regression model based on the TWI to move beyond the plot scale and to predict spatially variable riparian TOC concentration profiles for RZs underlain by glacial till.
1 Introduction
Being located directly adjacent to streams, the riparian zone (RZ) is the last strip of land in contact with groundwater before it discharges into the stream network or into the hy-porheic zone. Due to its location at the land–stream interface, the RZ can hydrologically and biogeochemically “buffer” lateral subsurface fluxes (McGlynn and Seibert, 2003; Jencso et al., 2009; Rodhe and Seibert, 2011). The RZ thus controls ecologically-significant short-term variations of surface wa-ter quality (Cirmo and McDonnell, 1997; Hooper et al., 1998; McClain et al., 2003; Serrano et al., 2008; Berggren et al., 2009) and quantity (Dunne and Black, 1970; Ocampo et al., 2006; McGlynn and McDonnell, 2003). The RZ often dis-tinguishes itself from the surrounding landscape by charac-teristic hydromorphic features including different soils (Hill, 1990) and vegetation (Jansson et al., 2007). These hydro-morphic features have normally evolved over long periods of time ranging from several years to millennia. Understand-ing RZ functionUnderstand-ing is important for understandUnderstand-ing long-term and short-term effects of upslope hydrological controls (Vi-don and Smith, 2007) on riparian vegetation and soils, which in turn can chemically modulate hydrological fluxes from up-slope areas.
variable streamflow chemistry presented by Kirchner (2003). In essence, old (pre-event) water can be quickly mobilized during a hydrological event by rapidly rising groundwater tables in soils with a marked decrease of conductivity with depth. This has also been described as a transmissivity feed-back mechanism (e.g. Rodhe, 1989; Bishop et al., 2011). As the groundwater table rises into more shallow riparian soil horizons, these horizons become hydrologically connected to the stream. If the soil water in the newly connected soil hori-zons is chemically different from lower horihori-zons, then this can result in the substantial shifts of stream water chemistry observed during flow episodes.
This perceptual view has been further developed into a mathematical framework called the riparian flow– concentration integration model (RIM) (Seibert et al., 2009). In RIM incremental solute mass effluxes are computed by multiplying solute concentrations with lateral groundwater flow at each layer of a riparian soil profile. Total solute fluxes are then calculated by integrating the incremental so-lute mass fluxes across the soil profile. The RIM concept has provided a physically plausible linkage between observed streamflow, groundwater tables and stream water and soil water chemistry when tested for a small catchment based on a single riparian soil transect with respect to the flux of dissolved organic carbon (Bishop, 1991), mercury (Bishop et al., 1995), aluminum (Cory et al., 2007), lead (Klamin-der et al., 2006) and water as quantified by stable isotopes (Laudon et al., 2004b). A limitation of the original RIM con-cept, however, is the underlying assumption of spatially ho-mogenous concentration–depth profiles and groundwater ta-ble positions, since data from only one RZ location was avail-able in these earlier studies.
To assess the hydrological and chemical variability of the riparian zone across a landscape, we recently established a Riparian Observatory in Krycklan (ROK). The ROK is a unique study design for monitoring the interaction between soil and stream water chemistry based on 13 riparian plots located in the 67 km2Krycklan catchment. We analyzed hy-drometric and total organic carbon (TOC) concentrations ob-served during 9 sampling occasions in 2008 and 2009 along with continuous groundwater and streamflow measurements. TOC was chosen over other solutes because several studies have recognized the RZ as the dominant TOC source (Hinton et al., 1998; Fiebig et al., 1990; Bishop et al., 1990; Dosskey and Bertsch, 1994) and because TOC is a key controlling factor for stream water quality (Hruˇska et al., 2003; Shafer et al., 1997; Erlandsson et al., 2008) that is sensitive to climatic change (K¨ohler et al., 2009). Moreover, the assessment of ri-parian TOC exports can provide much needed insights into the mechanisms that control contributions of inland waters to the global carbon cycle ( ¨Oquist et al., 2009; Battin et al., 2009; Cole et al., 2007).
In this study we investigated the spatiotemporal variability of groundwater levels, soil water TOC concentrations, and TOC export rates from the RZ of a boreal catchment in
Swe-den. This also tests the suitability of a lumped RZ representa-tion in catchment-scale water quality models, such as the RZ representation in the RIM model (Seibert et al., 2009). We further combined soil water TOC measurements and hydro-metric observations with landscape analysis to explore the idea that terrain indices can be used to predict groundwater levels and soil water TOC concentrations in riparian soils. This implies that combining terrain analysis with a spatially distributed RIM concept would make it possible to predict the spatial variability of riparian TOC concentrations, lateral flows and, thus, TOC exports from RZs in boreal forested catchments.
2 Study design
2.1 Location
Riparian groundwater tables and soil water chemistry were monitored in the 67 km2boreal Krycklan catchment, which lies within the Vindeln Experimental Forests (64◦140N, 19◦460E) about 50 km northwest of Ume˚a, Sweden (Fig. 1). The catchment is underlain by poorly weathered gneissic bedrock covered with sediment deposits at lower elevations and moraine (glacial till) deposits at higher elevations. The till deposits are hydrologically characterized by a sharp de-crease of hydraulic conductivity with depth (Bishop, 1991). Most streams have their headwaters in the till parts of the catchment, where the combination of gentle topography and less permeable substrate has led to the formation of some small lakes, wetlands and hydromorphic riparian peat soils. In the sedimentary parts of the catchment, several higher or-der streams become more defined in the landscape as chan-nels within deeply eroded ravines bordered by mineral ripar-ian soils (mostly gley). With increasing terrain slope or in-creasing distance from the stream, hydromorphic (mineral or organic) soils give way to well-drained podzols (spodosols), which represent the most abundant soil type in the Krycklan catchment.
The transition from wet, riparian hydromorphic soils to well-drained, upland podzols farther away from streams is accompanied by vegetation changes from mosses (Sphagnum spp.), deciduous trees (Betula spp., Alnus spp.) and Norway spruce (Picea abis) at humid locations to vaccinium shrubs (Vaccinium spp.) and Scots pine (Pinus sylvestris) at drier locations.
Based on records from 1980 to 2008, the mean annual air temperature in the catchment is 1.7◦C and the mean annual
Fig. 1. Locations of the (numbered) riparian monitoring sites (empty white circles) in the Krycklan catchment (outlined by thin black lines in
inset b) and the gauging station (triangle) at the outlet of Svartberget (outlined by grey lines in inset c). Streams and lakes are represented by black areas and thin black lines. Parts of the catchment underlain by till are shown as white areas and others underlain by alluvial sediment deposits are marked by the cross-hatched areas, respectively, while wetlands are highlighted as grey shaded patches. Only site numbers are shown because “R” prefixes used in the text (preceding the site digits) were omitted for better readability.
event in the year with peak flow values between 8 and 12 mm day−1 (Laudon et al., 2011). Streamflow has been monitored continuously since 1980 at a thin 90◦V-notch weir in a heated dam house located at the outlet of the 50 ha Svart-berget catchment (Fig. 1c).
Over the course of millennia, considerable amounts of or-ganic matter were built up in boreal ecosystems (particularly in areas underlain by glacial till) through the formation of valley bottom peat soils and wetlands (paludification). More recently, i.e. over the past several hundred years (Zackris-son, 1977), human activities began to influence large parts of northern Sweden, including the Krycklan catchment. To favor forest production under moist conditions, most stream channels in the region were deepened and additional ditches have been excavated since the end of the 19th century or ear-lier (Esseen et al., 1997).
In 1923 the Svartberget research forest was created. It covers about 25 % of the Krycklan catchment. Since then, forestry has continued to be practiced at low intensity. Forests still cover most of the catchment area (88 %) fol-lowed by wetlands (8 %), agricultural land (3 %) and lakes (1 %). Its history and land cover hence make the Krycklan area fairly representative for much of the interior of north-ern Sweden and probably similar to other boreal ecosystems influenced by paludification and low intensity forestry.
2.2 Riparian observatory in Krycklan (ROK)
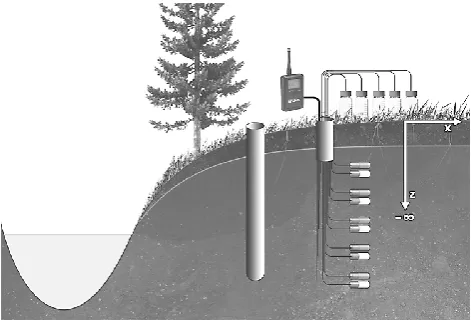
Fig. 2. Illustration of an instrumented riparian monitoring site. Pairs
of suction lysimeters are installed at 15, 30, 45, 60 and 75 cm be-low the soil surface at a distance of about 2 m from the stream. A perforated PVC tube equipped with an automatic water logging de-vice is located at mid-distance between the stream and the suction lysimeter nest. The schematic coordinate system on the right side of the figure illustrates the orientation and datum of the z-axis (depth, groundwater table) in relation to the x-axis (lateral flow, solute con-centration).
to monitor water table position continuously and to extract groundwater or soil water for chemical analysis. Each instal-lation was documented by noting site characteristics, includ-ing signs of variable groundwater tables as well as the thick-ness of the organic horizon. Based on the organic horizon thickness, the soils at each ROK site were further classified as organic, mineral–organic or mineral soils. Organic soils were peat (O-horizon thickness≥30 cm), and mineral soils were gley without organic matter (O-horizon thickness≤0.5 cm), while all other soils were classified as mineral–organic (gley with shallow O-horizons).
2.3 Soil water TOC measurements
Soil water samples were extracted manually from all suction lysimeters at the 13 ROK sites on 9 individual sampling oc-casions; in 2008 once per month from May to October and on three occasions (June, August and September) in 2009. Prior to sampling, the suction lysimeters were flushed by extract-ing up to 50 ml of water which were discarded. After flush-ing, soil water samples were extracted during a period of 24– 48 h and collected in acid-washed and pre-evacuated (pres-sure−1 bar) Milli-Q rinsed Duran glass bottles. The sam-ples were kept dark and cool until they were sub-sampled and frozen for later analysis. The time from sampling to freezing was typically less than 24 h. Soil water TOC was measured by a Shimadzu TOC-5000 using catalytic combustion. The TOC values of the water samples extracted from lysimeter pairs were individually analyzed and then averaged to obtain a single TOC concentration for each of the 5 levels monitored at each site on every sampling occasion.
It should be noted that suction lysimeters filter out parti-cles of diameters larger than 1 µm. It has also been shown that boreal surface waters usually carry negligible amounts of particulate organic carbon (POC), making dissolved or-ganic carbon (DOC) the dominant fraction (∼95 %) of TOC (Laudon et al., 2011). Consequently, the riparian soil water TOC concentrations presented in this study are directly com-parable to dissolved organic carbon (DOC) concentrations in the adjacent streams.
3 Combined analysis of hydrometric observations and TOC concentrations
3.1 Lateral flow profiles
Hourly groundwater levels measured at the individual ROK sites for the period May 2008 to September 2009 were re-lated to the corresponding values of specific discharge q (mm day−1) measured at the outlet of the Svartberget catch-ment (50 ha). In this study, lateral flow profiles represent the total specific groundwater discharge passing laterally through a soil profile expressed as a function of groundwater table position. Lateral flow profiles were subsequently used to calculate specific TOC export rates. To construct a lateral flow profile, observed groundwater table positionszGw (m)
were first offset by the maximum observed groundwater ta-ble positionz0 (m). The offset groundwater positions were
then fit to specific discharges using an exponential function with a flux variablek0(mm d−1) and shape variableb(m−1)
(Eq. 1). These parameters were determined by linear regres-sion with log-transformed specific discharge.
q(zGw)=k0·eb(zGW−z0) (1)
The mathematical expression of such a lateral flow profile can also be derived using Darcy’s law. The derivation (Eq. 2) is valid under the assumptions that (1) the transmissivity feedback concept (Bishop et al., 2011) coupled with Dar-cian flow is applicable, (2) hydraulic gradients dh/dl(−) are time-invariant, and (3) specific discharge rates are spatially homogenous. These assumptions are similar to those adopted by Seibert et al. (2009), who derived an analytical expres-sion for their suggested riparian profile flow–concentration integration model (RIM). The specific discharge from a hill-slope with an areaAc (m2) flowing into the stream along a stream segment of lengthL(m) can be estimated based on Darcy’s law.AcandLcan be combined into specific lateral contributing areaac=Ac/L(m) (Beven and Kirkby, 1979), and groundwater fluxes from below 1 m depth (zbase=−1 m)
are assumed to be negligible, i.e.q(z≤zbase)≈0.
q(zGw)=
K·dh/dl ac
·
zGw Z
zbase
eb(z−z0)dz (2)
=K·dh/dl b·ac
·eb(zGw−z0)=k
To reduce scatter in the groundwater–streamflow relation-ships, hourly discharge records were binned at 1 cm ground-water level intervals across the total depth profile (1 m). In addition, periods with surface flow (defined as periods when measured groundwater tables were above the soil surface, see Table 1) were removed from the time series of groundwater levels. These periods were removed because surface flow vi-olates the assumption of matrix flow when fitting flow pro-files. Surface flow occurred intermittently and mainly at sites adjacent to wetlands.
Suitable exponentially shaped lateral flow profiles were es-tablished for all ROK sites except for site R14. At this site the groundwater table varied little with streamflow and remained within 5 cm below the soil surface during most of the period of observation. Consequently, an exponential curve (Eq. 1) could not be fit to the observed data and a linear flow profile was chosen instead (Eq. 3).
q(z)=k0·
z−zbase
zbase
(3) As before, the value of the profile basezbasewas set to−1 m.
The linear flow profile was manually adjusted to observed data by assuming no flow belowzbaseand a specific discharge
rate of 5.8 mm d−1 (corresponding to the average specific discharge at high groundwater tables) when the groundwa-ter table ingroundwa-tersects the soil surface. While the adjusted lat-eral flow profile at site R14 could not be experimentally con-firmed, this choice had only a negligible effect on the calcu-lation of specific riparian TOC export rates due to the nearly constant TOC concentration profile (see following sections). 3.2 Flow-weighted TOC concentrations and specific
riparian TOC export rates
Specific TOC export rates (i.e. the flux of TOC exported through a ROK soil profile normalized by laterally contribut-ing area) were computed uscontribut-ing the riparian profile flow– concentration integration modeling (RIM) approach (Seib-ert et al., 2009). For this, 117 (13 sites, 9 occasions) v(Seib-erti- verti-cally continuous TOC concentration profiles were generated by interpolating linearly between measured soil water TOC concentrations observed during a given sampling occasion at each of the 5 depth intervals for each ROK site. To ex-trapolate TOC concentrations above the most superficial pair of suction lysimeters (15 cm), TOC concentrations were as-sumed to be the same as the average measured at the most superficial pair of lysimeters. Correspondingly, to extrapo-late TOC concentrations below the lowest pair of suction lysimeters (75 cm), TOC concentrations were assumed to be the same as observed at the deepest lysimeter.
In total, 13 % of the data were missing due to sample con-tamination, too little sample volume or equipment malfunc-tioning. The most complete dataset was collected in August 2009 (3 % missing data) while the most gaps occurred in May 2008 (25 % missing data). For most profiles more than 4 of
5 concentrations were available. Profiles with many missing values (between 2 of 5 and 5 of 5 concentrations measured per campaign) were located at relatively dry sites R1, R4 and R9. On a single occasion (site R4 in September 2008), no wa-ter at all could be extracted from the profile. A missing value was estimated by the average TOC concentrationcTOC(z∗)
of all measurements at the corresponding depthz∗(m) multi-plied by a scaling factor, which was calculated as the average of then ratios of observed TOC concentrations cTOC(z, t )
available at the time t of sampling to the TOC concentra-tions cTOC(z)at the corresponding depths averaged across
all 9 samplings (Eq. 4). For the single occasion at site R4 in September 2008 when all concentration data were missing, an average concentration profile was assumed (i.e. the scal-ing factor was set to 1).
c∗TOC(z, t )=1 n·
n X
i=1
cTOC(z, t )
cTOC(z)
·cTOC(z∗) (4)
After establishing the continuous TOC concentration pro-files, flow weightsω(z)(−), which are values proportional to the incremental lateral specific groundwater discharge rates dq(z)/dz, were derived for each ROK site using the exponen-tial lateral flow profile (Eq. 1), except for site R14 for which the linear lateral flow profile (Eq. 3) was used.
ω(z)=dq/dz k0
=b·eb(z−z0) (5)
ω(z)=dq/dz k0
=1 (6)
Flow-weighted TOC concentrations cTOC,q(t ) were subse-quently computed for each ROK site and sampling occasion by juxtaposing flow weights and continuous TOC profiles and integrating over the part of the profile that was below the groundwater table (z≤zGw) at the time of sampling (Eq. 7).
cTOC,q(t )= zGw Z
zbase
ω(z)·cTOC(t, z)dz
, zGw Z
zbase
ω(z)dz (7)
Finally, specific riparian TOC export rates lTOC
(kg ha−1yr−1) were obtained by multiplying the flow-weighted TOC concentrations with specific discharge and applying a conversion factor to express the result in (kg ha−1yr−1) (Eq. 8).
lTOC(t )=q(t )·cTOC,q(t )·3.65 (8)
4 Landscape and regression analysis
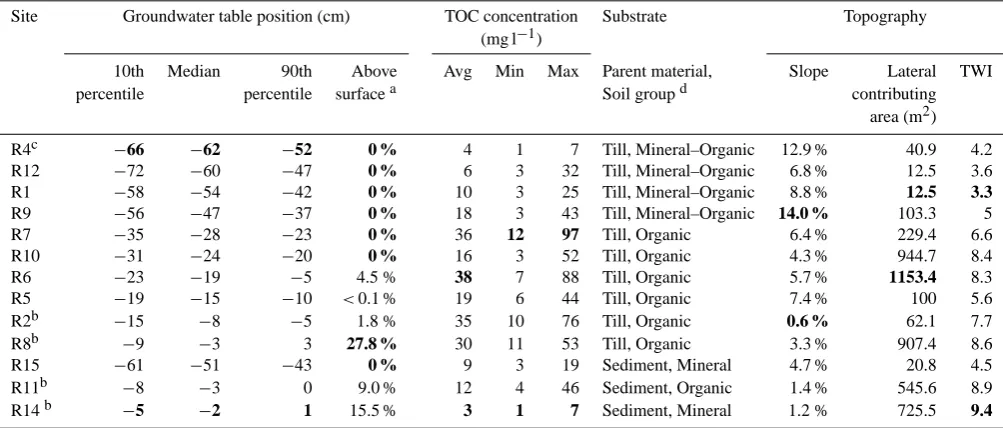
Table 1. Site characteristics (minimum and maximum in each column are shown as bold numbers).
Site Groundwater table position (cm) TOC concentration Substrate Topography (mg l−1)
10th Median 90th Above Avg Min Max Parent material, Slope Lateral TWI percentile percentile surfacea Soil groupd contributing
area (m2)
R4c −66 −62 −52 0 % 4 1 7 Till, Mineral–Organic 12.9 % 40.9 4.2 R12 −72 −60 −47 0 % 6 3 32 Till, Mineral–Organic 6.8 % 12.5 3.6 R1 −58 −54 −42 0 % 10 3 25 Till, Mineral–Organic 8.8 % 12.5 3.3
R9 −56 −47 −37 0 % 18 3 43 Till, Mineral–Organic 14.0 % 103.3 5 R7 −35 −28 −23 0 % 36 12 97 Till, Organic 6.4 % 229.4 6.6 R10 −31 −24 −20 0 % 16 3 52 Till, Organic 4.3 % 944.7 8.4 R6 −23 −19 −5 4.5 % 38 7 88 Till, Organic 5.7 % 1153.4 8.3 R5 −19 −15 −10 <0.1 % 19 6 44 Till, Organic 7.4 % 100 5.6 R2b −15 −8 −5 1.8 % 35 10 76 Till, Organic 0.6 % 62.1 7.7 R8b −9 −3 3 27.8 % 30 11 53 Till, Organic 3.3 % 907.4 8.6 R15 −61 −51 −43 0 % 9 3 19 Sediment, Mineral 4.7 % 20.8 4.5 R11b −8 −3 0 9.0 % 12 4 46 Sediment, Organic 1.4 % 545.6 8.9 R14b −5 −2 1 15.5 % 3 1 7 Sediment, Mineral 1.2 % 725.5 9.4
aPercentage of time (relative to the total record length) with groundwater tables positioned above the soil surface. bAdjacent to a wetland.
cSoil profile with both spodic (podzol) characteristics in the upper and gley characteristics in the lower part of the profile.
dSoil groups: Mineral≡gley soil with O-horizon<5 cm, Mineral–Organic≡gley soil with O-horizon≥5 cm and<30 cm, Organic≡peat with O-horizon≥30 cm.
derived from LiDAR data. The terrain indices were com-puted using the open source software SAGA GIS (Conrad, 2007; B¨ohner et al., 2008) and comprise specific upslope contributing area (ac, as a surrogate for shallow groundwa-ter flow accumulation), slope (tanβ, as a surrogate for lo-cal drainage), and the topographic wetness index (TWI, as a surrogate for shallow groundwater table position)(Beven and Kirkby, 1979). Upslope contributing area was calculated us-ing a multiple direction flow accumulation method (MD∞; Seibert and McGlynn, 2007). Slope was computed based on the derivate of a polynomial surface that was locally fitted to the DEM (Zevenbergen and Thorne, 1987). The stream network was derived using the “Channel Network” module in SAGA GIS (Conrad, 2007; B¨ohner et al., 2008) and an initiation threshold area of 5 ha calculated using the MD∞
method. To account for artificially excavated ditches, several streams were set to start at the beginning of ditches that had been identified in the field even if the accumulated area was below the initiation threshold area.
Side-separated lateral contributing areas to all ROK sites and along the entire stream network were quantified using the SIDE algorithm by Grabs et al. (2010). Lateral contribut-ing areas were divided by the grid-resolution (5 m) to obtain specific contributing area values (ac). Local TWI values were calculated for the RZs on both sides of the stream as the loga-rithm of specific (side-separated) contributing areaacdivided by local slope tanβ(Eq. 9).
TWI=ln a
c tanβ
(9)
To evaluate correlations, Spearman rank correlation coef-ficients, rs, were computed between observed TOC
con-centrations and the derived terrain indices (slope, upslope contributing area and TWI). Preliminary results indicated that TWI and soil depth were the major explanatory vari-ables. For quantification, three different regression models to predict log-transformed average TOC concentrations at specified depths and landscape positions (characterized by log-transformed TWI values) were established using robust, multiple linear regression (Venables and Ripley, 2002). Ro-bust regression methods can be effectively applied to het-eroskedastic datasets including potential outliers and allow a considerably more robust estimation of parameters than stan-dard regression methods. The three regression models were established using TOC values measured at different depths and locations in the till parts of the catchment. For each site and depth, the average TOC value of all 9 sampling occa-sions was calculated. The tested regression models relied on TWI and soil depth as the only predictor variables.
5 Results
5.1 Hydrometric observations and soil water TOC concentrations
relatively humid or wet positions (−0.45<z¯Gw) in the RZ,
whereas mineral–organic soils were located on till deposits at relatively dry positions (z¯Gw<−0.45) in the RZ. RZs on
sediment deposits were mineral with exception of site R11. Soil water TOC concentrations varied from 3 to 97 mg l−1 at organic soils, from 1 to 43 mg l−1at mineral–organic, and from 1 to 19 mg l−1at mineral soils (excluding site R11) (Ta-ble 1). Site R11 was excluded because it was organic peat at the transition between till and sedimentary deposits, with TOC concentrations of 4–46 mg l−1. R11 had a lower maxi-mum concentration compared with other organic (peat) soils and a higher minimum concentration compared with min-eral soils. Average concentration profiles in till soils showed generally higher TOC concentrations at sites with more su-perficial water tables (Fig. 3), as was reported by Lyon et al. (2011). For most TOC concentration profiles in till soils, TOC concentrations also increased towards the soil surface.
RZs in the till parts were ordered with increasing me-dian groundwater table positions (z¯Gw) and further grouped
into relatively dry mineral–organic (z¯Gw≤ −0.45 m), humid
organic (−0.45<z¯Gw≤ −0.15 m) and wet organic (z¯Gw> −0.15 m) soils (Fig. 3). The wettest riparian till site (R8) was situated near the outlet of the Kallk¨allsmyren headwater wetland (z¯Gw= −0.03 m), while the relatively driest riparian
till site (R4) was found on a gley podzol (z¯Gw= −0.62 m).
Relatively low groundwater levels at the mineral–organic RZs (such as R4) could in part be explained by low ups-lope contributions of water (indicated by the low values of lateral contributing area, Table 1) and effective drainage re-lated to terrain slope (Table 1) in conjunction with stony soils or ditching. Average TOC concentration–depth gradi-ents (assuming exponential decrease with depth) in the till part of the catchment (Fig. 3) were, with respect to differ-ent groundwater table positions, steepest at humid locations (50 % less TOC per 53 cm increase in depth), followed by those at wet locations (50 % less TOC per 96 cm increase in depth). TOC concentration–depth profiles at the mineral– organic locations, on the other hand, showed hardly any in-creases in soil water TOC concentrations towards the soil sur-face. Temporal variability of TOC concentrations measured in soils underlain by till (expressed by the standard deviation) increased with increasing TOC concentrations and with more superficial positions in the soil profiles (Fig. 3). Site R9 de-viated from this pattern; there, average TOC concentrations slightly increased between 0.75 m to 0.45 m depth but then decreased between 0.45 m and 0.15 m depth.
RZs in the sedimentary parts were mineral (R14 and R15) and organic (R11) and differed from RZs in the till parts with respect to accumulation of organic matter because it is unrelated to groundwater table position. This observation is consistent with the results from a more detailed riparian soil survey (Blomberg, 2009) indicating that RZs in the sed-imentary parts are predominantly mineral gley soils. In other words, paludification of these RZs did not occur even in the presence of almost permanently saturated soils at site R14
(z¯Gw>−0.02 m). Median groundwater table positions at
sites R11 and R15 were−0.03 m and−0.51 m, respectively. Mineral RZs had relatively low TOC concentrations and no characteristic shape to the vertical profile of TOC, whereas the organic RZ exhibited a similar TOC concentration–depth gradient as seen in organic RZs in the till parts. TOC con-centration depth gradients varied from positive (site R15) to negative (site R11) and to almost zero (Site R14). Temporal variability of TOC concentrations at the mineral RZs in the sedimentary parts was low and comparable to the variability in mineral–organic till soils (Fig. 3).
5.2 Flow-weighted TOC concentrations and specific riparian TOC export rates
For all ROK sites, except for site R14, exponentially shaped lateral flow profiles could be fit reasonably well to the binned observation data (Fig. 4). This allowed derivation of corre-sponding depth dependant flow weights (curved grey lines in Fig. 3). Flow-weighted concentrationscTOC,q for each site and sampling occasion (Fig. 5b) were computed consecu-tively from the continuous TOC profiles and flow weights (Eq. 5). Specific riparian TOC export rates (i.e. export per unit of laterally contributing area) for a particular day,lTOC,
which were calculated from specific discharge valuesq and flow-weighted concentrationscTOC,q (Eq. 6), ranged from 2 to 285 kg ha−1yr−1 (per unit of laterally contributing area) and varied strongly with discharge conditions (Fig. 5c and d). It should be noted that the specific riparian export rates were calculated on a daily basis but that their unit was ex-pressed as flux per year to facilitate comparison with other values published in scientific literature (where fluxes are of-ten calculated on a yearly basis).
The shapes of the distributions of average soil water TOC concentrations (Fig. 5a) varied because of changing soil water TOC concentrations at the 9 sampling occasions. Variations of calculated flow-weighted TOC concentrations (Fig. 5b) and specific riparian TOC export rates (Fig. 5c), on the other hand, reflected the combined effect of temporally variable TOC concentrations and variable specific discharge and groundwater conditions (Fig. 5d). In both 2008 and 2009, average values of TOC concentrationscTOCacross each
pro-file were slightly higher in August and September compared to values in June (Fig. 5a). A slight trend of average TOC concentrations increasing from spring to fall was visible in 2008. There were only three sampling occasions in 2009, which was too few to detect any trend.
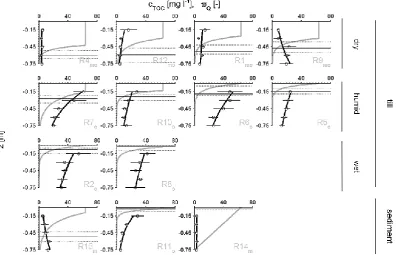
Fig. 3. Average TOC concentrationscTOC(circles) from 9 sampling occasions (2008–2009), interpolated TOC profiles (black lines), median
groundwater position (solid, grey horizontal line), and the (dimensionless) weighting functionsωobtained from lateral flow profiles (light-grey curves) for all 13 sites. The range of temporal variability of TOC concentrations at different depths is represented by horizontal black lines (average concentration±1 standard deviation) and the range of temporal variability of groundwater positions is indicated by dotted grey horizontal lines (10th and 90th percentile of groundwater positions). Each subplot contains a site label located in the lower right corner. The subscripts next to each site number in the labels indicate mineral (m), mineral–organic (mo) and organic (o) soil profiles. Rows 1 to 3 represent soil plots underlain by till deposits and sorted according to increasingly shallow average groundwater positions (dry, humid and wet locations in the 1st, 2nd and 3rd rows, respectively). The lower 4th row contains sites underlain by sediment deposits.
maximumcTOC,q when combining all observed TOC con-centration profiles with 10th percentile and 90th percentile groundwater positions) (Fig. 6a). Potential variations of flow-weighted TOC concentrations at each site increased with increasingly organic soils and increasingly shallow median groundwater positions.
5.3 Landscape and regression analysis
Median groundwater table positions correlated to the TWI (Fig. 6b) at all ROK sites, and the corresponding median flow-weighted TOC concentrations of all ROK sites, except site R14, correlated to the TWI and median groundwater table positions (Fig. 6a and c). While the shallow median groundwater table position at R14 coincided with the highest TWI value, flow-weighted TOC concentrations were largely overestimated for this mineral RZ.
Regression models to predict average TOC concentrations at the various depths were developed for the ROK sites in the till parts of the catchment. ROK sites in the sedimentary part were not included because (1) independent field surveys had shown that most RZs in the sedimentary part were min-eral gleys (Blomberg, 2009) and (2) there were only three
ROK sites in the sedimentary part. Regression fits for TOC concentrations in the till part were visually evaluated by plot-ting predicted against observed average TOC concentrations (Fig. 7). For simplicity, only TWI was selected for regres-sion modeling since it correlated more with observed average TOC concentrations (rs=0.67) than slope and laterally
con-tributing area (rs= −0.65 andrs=0.58 respectively). Since
linear robust regression models were fit on logarithmically transformed variables, plots were generated for the variables at the logarithmic scale (Fig. 7a, c and e) and at the original scale (Fig. 7b, d and f). Robust regression with depth as the only predictor (mean absolute error of 12 mg l−1TOC)
Fig. 4. Binned measurements of groundwater level plotted against specific discharge (circles). Fitted, site-specific lateral flow profiles and
their respective 95 % confidence intervals are shown as thin black lines and (thin) grey shaded areas. Each subplot contains a site label located in the lower right corner. The subscripts next to each site number in the labels indicate mineral (m), mineral–organic (mo) and organic (o) soil profiles. Rows 1 to 3 represent soil plots underlain by till deposits and sorted according to increasingly shallow average groundwater positions (dry, humid and wet locations in the 1st, 2nd and 3rd rows, respectively). The lower 4th row contains sites underlain by glaciofluvial sediment deposits.
comparison of predicted against observed average TOC con-centrations still revealed a lot of scatter, points were dis-tributed more randomly around the 1 : 1 line with fewer ap-parent clusters than in the regression models based on single predictor variables.
6 Discussion
6.1 Hydrometric observations and soil water TOC concentrations
The range of riparian soil water TOC concentrations (from 1 mg l−1 to 97 mg l−1, Table 1) measured in this study was almost twice as wide as the range of stream TOC concen-trations at Krycklan (Buffam et al., 2007) and other bo-real Swedish catchments (Laudon et al., 2004a; Temnerud and Bishop, 2005). The dominant sources of stream TOC in Krycklan are organic riparian soils, together with headwater wetlands, and not the TOC mobilized from podsols at hill-slopes draining into the RZ (Bishop et al., 1990; Laudon et al., 2011). This corresponds to findings in other catchments with high TOC levels (>10 mg l−1) (Hinton et al., 1998; Fiebig et al., 1990; Bishop et al., 2004; Dosskey and Bertsch, 1994). Differential mixing of riparian soil waters from
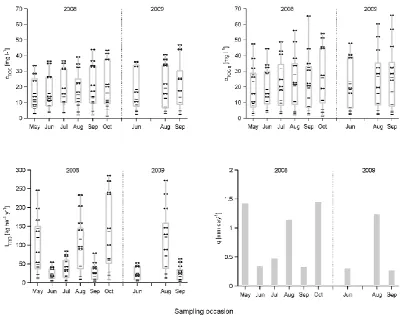
Fig. 5. Ranges of average TOC profile concentrationscTOC: (a) flow-weighted profile concentrationscTOC, q(b) and specific TOC export
rateslTOC(c) and the specific dischargeq(d) at the time of 9 individual sampling occasions (6 in 2008 and 3 in 2009). For each campaign
the ranges of TOC-related variables (left y-axis) are illustrated by box plots (contoured by light-shaded lines) and site-specific values (short, dark-shaded horizontal lines). Site specific values from organic till sites are additionally highlighted by dots at both ends of the corresponding horizontal lines while values from mineral or mineral-organic are shown without dots.
Fig. 6. Links between median groundwater positionszGW, median flow-weighted TOC profile concentrationscTOC,q, and the topographic wetness index (TWI). In the left plot, (a), median flow-weightedcTOC,qvalues (from 9 sampling occasions in 2008–2009) are plotted against medianzGWvalues. The middle plot, (b), compares medianzGW values against the TWI, whereas the right plot, (c), compares median
[image:10.595.69.527.453.601.2]Fig. 7. Modeled versus predicted average TOC concentrations
(empty circles) for 10 riparian monitoring sites and 5 different depths (15, 30, 45, 60 and 75 cm below the surface) in the till part of the catchment. In the upper row log-transformed TOC concen-trations are shown. Three regression models for TOC were tested using depth (first column), TWI (middle column), as well as using both depth and TWI as predictors (right column).
even when considering only the RZs in the till part of the Krycklan catchment (Fig. 3), which one otherwise might eas-ily and mistakenly think of as being rather homogenous when one does not have the type of spatial detail in TOC concen-tration measurements that could be obtained with the ROK.
All ROK sites except sites R9 and R15 exhibited a trend of increasing soil water TOC concentrations with more superfi-cial soil horizons. As site R9 is located on stony till next to a ditched stream, its soil profile might have been subjected to disturbances despite now being located in a RZ. It is also pos-sible that paludification was less pronounced at this site. At site R15, which lies in the sediment part of Krycklan, neither the mineral riparian gley soils nor the adjacent hillside pod-zols seem to be likely sources of the observed TOC enriched soil water (up to 19 mg l−1at 60 cm depth) in the lower parts of the profile. TOC enriched water might have however orig-inated (1) from locally buried organic matter in this actively scoured and aggrading flood plain, (2) in the drainage water from a small agriculture field located 50 m upslope or, (3) in hyporheic fluxes between the stream and the RZ. Carbon dat-ing techniques might help to further investigate this question. Despite the overall variability of observed concentration– depth profiles, some common patterns emerged, especially for sites located in the till parts of the catchment where the ROK instrumentation was concentrated. Here, varying soil wetness conditions appeared to influence the total amount of soil water TOC as well as the shape of the TOC concentra-tion profiles. Organic matter has not built up in drier, more organic-poor (mineral) till soils to the same degree as on
more humid (organic-rich) till soils, giving lower levels of TOC and less pronounced vertical gradients in TOC (Fig. 3). The lack of a common discernable TOC concentration– depth profile at the sedimentary sites could be attributed to the small number of sites as well as to an unclear relation between substrate and soil organic matter accumulation. An extrapolation from three sites to the entire RZ in the sedimen-tary zone would obviously be uncertain, especially as two of these were selected as interesting extremes rather than typi-cal sedimentary riparian sites. Observations from an indepen-dent riparian soil inventory at Krycklan (Blomberg, 2009), however, indicate that most riparian soils in the sedimen-tary parts of the catchment were mineral gley soils. Based on these observations we would expect TOC concentrations in water outflows from sedimentary RZs to be around 6 mg l−1 (average of all TOC concentrations measured at sites R14 and R15).
Although we found organic soils mostly in RZs under-lain by till whereas sedimentary substrate seemingly implied mineral soils, the apparent link between parent substrate (till or sedimentary material), soil organic matter (in this case mostly peat) and soil water TOC has yet to be explained. Soil moisture is often not a limiting factor for peat forma-tion in the sedimentary parts as groundwater levels are sim-ilarly close to the ground surface as for till sites, which sug-gests that varying hydraulic properties of the substrate are probably not a sufficient explanation. Other potential fac-tors that might substantially influence riparian peat formation and, subsequently, riparian soil water TOC concentrations in-clude differing substrate erodibility or ionic composition of soil- or groundwater (Almendinger and Leete, 1998; Nilsson et al., 1991; Giesler et al., 1998). One additional ROK site (R13, not shown on map) was destroyed after being buried under sediments from a fourth order stream during spring flood 2008. This event highlights fluvial processes as an ad-ditional factor that might hinder the accumulation of organic matter in sedimentary RZs close to high order streams. At the 67 km2 catchment scale, the presence of mineral ripar-ian soils in the lower part of that catchment is another po-tential explanation for the observed downstream decreases in stream TOC concentrations in Krycklan ( ˚Agren et al., 2007) that does not rely directly on the spatial distribution of wet-lands.
Temporal variations of soil water TOC concentrations are potentially influenced by a multitude of interacting factors (Kalbitz et al., 2000) including soil temperature (Freeman et al., 2001), antecedent wetness (K¨ohler et al., 2009), soil frost (Haei et al., 2010), atmospheric deposition (Monteith et al., 2007), atmospheric CO2 concentrations (Freeman et
interpreted as a measure of the sensitivity of the soil solution response to a change of one or more external factors. Mineral and mineral–organic RZs at dry till or sedimentary locations appeared less susceptible to change over short periods than organic RZs at humid or wet till locations (Fig. 5). At wet RZs, temporal changes in soil water chemistry were directly transferred to surface water systems because all soil horizons (in particular organic-rich surficial horizons) were saturated most of the time (i.e. hydrologically connected). At humid RZs, temporal changes in soil water chemistry in the tran-siently saturated part of the profile (delimited by grey, dotted horizontal lines, Fig. 3) were only propagated to surface wa-ters when these horizons had become saturated (i.e. hydro-logically connected). It thus appeared (when neglecting po-tential effects of laterally expanding or shrinking discharge areas) that (1) very wet or permanently saturated RZs influ-enced surface water chemistry more through biogeochemical variations in the soil water, while (2) humid or transiently saturated RZs influenced surface water chemistry more as a result of the interplay between biogeochemical and hydro-logical variations.
6.2 Flow-weighted TOC concentrations and specific riparian TOC export rates
The RIM concept (Winterdahl et al., 2011b; Seibert et al., 2009) was used to calculate riparian TOC export rates. RIM only accounts for riparian TOC exported by lateral subsur-face flows through a single, chemostatic soil profile. Conse-quently, other potential flow pathways (such as groundwater recharge to the streambed or overland flow) and biogeochem-ical processes during transport through the RZ were not taken into account. The effect of alternative flow pathways which could partially bypass the RZ was not assessed in detail, though other studies have confirmed the strong relationship between stream flow and riparian groundwater levels (Seib-ert et al., 2002). However, periods of potential overland flow as indicated by groundwater levels above surface were rela-tively limited at most ROK sites (Table 1). This also agrees with the transmissivity feedback mechanism (Bishop, 1991; Bishop et al., 2011), which implies that even during relatively high discharge conditions most runoff reaches the stream as shallow subsurface flow rather than as overland flow. That 1991 study also examined lateral versus vertical hydraulic gradients during stream events and concluded that on two till hillslopes in the vicinity of the ROK, upwelling groundwater is not a major factor as lateral subsurface flow is the domi-nant flow component.
In contrast to the transmissivity feedback mechanism (Bishop, 1991; Laudon et al., 2004b; Nyberg et al., 2001; Kendall et al., 1999; Rodhe, 1989), the two additional as-sumptions (constant hydraulic gradients and homogeneous specific discharge) that underlie the derivation of lateral flow profiles have been less intensively studied in the past. Het-erogeneous land cover and topography, for instance, might
influence the timing, magnitude and direction of hydraulic gradients in the RZ (Bishop, 1994; Vidon and Smith, 2007; Rodhe and Seibert, 2011), as well as the spatial variability of specific discharge rates (Temnerud et al., 2007; Lyon et al., 2012).
Horizontally changing riparian hydraulic gradients effect calculations in this study to a lesser degree because (1) the magnitude of riparian hydraulic gradients and their possible variation are usually small compared to the associated rela-tive changes of flow (Bishop, 1991) and because (2) slight changes of flow directions in the direct vicinity of streams have little effect on TOC concentrations as long as the flow is not reversed. The possibility of a reversal of flow, i.e. streams recharging water into the RZ, has not been further investi-gated but can be considered as rather unlikely for the sites in this study.
The use of homogeneous specific discharge rates observed at a single gaging station could introduce a considerable amount of uncertainty in the estimates of lateral flow profiles and riparian TOC exports. The streamflow and groundwater table data were binned to reduce scatter, resulting in scatter plots with little amounts of apparent noise (Fig. 4). Still, it can be expected that the uncertainty of lateral flow profiles increases with increasing specific discharge. Potential impli-cations for flow-weighted TOC concentrations and specific riparian export rates depend on the TOC concentration–depth profiles. For relatively constant profiles (such as site R14), the exact shape of the flow profile is of minor importance, whereas it can be crucial for sites with strongly curved con-centration depth profiles (such as site R7).
Overall, TOC exports from different riparian soil profiles in this study (2–285 kg ha−1yr−1), even if only sustained for
dry till RZs or mineral soils at RZs underlain by sediments exhibited only relatively little changes in soil water TOC re-lated attributes (Fig. 3).
It is noteworthy that TOC exported from the RZ, and in particular its labile fraction, might be subject to addi-tional processes in the hyporheic zone. Although we hypoth-esize that much of the estimated lateral riparian TOC ex-port reaches the stream, a part of it might be metabolized in either the hyporheic zone or within the stream itself and transformed to dissolved inorganic carbon (DIC). The low rates of TOC breakdown relative to the short time that water spends in the largely shaded stream channels of the Kryck-lan streams (Wallin et al., 2010) and measured rates of TOC mineralization (K¨ohler et al., 2002) indicate, however, that only a few percent of the TOC will be mineralized in the stream. The rate of hyporheic processing of TOC has not, to our knowledge, been quantified in Fennoscandian streams, or been suggested to be a major factor in downstream patterns of TOC (Temnerud et al., 2007).
6.3 Landscape and regression analysis
The TWI appeared appropriate for predicting groundwater tables in RZs located in both till and sedimentary parts of the catchment (Fig. 6). On the other hand, the TWI was found suitable for predicting TOC-related RZ attributes only in the till parts of the catchment, where TOC was also considerably more variable than in the sedimentary parts (Fig. 7). In the till areas, combining TWI and depth allowed prediction of the spatial variability of average TOC concentrations both at different riparian landscape positions and at different depths (Fig. 7e and f). This is an important step forward compared to previous studies relying on a single riparian soil profile to represent the entire RZ in a catchment (Seibert et al., 2009; K¨ohler et al., 2009). This opens up possibilities for repre-senting the spatial variability of stream TOC using the RIM approach. The poor fit when using a regression model based on depth as single predictor variable further underlined the need to account for the RZ heterogeneity in the landscape. Upscaling carbon-related attributes of the RZ such as soil water TOC concentrations or soil carbon storages based on the TWI is a promising approach that is sufficiently general to be transferred to other catchments in cold climates.
In addition to spatially variable TOC concentrations and groundwater tables, the temporal variability in both lateral flows and TOC profiles must be explicitly accounted for to fully simulate dynamic riparian carbon exports. Since groundwater tables (Fig. 6b) and flow pathways can be re-lated to topography (Grabs et al., 2009, 2010; Lyon et al., 2011), topographic landscape analysis is an approach for upscaling hillslope scale hydrological understanding to the landscape scale. Temporal variations of concentration depth profiles, however, also need to be addressed. We have made a start, but in contrast to water fluxes, soil solution chemistry may depend on other factors than just the water balance, so
a further refinement could be to incorporate additional infor-mation including antecedent conditions, varying temperature (K¨ohler et al., 2009; Winterdahl et al., 2011a) or measures of biological activity. The effect of temporal variations of TOC concentrations on flow weighted TOC concentrations and specific riparian TOC export rates is strongest in organic RZs (Figs. 5b, c and 6a, c), which are also the dominant sources of stream water TOC in Krycklan. Here, the assump-tion of time-invariant average TOC concentraassump-tion depth pro-files (assuming average TOC concentration depth propro-files) would result in substantially underestimated ranges of flow-weighted TOC concentrations (solid error bars in Fig. 6a and c) compared to the potentially wide ranges assuming tem-porally varying flow-weighted TOC concentrations (dotted error bars in Fig. 6a and c).
The combined influence of spatial and temporal hetero-geneities of groundwater table positions and TOC con-centration depth profiles for different RZs could be sum-marized schematically (Fig. 8). Groundwater tables were most variable in relatively dry RZs. However, the variabil-ity of groundwater tables implied a high variabilvariabil-ity in flow-weighted concentrations only at humid or wet organic RZs. This was because the variability of soil water TOC concen-trations was low in mineral and mineral–organic soils, which meant that flow-weighted concentrations did not vary much, regardless of the groundwater table variations.
7 Conclusions
Fig. 8. Schematic figure showing the temporal variability of selected
variables as a function of riparian zone wetness.
catchments. Based on our analysis of hydrometric data and TOC measurements, riparian zones along the stream network contribute differently to the observed variability of stream water TOC. In particular, we found that organic riparian zones with peat soils and shallow groundwater tables fluc-tuating within the upper 40–50 cm of the soil column were hotspots that controlled most of the temporal variability of riparian TOC exports to streams. The spatial variability of riparian-derived TOC in streams, on the other hand, appeared to be influenced by an upstream mosaic of mineral, mineral– organic and organic riparian zones along the stream network.
Acknowledgements. The financial support for this project was
partly provided by the Swedish Research Council (VR, grant no. 2005-4289). This study is part of the Krycklan catchment study which is funded by VR, Formas (ForWater), Mistra (Future Forest), SKB and the Kempe Foundation. Special thanks to Julia Paraskova, Magdalena Nyberg, the Krycklan crew and many others for excellent field and laboratory work as well as to Claudia Teutschbein for illustrating the design of the riparian monitoring sites (Fig. 2).
Edited by: N. Ohte
References
˚
Agren, A., Buffam, I., Jansson, M., and Laudon, H.: Importance of seasonality and small streams for the landscape regulation of dissolved organic carbon export, J. Geophys. Res.-Biogeo., 112, G03003, doi:10.1029/2006JG000381, 2007.
Almendinger, J. E. and Leete, J. H.: Peat characteristics and groundwater geochemistry of calcareous fens in the Minnesota River Basin, USA, Biogeochemistry, 43, 17–41, doi:10.1023/A:1005905431071, 1998.
Battin, T. J., Luyssaert, S., Kaplan, L. A., Aufdenkampe, A. K., Richter, A., and Tranvik, L. J.: The boundless carbon cycle, Nat. Geosci., 2, 598–600, 2009.
Berggren, M., Laudon, H., and Jansson, M.: Hydrological control of organic carbon support for bacterial growth in boreal headwater streams, Microbial Ecol., 57, 170–178, 2009.
Beven, K. J. and Kirkby, M. J.: A physically based, variable con-tributing area model of basin hydrology, Hydrolog. Sci. Bull., 24, 43–69, doi:10.1080/02626667909491834, 1979.
Bishop, K. H.: Episodic increases in stream acidity, catchment flow pathways and hydrograph separation, University of Cambridge, UK, 246 pp., 1991.
Bishop, K. H.: Return flow in till hillslopes, Dep. of Forest Ecol-ogy, Swedish University of Agricultural Sciences: Final report of a project funded by the Swedish Geological Survey, Ume˚a, 36, 1994.
Bishop, K. H., Grip, H., and O’Neill, A.: The origins of acid runoff in a hillslope during storm events, J. Hydrol., 116, 35–61, 1990. Bishop, K., Lee, Y. H., Pettersson, C., and Allard, B.: Terrestrial sources of methylmercury in surface waters: The importance of the riparian zone on the Svartberget catchment, Water Air Soil Poll., 80, 435–444, doi:10.1007/bf01189693, 1995.
Bishop, K., Seibert, J., K¨ohler, S., and Laudon, H.: Resolving the double paradox of rapidly mobilized old water with highly vari-able responses in runoff chemistry, Hydrol. Process., 18, 185– 189, 2004.
Bishop, K., Seibert, J., Nyberg, L., and Rodhe, A.: Water storage in a till catchment, II: Implications of transmissivity feedback for flow paths and turnover times, Hydrol. Process., 25, 3950–3959, doi:10.1002/hyp.8355, 2011.
Blomberg, M.: Can a high-resolution digital elevation model predict the thickness of the organic soil layer in the riparian soil?, M.Sc., Department of Aquatic Sciences and Assessment, Swedish Uni-versity of Agricultural Sciences, Uppsala, Sweden, 54 pp., 2009. B¨ohner, J., Blaschke, T., and Montanarella, L.: SAGA: System for an automated geographical analysis, in: Hamburger Beitr¨age zur Physischen Geographie und Landschafts¨okologie, edited by: Schickhoff, U. and B¨ohner, J., Institute of Geography, University of Hamburg, Hamburg, 2008.
Boyer, E. W., Hornberger, G. M., Bencala, K. E., and McKnight, D.: Overview of a simple model describing variation of dissolved organic carbon in an upland catchment, Ecol. Model., 86, 183– 188, 1996.
Buffam, I., Laudon, H., Temnerud, J., Morth, C. M., and Bishop, K.: Landscape-scale variability of acidity and dissolved organic car-bon during spring flood in a boreal stream network, J. Geophys. Res., 112, G01022, doi:10.1029/2006jg000218, 2007.
Cirmo, C. P. and McDonnell, J. J.: Linking the hydrologic and bio-geochemical controls of nitrogen transport in near-stream zones of temperate-forested catchments: a review, J. Hydrol., 199, 88– 120, 1997.
Cole, J., Prairie, Y., Caraco, N., McDowell, W., Tranvik, L., Striegl, R., Duarte, C., Kortelainen, P., Downing, J., Middelburg, J., and Melack, J.: Plumbing the global carbon cycle: Integrating inland waters into the terrestrial carbon budget, Ecosystems, 10, 172– 185, doi:10.1007/s10021-006-9013-8, 2007.
Conrad, O.: SAGA – Entwurf, Funktionsumfang und Anwen-dung eines Systems f¨ur Automatisierte Geowissenschaftliche Analysen, Ph.D., Physical Geography, University of G¨ottingen, G¨ottingen, 221 pp., 2007.
Dawson, J. J. C., Billett, M. F., Hope, D., Palmer, S. M., and Dea-con, C. M.: Sources and sinks of aquatic carbon in a peatland stream continuum, Biogeochemistry, 70, 71–92, 2004.
Dosskey, M. G. and Bertsch, P. M.: Forest sources and pathways of organic matter transport to a blackwater stream: A hydrologic approach, Biogeochemistry, 24, 1–19, 1994.
Dunne, T. and Black, R. D.: Partial area contributions to storm runoff in a small New England watershed, Water Resour. Res., 6, 1296–1311, 1970.
Erlandsson, M., Buffam, I., Folster, J., Laudon, H., Temnerud, J., Weyhenmeyer, G. A., and Bishop, K.: Thirty-five years of syn-chrony in the organic matter concentrations of Swedish rivers ex-plained by variation in flow and sulphate, Global Change Biol., 14, 1191–1198, doi:10.1111/j.1365-2486.2008.01551.x, 2008. Esseen, P.-A., Ehnstr¨om, B., Ericson, L., and Sj¨oberg, K.: Boreal
Ecosystems and Landscapes: Structures, Processes and Conser-vation of Biodiversity, Ecol. Bull., 46, 16–47, 1997.
Fiebig, D. M., Lock, M. A., and Neal, C.: Soil water in the riparian zone as a source of carbon for a headwater stream, J. Hydrol., 116, 217–237, doi:10.1016/0022-1694(90)90124-G, 1990. Freeman, C., Evans, C. D., Monteith, D. T., Reynolds, B., and
Fen-ner, N.: Export of organic carbon from peat soils, Nature, 412, 785–785, 2001.
Freeman, C., Fenner, N., Ostle, N. J., Kang, H., Dowrick, D. J., Reynolds, B., Lock, M. A., Sleep, D., Hughes, S., and Hudson, J.: Export of dissolved organic carbon from peatlands under ele-vated carbon dioxide levels, Nature, 430, 195–198, 2004. Giesler, R., H¨ogberg, M., and H¨ogberg, P.: Soil chemistry and plants
in Fennoscandian boreal forest as exemplified by a local gradient, Ecology, 79, 119–137, 1998.
Grabs, T., Seibert, J., Bishop, K., and Laudon, H.: Modeling spa-tial patterns of saturated areas: A comparison of the topographic wetness index and a dynamic distributed model, J. Hydrol., 373, 15–23, doi:10.1016/j.jhydrol.2009.03.031, 2009.
Grabs, T. J., Jencso, K. G., McGlynn, B. L., and Seibert, J.: Calculating terrain indices along streams – a new method for separating stream sides Water Resour. Res., 46, W12536, doi:10.1029/2010WR009296, 2010.
Haei, M., ¨Oquist, M. G., Buffam, I., ˚Agren, A., Blomkvist, P., Bishop, K., Ottosson L¨ofvenius, M., and Laudon, H.: Cold winter soils enhance dissolved organic carbon concentrations in soil and stream water, Geophys. Res. Lett., 37, L08501, doi:10.1029/2010gl042821, 2010.
Hill, A.: Ground water flow paths in relation to nitrogen chemistry in the near-stream zone, Hydrobiologia, 206, 39–52, 1990. Hinton, M. J., Schiff, S. L., and English, M. C.: Sources and
flow-paths of dissolved organic carbon during storms in two forested watersheds of the Precambrian Shield, Biogeochemistry, 41, 175–197, doi:10.1023/A:1005903428956, 1998.
Hooper, R. P., Aulenbach, B. T., Burns, D. A., McDonnell, J., Freer, J., Kendall, C., and Beven, K.: Riparian control of stream-water chemistry: implications for hydrochemical basin mod-els, in: International Association of Hydrological Sciences, Pub-lication, 248, Proceedings of the HeadWater’98 Converence, Mean/Merano, Italy, 451–458, 1998.
Hope, D., Billett, M. F., and Cresser, M. S.: A review of the export of carbon in river water: Fluxes and processes, Environ. Pollut., 84, 301–324, doi:10.1016/0269-7491(94)90142-2, 1994.
Hruˇska, J., K¨ohler, S., Laudon, H., and Bishop, K.: Is a uni-versal model of organic acidity possible: Comparison of the acid/base properties of dissolved organic carbon in the boreal and temperate zones, Environ. Sci. Technol., 37, 1726–1730, doi:10.1021/es0201552, 2003.
Jansson, R., Laudon, H., Johansson, E., and Augspurger, C.: The importance of groundwater discharge for plant species num-ber in riparian zones, Ecology, 88, 131–139, doi:10.1890/0012-9658(2007)88[131:TIOGDF]2.0.CO;2, 2007.
Jencso, K. G., McGlynn, B. L., Gooseff, M. N., Wondzell, S. M., Bencala, K. E., and Marshall, L. A.: Hydrologic connectivity be-tween landscapes and streams: Transferring reach-and plot-scale understanding to the catchment scale, Water Resour. Res., 45, W04428, doi:10.1029/2008wr007225, 2009.
Kalbitz, K., Solinger, S., Park, J. H., Michalzik, B., and Matzner, E.: Controls on the dynamics of dissolved organic matter in soils: a review, Soil Sci., 165, 277–304, 2000.
Kendall, K. A., Shanley, J. B., and McDonnell, J. J.: A hydromet-ric and geochemical approach to test the transmissivity feedback hypothesis during snowmelt, J. Hydrol., 219, 188–205, 1999. Kirchner, J. W.: A double paradox in catchment hydrology and
geo-chemistry, Hydrol. Process., 17, 871–874, 2003.
Klaminder, J., Bindler, R., Laudon, H., Bishop, K., Emteryd, O., and Renberg, I.: Flux rates of atmospheric lead pollution within soils of a small catchment in northern Sweden and their implications for future stream water quality, Environ. Sci. Technol., 40, 4639– 4645, doi:10.1021/es0520666, 2006.
K¨ohler, S., Buffam, I., Jonsson, A., and Bishop, K.: Photochemi-cal and microbial processing of stream and soil water dissolved organic matter in a boreal forested catchment in northern Swe-den, Aquatic Sciences-Research Across Boundaries, 64, 269– 281, doi:10.1007/s00027-002-8071-z, 2002.
K¨ohler, S., Buffam, I., Laudon, H., and Bishop, K.: Intra- and inter-annual variability of total organic carbon in two contrasting bo-real landscape elements, J. Geophys. Res.-Biogeo., 113, G03012, doi:10.1029/2007JG000629, 2008.
K¨ohler, S. J., Buffam, I., Seibert, J., Bishop, K. H., and Laudon, H.: Dynamics of stream water TOC concentrations in a boreal headwater catchment: Controlling factors and implications for climate scenarios, J. Hydrol., 373, 44–56, doi:10.1016/j.jhydrol.2009.04.012, 2009.
Laudon, H., K¨ohler, S., and Buffam, I.: Seasonal TOC export from seven boreal catchments in northern Sweden, Aquatic Sciences-Research Across Boundaries, 66, 223–230, 2004a.
Laudon, H., Seibert, J., K¨ohler, S., and Bishop, K.: Hydro-logical flow paths during snowmelt: congruence between hydrometric measurements and oxygen 18 in meltwater, soil water, and runoff, Water Resour. Res., 40, W03102, doi:10.1029/2003WR002455, 2004b.
Laudon, H., Berggren, M., ˚Agren, A., Buffam, I., Bishop, K., Grabs, T., Jansson, M., and K¨ohler, S.: Patterns and dynamics of dis-solved organic carbon (DOC) in boreal streams: The role of processes, connectivity, and scaling, Ecosystems, 14, 880–893, doi:10.1007/s10021-011-9452-8, 2011.
Lyon, S. W., Nathanson, M., Spans, A., Grabs, T., Laudon, H., Tem-nerud, J., Bishop, K. H., and Seibert, J.: Specific discharge vari-ability in a boreal landscape, Water Resour. Res., 48, W08506, doi:10.1029/2011wr011073, 2012.
McClain, M. E., Boyer, E. W., Dent, C. L., Gergel, S. E., Grimm, N. B., Groffman, P. M., Hart, S. C., Judson, W. H., Johnston, C. A., Mayorga, E., McDowell, W. H., and Pinay, G.: Biogeochem-ical hot spots and hot moments at the interface of terrestrial and aquatic ecosystems, Ecosystems, 6, 301–312, 2003.
McGlynn, B. L. and McDonnell, J. J.: Quantifying the relative con-tributions of riparian and hillslope zones to catchment runoff, Water Resour. Res., 39, 1310, doi:10.1029/2003wr002091, 2003. McGlynn, B. L. and Seibert, J.: Distributed assessment of contribut-ing area and riparian buffercontribut-ing along stream networks, Water Re-sour. Res., 39, 1082, doi:10.1029/2002WR001521, 2003. Monteith, D. T., Stoddard, J. L., Evans, C. D., de Wit, H. A., Forsius,
M., Hogasen, T., Wilander, A., Skjelkvale, B. L., Jeffries, D. S., Vuorenmaa, J., Keller, B., Kopacek, J., and Vesely, J.: Dissolved organic carbon trends resulting from changes in atmospheric de-position chemistry, Nature, 450, 537–540, 2007.
Nilsson, C., Grelsson, G., Dynesius, M., Johansson, M. E., and Sperens, U.: Small rivers behave like large rivers: Effects of post-glacial history on plant species richness along riverbanks, J. Bio-geogr., 18, 533–541, 1991.
Nyberg, L., St¨ahli, M., Mellander, P.-E., and Bishop, K. H.: Soil frost effects on soil water and runoff dynamics along a boreal forest transect: 1. Field investigations, Hydrol. Process., 15, 909– 926, doi:10.1002/hyp.256, 2001.
Ocampo, C. J., Sivapalan, M., and Oldham, C.: Hydrological con-nectivity of upland-riparian zones in agricultural catchments: Im-plications for runoff generation and nitrate transport, J. Hydrol., 331, 643–658, doi:10.1016/j.jhydrol.2006.06.010, 2006. ¨
Oquist, M. G., Wallin, M., Seibert, J., Bishop, K., and Laudon, H.: Dissolved inorganic carbon export across the soil/ stream inter-face and its fate in a boreal headwater stream, Environ. Sci. Tech-nol., 43, 7364–7369, doi:10.1021/es900416h, 2009.
Rodhe, A.: On the generation of stream runoff in till soils, Nord. Hydrol., 20, 1–8, 1989.
Rodhe, A. and Seibert, J.: Groundwater dynamics in a till hillslope: flow directions, gradients and delay, Hydrol. Process., 25, 1899– 1909, doi:10.1002/hyp.7946, 2011.
Seibert, J. and McGlynn, B. L.: A new triangular multiple flow direction algorithm for computing upslope areas from grid-ded digital elevation models, Water Resour. Res., 43, W04501, doi:10.1029/2006WR005128, 2007.
Seibert, J., Bishop, K., Rodhe, A., and McDonnell, J.: Groundwater dynamics along a hillslope: A test of the steady state hypothesis, Water Resour. Res., 39, 101029, doi:10.1029/2002WR001404, 2002.
Seibert, J., Grabs, T., K¨ohler, S., Laudon, H., Winterdahl, M., and Bishop, K.: Linking soil- and stream-water chemistry based on a Riparian Flow-Concentration Integration Model, Hydrol. Earth Syst. Sci., 13, 2287–2297, doi:10.5194/hess-13-2287-2009, 2009.
Serrano, I., Buffam, I., Palm, D., Br¨ann¨as, E., and Laudon, H.: Thresholds for survival of brown trout during the spring flood acid pulse in streams high in dissolved organic carbon, T. Am. Fish. Soc., 137, 1363–1377, doi:10.1577/T07-069.1, 2008. Shafer, M. M., Overdier, J. T., Hurley, J. P., Armstrong, D., and
Webb, D.: The influence of dissolved organic carbon, suspended particulates, and hydrology on the concentration, partitioning and variability of trace metals in two contrasting Wisconsin wa-tersheds (USA), Chem. Geol., 136, 71–97, doi:10.1016/S0009-2541(96)00139-8, 1997.
Temnerud, J. and Bishop, K.: Spatial variation of streamwater chemistry in two Swedish boreal catchments: Implications for environmental assessment, Environ. Sci. Technol., 39, 1463– 1469, 2005.
Temnerud, J., Seibert, J., Jansson, M., and Bishop, K.: Spatial varia-tion in discharge and concentravaria-tions of organic carbon in a catch-ment network of boreal streams in northern Sweden, J. Hydrol., 342, 72–87, doi:10.1016/j.jhydrol.2007.05.015, 2007.
Venables, W. N. and Ripley, B. D.: Modern applied statistics with S, Fourth ed., Springer, New York, 2002.
Vidon, P. and Smith, A. P.: Upland controls on the hydrological functioning of riparian zones in glacial till valleys of the Mid-west, J. Am. Water Resour. As., 43, 1524–1539, 2007.
Wallin, M., Buffam, I., ¨Oquist, M., Laudon, H., and Bishop, K.: Temporal and spatial variability of dissolved inorganic carbon in a boreal stream network: Concentrations and downstream fluxes, J. Geophys. Res., 115, G02014, doi:10.1029/2009jg001100, 2010.
Winterdahl, M., Futter, M., K¨ohler, S., Laudon, H., Seibert, J., and Bishop, K.: Riparian soil temperature modification of the re-lationship between flow and dissolved organic carbon concen-tration in a boreal stream, Water Resour. Res., 47, W08532, doi:10.1029/2010WR010235, 2011a.
Winterdahl, M., Temnerud, J., Futter, M., L¨ofgren, S., Moldan, F., and Bishop, K.: Riparian zone influence on stream water dis-solved organic carbon concentrations at the Swedish Integrated Monitoring sites, AMBIO: A Journal of the Human Environ-ment, 40, 920–930, doi:10.1007/s13280-011-0199-4, 2011b. Zackrisson, O.: Influence of forest fires on the north Swedish boreal
forest, Oikos, 29, 22–32, 1977.


![Non linear recursive grammar for Sign languages (Grammaire récursive non linéaire pour les langues des signes) [in French]](data:image/gif;base64,R0lGODlhAQABAIAAAP///wAAACH5BAEAAAAALAAAAAABAAEAAAICRAEAOw==)