www.biogeosciences.net/6/1603/2009/
© Author(s) 2009. This work is distributed under the Creative Commons Attribution 3.0 License.
Biogeosciences
Impact of atmospheric and terrestrial CO
2
feedbacks on
fertilization-induced marine carbon uptake
A. Oschlies
IFM-GEOMAR, Leibniz-Institut f¨ur Meereswissenschaften, Kiel, D¨usternbrooker Weg 20, 24105 Kiel, Germany Received: 2 April 2009 – Published in Biogeosciences Discuss.: 23 April 2009
Revised: 19 July 2009 – Accepted: 27 July 2009 – Published: 11 August 2009
Abstract. The sensitivity of oceanic CO2 uptake to
alter-ations in the marine biological carbon pump, such as brought about by natural or purposeful ocean fertilization, has repeat-edly been investigated by studies employing numerical bio-geochemical ocean models. It is shown here that the results of such ocean-centered studies are very sensitive to the as-sumption made about the response of the carbon reservoirs on the atmospheric side of the sea surface. Assumptions made include prescribed atmosphericpCO2, an interactive
atmospheric CO2 pool exchanging carbon with the ocean
but not with the terrestrial biosphere, and an interactive at-mosphere that exchanges carbon with both oceanic and ter-restrial carbon pools. The impact of these assumptions on simulated annual to millennial oceanic carbon uptake is in-vestigated for a hypothetical increase in the C:N ratio of the biological pump and for an idealized enhancement of phyto-plankton growth. Compared to simulations with interactive atmosphere, using prescribed atmospheric pCO2
overesti-mates the sensitivity of the oceanic CO2uptake to changes in
the biological pump, by about 2%, 25%, 100%, and>500% on annual, decadal, centennial, and millennial timescales, re-spectively. The smaller efficiency of the oceanic carbon up-take under an interactive atmosphere is due to the back flux of CO2that occurs when atmospheric CO2is reduced. Adding
an interactive terrestrial carbon pool to the atmosphere-ocean model system has a small effect on annual timescales, but increases the simulated fertilization-induced oceanic carbon uptake by about 4%, 50%, and 100% on decadal, centennial, and millennial timescales, respectively, forpCO2
sensitiv-ities of the terrestrial carbon storage in the middle range of the C4MIP models (Friedlingstein et al., 2006). For such sen-sitivities, a substantial fraction of oceanic carbon uptake in-duced by natural or purposeful ocean fertilization originates, on timescales longer than decades, not from the atmosphere but from the terrestrial biosphere.
Correspondence to: A. Oschlies
(aoschlies@ifm-geomar.de)
1 Introduction
The oceanic control on atmospheric CO2 is the result of
a complex interplay of physical, chemical, and biologi-cal processes. It primarily arises from the temperature-dependent solubility of CO2(solubility pump) and the
pho-tosynthetic conversion of dissolved inorganic carbon into carbon-containing organic particles that may sink away from immediate contact with the atmosphere (biological pump) (Volk and Hoffert, 1985). While the ongoing global warming is often assumed to affect mainly the solubility pump with relatively minor impacts on the biological pump (Sarmiento and Le Qu´er´e, 1996), there is more and more evidence for possibly significant disturbances of the marine biological pump: Increasing levels of sea-water CO2 are expected to
impact on the marine biology, e.g., by making it harder to form calcium carbonate shells (Riebesell et al., 2000) or by affecting the ratio of the biotic carbon-to-nutrient drawdown (Riebesell et al., 2007). At the same time, the surface ocean is fertilized by a rapidly increasing atmospheric input of ni-trogen to the oceans due to emissions from the combustion of fossil fuels as well as from the production and use of fer-tilizers (Duce et al., 2008). Purposeful ocean fertilization, in particular using iron, is also discussed as a possible way to re-duce the acceleration of atmospheric CO2concentrations in
response to anthropogenic emissions (Lampitt et al., 2008). A number of modeling studies have addressed the poten-tial impact of such disturbances of the biological pump on the oceanic carbon uptake. For example, Schneider et al. (2004) investigated the impact of CO2-dependent C:N ratios of
par-ticulate organic matter formation and export. They found that by increasing the molar C:N ratio from 7.1 in year 1770 to 8.1 in year 2000 and thereafter, the oceanic carbon up-take increased by 70 PgC by year 2100 compared to a sim-ulation with a constant C:N ratio of 7.1. A recent study by Oschlies et al. (2008) assumed a somewhat larger CO2
first sight, there seems to be significant (∼factor 2) ambiguity in the simulated impact of very similar changes in the marine biology on the oceanic carbon uptake.
Similarly different results have been reported for model studies investigating the impact of atmospheric dust sup-ply and the associated fertilization with the micronutrient iron: Forcing a model with different dust scenarios includ-ing switches from interglacial to glacial conditions, Moore et al. (2006) reported that, on decadal timescales, 45% to 60% of a dust-related increase in carbon export by the marine bio-logical pump was exporting carbon removed from the atmo-spheric CO2 pool via air-sea exchange. On switching from
present-day to last-glacial maximum dust fields, Bopp et al. (2003), on the other hand, found that merely 25% of the ad-ditional carbon exported by the biological pump was derived from the atmosphere on decadal timescales.
The third example refers to simulated purposeful iron fer-tilization: For simulated localized iron fertilization in the tropical Pacific, Gnanadesikan et al. (2003) found that only about 10% of the initial pulse of carbon exported out of the surface layer were actually removed from the atmosphere on a 10- to 100-year timescale. A similar study by Jin et al. (2008) reported, on the contrary, that more than 75% of the carbon exported in response to localized iron fertilization in the equatorial Pacific came from the atmosphere, though this percentage was reduced to 34% when the entire Pacific was fertilized.
In all above examples, the simulated ratio of changes in air-sea CO2 flux to changes in biotic carbon export, which
has been referred to as atmospheric uptake efficiency (Jin et al., 2008), differs by a factor of about 2 or more among dif-ferent published model results. This difference is larger than the 19% scatter in simulated anthropogenic carbon uptake for a range of different circulation models participating in the Ocean Carbon Model Intercomparison Project (OCMIP) (Orr et al., 2001). However, while the OCMIP simulations followed a common protocol for the treatment of the biolog-ical pump and air-sea gas exchange, this was not the case for the above-mentioned studies looking at sensitivities of air-sea CO2flux to changes in the biological pump.
Jin et al. (2008) showed that part of the discrepancy among the different studies could be attributed to the different depth distribution of fertilization within the euphotic zone. The closer to the sea surface the biology is altered, the higher is the likelihood that changes in export production are felt by the atmosphere. This is of particular relevance in tropi-cal regions with shallow mixed layers and deep chlorophyll maxima where biotically induced air-sea CO2flux shows
lit-tle correlation with local export production (Oschlies and K¨ahler, 2004). The Jin et al. (2008) argument applies specif-ically to differences between early models simulating iron fertilization by restoring euphotic zone nutrient levels to zero and more detailed marine ecosystem models that resolve bi-ological processes within the euphotic zone. It is probably of less relevance to explain differences between the relatively
similar ecosystem models used by Bopp et al. (2003) and Moore et al. (2006) or the varying C:N ratios employed by Schneider et al. (2004) and Oschlies et al. (2008).
Here a different hypothesis will be investigated, namely that differences in the treatment of the atmospheric boundary condition can explain part of the differences among the dif-ferent model studies. It appears that all those simulations that revealed high ratios of anomalous air-sea CO2 fluxes
to anomalous biotic carbon-export fluxes used prescribed atmospheric CO2 levels (Schneider et al., 2004; Moore et
al., 2006; Jin et al., 2008). On the other hand, all simu-lations that allowed atmospheric CO2 levels to vary in
re-sponse to air-sea CO2fluxes, yielded lower ratios of
anoma-lous air-sea CO2fluxes to anomalous oceanic carbon-export
fluxes (Bopp et al., 2003; Gnanadesikan et al., 2003; Os-chlies et al., 2008). Earlier studies have already acknowl-edged a systematic overestimation of the impact of changes in the biological pump on oceanic carbon uptake by simula-tions using fixed atmosphericpCO2 (e.g., Schneider et al.,
2004; Jin et al., 2008; Oschlies et al., 2008). A, to the au-thor’s knowledge, first quantitative estimate of this overes-timate was given by Jin et al. (2008) who referred to a pa-per in preparation by Sarmiento et al. (2009), according to which simulations with interactive atmospheric carbon pool resulted in a 20% reduction in fertilization-induced oceanic CO2 uptake over 10 years (and 50% over 100 years)
com-pared to simulations with fixed atmosphericpCO2. The
cur-rent study was performed independently and will investigate not only the feedback arising from an interactive atmosphere, but also the feedbacks arising from the exchange of carbon between the atmosphere and the terrestrial biosphere on an-nual to millennial timescales. As long as the timescales con-sidered do not exceed many thousands of years, weathering feedbacks can be neglected and will not be considered in this paper. A main result is that both atmospheric and terrestrial CO2 feedbacks can lead to significant modifications in the
response of the marine carbon uptake to disturbances in the biological pump.
The paper is organized as follows: after introducing the model experiments in the following section, Sect. 3 will examine the atmospheric and terrestrial feedbacks for the example ofpCO2-sensitive C:N ratios. The relevance of
dif-ferent time and space scales considered in the perturbation of the biological pump will be investigated for idealized ex-periments with enhanced phytoplankton maximum growth rates in Sect. 4. A concluding section ends the paper.
2 Model
at the seafloor. It is coupled to a single-level energy-moisture balance model of the atmosphere and a dynamic-thermodynamic sea ice component. The configuration used here is essentially as described by Schmittner et al. (2008), except for the molar C:N ratio of 6.6 and the molar O2:N
ra-tio of 10.6. It includes a simple marine ecosystem model and an active terrestrial vegetation and carbon cycle com-ponent, which is based on the Hadley Centre’s TRIFFID model (Cox et al., 2000). The trace nutrient iron is not explicitly included. By tuning the biological parameters (in particular the relatively low phytoplankton maximum growth rate of 0.13 day−1 at 0◦C), the model nevertheless achieves a reasonable fit to observed marine biogeochemi-cal tracer distributions (Schmittner et al., 2005, 2008). All model components use a common horizontal resolution of 1.8◦latitude×3.6◦longitude.
2.1 Model experiments
Two different scenarios of disturbances of the marine biolog-ical pump are discussed in the following sections: the impact ofpCO2-sensitive C:N ratios simulated by prescribing C:N
ratios that increase with time (Sect. 3), and the impact of enhanced phytoplankton maximum growth rates, which may be viewed as a highly idealized ocean fertilization scenario (Sect. 4). The latter scenario uses a constant molar C:N ratio of 6.6 and assumes a large perturbation by increasing phy-toplankton maximum growth rates from 0.13 day−1 in the control experiment to 10.0 day−1 (at 0◦C) in the perturba-tion experiments beginning at time zero. These experiments do not attempt to simulate a realistic phytoplankton behavior, but were set up to resemble earlier model simulations and to deplete surface nutrient concentrations. As shown below, it turned out that even with these very high maximum growth rates, surface nutrients could not be fully depleted in the model. In different sensitivity experiments, elevated maxi-mum growth rates are applied either globally or limited to the tropical ocean between 18◦S and 18◦N or to the South-ern Ocean south of 30◦S, which both include large HNLC (high nutrient, low chlorophyll) areas.
All model runs start from the same model state that was obtained by spinning up the model for 7000 years under pre-industrial prescribed atmospheric pCO2 of 280µatm and
with a molar C:N ratio of 6.6. For each scenario, four dif-ferent model configurations were employed (Fig. 1), differ-ing only in the treatment of the atmospheric and terrestrial carbon pools and their interaction with each other:
- ATCO2const: atmosphericpCO2is fixed at 280µatm.
In consequence, annual mean climate and terrestrial car-bon stocks stay constant. This configuration essentially assumes an infinitely large atmospheric carbon pool such that CO2concentrations do not change in response
to CO2 exchange with the ocean. Total carbon is not
conserved.
COUPLED, CLIMconst ocean
ocean ocean
atmosphere
land atmosphere
pCO2
ATCO2const VEGconst
Fig. 1. Schematic design of the different model configurations
used (see text). Shown are active carbon pools of configurations ATCO2const, VEGconst, COUPLED, and CLIMconst. Atmo-sphericpCO2is prescribed in ATCO2const, which corresponds to assuming an infinitely large atmospheric carbon reservoir. CLIM-const assumes CLIM-constantpCO2in the atmospheric radiation budget and therefore simulates an essentially constant climate apart from possible CO2driven albedo changes.
- VEGconst: uses a finite atmospheric carbon reser-voir (initially 573 PgC, corresponding to 280µatm), which can exchange carbon with the ocean (initially 37 300 PgC) such that total carbon is conserved. No ex-change is allowed with the terrestrial carbon pool. - COUPLED: uses the same initial carbon reservoir sizes
as experiment VEGconst, but allows the atmosphere to exchange carbon with both the ocean and the terrestrial carbon pool (initially 1350 PgC in soils and 600 PgC in vegetation), such that total carbon is conserved. - CLIMconst: uses the same initial carbon reservoir
sizes as experiment COUPLED and allows both ocean and terrestrial vegetation to exchange carbon with the atmosphere, but assumes constant atmospheric pCO2=280µatm in the atmosphere’s radiation budget.
Note that this ensures only an approximately constant climate, which can still change in response to CO2
-induced terrestrial albedo changes. See text below.
3 Impact of pCO2-sensitive C:N ratios
This section investigates the oceanic carbon uptake that may result from a possible increase in the ratio of carbon to ni-trogen drawdown in response to increasing CO2levels in the
atmosphere and in the ocean surface waters. There is some evidence from mesocosm experiments for such an increase in C:N drawdown withpCO2(Engel et al., 2004; Riebesell et
al., 2007), and model studies have investigated the hypotheti-cal impacts of apCO2-sensitive stoichiometry on the oceanic
[image:3.595.319.535.62.178.2]Interpolating the mesocosm-derivedpCO2dependence of
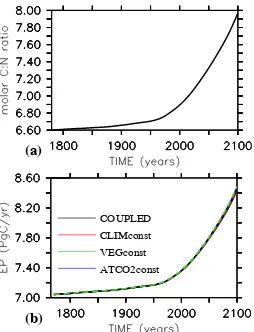
the of C:N drawdown by the biological pump (Riebesell et al., 2007), the temporal evolution of the model’s C:N ra-tio is assumed to follow observed and predicted atmospheric pCO2. Here, historical data are used for the period 1765
until 1990, and the IS92 scenario (Houghton et al., 1997) is used for the period 1990 until 2100, by which the model’s C:N ratio reaches 7.98 (Fig. 2a). With respect to the as-sumed pre-industrial C:N ratio of 6.6, this corresponds to an increase in molar C:N ratios by about 21%. The setup is sim-ilar to that used by Oschlies et al. (2008), except for the use of prescribed anthropogenic CO2emissions in that study, with
C:N ratios diagnosed from the model’s actual atmospheric CO2. The current study, in contrast, does not explicitly
in-clude CO2emissions and “only” prescribes the evolution of
C:N ratios, which is identical over all model runs irrespective of the modeled atmospheric CO2levels.
All four model configurations introduced in the previous section were started from the same spun up state in year 1765 and integrated until year 2100. The increase in simulated bi-otic carbon export in response to the increasing C:N ratios from about 7 PgC/yr in year 1765 to more than 8.4 PgC/yr in model year 2100 is very similar among all model runs (Fig. 2b, Table 1). Below, it will be shown that despite this close agreement in simulated export production, oceanic CO2 uptake differs considerably among the different model
runs.
3.1 Feedbacks from the atmospheric carbon pool
Most model studies investigating changes in the marine bio-logical pump have, so far, neglected possible feedbacks from the terrestrial carbon pool. It is therefore appropriate to first investigate the results of the two experiments ATCO2const and VEGconst, which both keep the carbon content of the terrestrial vegetation and soils constant. Simulated atmo-spheric CO2, by definition, stays constant at 280µatm in
ex-periment ATCO2const and drops by 9.7µatm by year 2100 in run VEGconst on introducing the temporally increasing C:N ratios (Fig. 3a). The increase in the oceanic carbon inventory associated with the enhanced export of organic carbon is twice as large in run ATCO2const compared to VEGconst (Fig. 3b: 41.0 PgC and 20.7 PgC, respectively, see also Table 1). The carbon taken up by the ocean from the atmosphere in experiment VEGconst lowers atmospheric pCO2. This reduces the air-sea CO2partial pressure
differ-ence and therefore leads to a back flux of CO2from the
sur-face ocean to the atmosphere. No such back flux occurs in run ATCO2const.
The comparison of VEGconst and ATCO2const reveals that, for the simulated case of globally uniform changes in C:N ratios, the back flux included in model VEGconst com-pensates about 50% of the original air-sea carbon flux in-duced by the perturbation of the biological pump in run ATCO2const. In year 2100 the simulated air-sea CO2 flux
(a)
ATCO2const VEGconst CLIMconst COUPLED
(b)
Fig. 2. (a) Time series of prescribed molar C:N ratio used in all
[image:4.595.364.491.61.227.2]experiments with varying C:N ratio. (b) Simulated export of organic carbon atz=126 m (in PgC/yr). The simulated export production is almost identical among the different model configurations.
Table 1. Simulated carbon inventories and flux changes.
Property ATCO2const VEGconst COUPLED CLIMconst
pCO2 280 270.3 273.8 274.3
1Catm 0a −20.7 −12.7 −11.4
1Cocn 41.0 20.7 26.9 28.8
1Cter 0 0 −14.1 −17.2
1SAT 0 −0.068 −0.031 −0.0015
1EP 1.40 1.45 1.44 1.40
1ASE 0.53 0.27 0.37 0.39
R
1ASE/
0.38 0.20 0.26 0.28
R
1EP
Experiments forpCO2-sensitive C:N ratios prescribed according to Fig. 2a. All numbers are model results for year 2100. Units are
µatm forpCO2and PgC for changes in atmospheric, marine and terrestrial carbon pools (1Catm,1Cocn and1Cter), and degrees Celcius for the change in globally averaged surface air temperature,
1SAT.1Cocnincludes dissolved inorganic carbon and particulate organic carbon, the latter of which amounts to about 0.4 PgC. Fluxes are in PgC yr−1for changes in export production (1EP) and air-sea CO2exchange (1ASE) with respect to the constant stoichiometry case. The last line is the ratio of time integrals of air-sea carbon flux and export production, respectively, from year 1765 to year 2100. aTotal carbon is not conserved in experiment ATCO2const.
[image:4.595.309.546.335.446.2]3.2 Feedbacks from the terrestrial carbon pool
Once the terrestrial vegetation is allowed to exchange car-bon with the atmosphere in experiment COUPLED, oceanic carbon uptake induced by enhanced C:N ratios exceeds the amount simulated by VEGconst by about 50% (Fig. 3b). The main reason for this increase is that modeled terrestrial pri-mary production is sensitive to atmospheric CO2 whereas
respiration is not. Primary production is reduced at lower atmospheric CO2levels (assuming otherwise unchanged
en-vironmental conditions), which leads to a net flux of carbon from the terrestrial carbon pool to the atmosphere. The UVic model has a sensitivity of land carbon storage to atmospheric pCO2of about 1.2 PgC/µatm estimated from climate change
simulations over essentially the same time interval as con-sidered here (Friedlingstein et al., 2006). In order to reduce atmosphericpCO2by 1µatm, the ocean now has to take up
not only 2.1 PgC of the atmosphere’s carbon equivalent of 1µatm, but also 1.2 PgC from the terrestrial biosphere. That is, the interactive carbon pool seen by the ocean on the atmo-spheric side of the sea surface has increased by almost 60% in run COUPLED compared to experiment VEGconst.
Compared to the VEGconst run, atmospheric pCO2
de-creases less (Fig. 3a), allowing more CO2 to invade the
ocean (Fig. 3b). The negative terrestrial vegetation feed-back on atmospheric CO2 levels is thus equivalent to a
po-sitive feedback on oceanic CO2uptake. Note, that this
feed-back depends on the CO2 fertilization effect on the
terres-trial biosphere. The CO2 sensitivity and its magnitude in
the terrestrial component of the UVic Earth System model are common among current coupled carbon-climate models (Friedlingstein et al., 2006). However, the degree of realism of the modeled magnitude of this feedback is under debate (e.g., Sokolov et al., 2008).
3.3 Feedbacks from climate change
The perturbation applied to the biological pump in the above experiments consists in a prescribed change in the C:N ra-tio. This perturbation differs from anthropogenic greenhouse gas perturbations as it immediately affects the biological pump. Changes in the marine carbon cycle then affect at-mospheric CO2and, in turn, cause some climate change in
experiments VEGconst and COUPLED. As a result of the variations in C:N ratios considered, atmospheric CO2
con-centrations decline by less than 10µatm and induce a global cooling of less than 0.07◦C (Fig. 3d) in runs VEGconst and
COUPLED, but not in CLIMconst. At the higher air temper-atures of CLIMconst, terrestrial respiration rates are higher and the terrestrial biosphere loses an additional 3 PgC by year 2100 compared to run COUPLED with its lower tem-peratures. Of this extra carbon released into the atmosphere, only about 1 PgC stay in the atmosphere, whereas the oceanic uptake is higher by 2 PgC in run CLIMconst compared to COUPLED as a result of higher atmospheric partial CO2
(d)
COUPLED CLIMconst
ATCO2const VEGconst
(a)
(c)
[image:5.595.312.544.60.205.2](b)
Fig. 3. Results of simulations with prescribed increase of C:N ratios
(Fig. 2a): Simulated evolution of (a) atmosphericpCO2(inµatm),
(b) oceanic carbon inventory referenced to initial state (in PgC), (c)
terrestrial carbon (vegetation plus soils, in PgC), (d) global-mean surface air temperature (in◦C).
ATCO2const COUPLED CLIMconst VEGconst
(a)
(b)
Fig. 4. Results of experiment with prescribed increase of C:N ratios
(Fig. 2a): (a) Simulated air-sea gas exchange of CO2(in PgC/yr).
(b) Ratio of cumulative air-sea carbon flux to simulated export of
organic carbon acrossz=126 m.
pressure (Table 1). Given an oceanic uptake of 28.8 PgC sim-ulated by run CLIMconst, the feedback from fertilization-induced climate change reduces the oceanic carbon uptake by about 7%. This is small compared to the differences be-tween the oceanic carbon uptake simulated by experiments ATCO2const and COUPLED or VEGconst and COUPLED. The sensitivity of the biological-pump driven oceanic carbon uptake to fertilization-induced climate change is small com-pared to the sensitivities to atmospheric and terrestrial carbon feedbacks.
3.4 Sensitivity to background CO2levels
All simulations above employed a pre-industrial atmospheric pCO2 background of 280µatm. Because of non-linear
[image:5.595.362.491.282.444.2]to fertilization will be different at different atmospheric CO2
levels. Unfortunately, it is more complicated to set up runs equivalent to VEGconst (and to some extent CLIMconst) with increasing background pCO2 than it is for constant pCO2. To keep climate and/or vegetation identical to a
con-trol run with increasing backgroundpCO2, one would have
to prescribe the evolution of climate and/or vegetation for the entire fertilization run.
To explore the sensitivity of the results reported above to backgroundpCO2typical for historical and expected future
CO2levels, two model runs corresponding to COUPLED and
ATCO2const were performed for prescribed increasing C:N ratios and increasing background atmospheric CO2levels
ac-counting for anthropogenic emissions. The COUPLED ex-periment, and a control experiment with constant C:N ra-tios, were forced by historical emissions until year 2000 and the SRES A2 emission scenario thereafter (Schmittner et al., 2008). The ATCO2const experiment was forced by the evo-lution of atmosphericpCO2taken from the control run.
The COUPLED experiment forced by CO2emissions
re-sulted in an atmospheric carbon inventory 27.5 PgC smaller than that of the control run by A.D. 2100, an additional oceanic carbon uptake of 30.8 PgC, and a terrestrial carbon loss of 3.4 PgC. That is, for the same increase in C:N ra-tios, the atmospheric CO2reduction is about twice as high
as in the simulation with pre-industrial background atmo-spheric pCO2 (12.7 PgC, Table 1), whereas the ocean
up-take is only 14% larger than the value under pre-industrial backgroundpCO2 (26.9 PgC). The larger sensitivity of
at-mosphericpCO2to changes in the C:N ratio (or ocean
fer-tilization) at higher atmosphericpCO2is caused by an
in-crease in the Revelle factor at higher CO2levels (Kurz and
Maier-Reimer, 1993). Additional nonlinearities come from the terrestrial biosphere’s response to changes in background CO2, temperature, and hydrological cycle. The cumulative
terrestrial response to the perturbation induced by increasing C:N ratios by year 2100 is smaller in the emission scenario (−3.4 PgC) than in the run with pre-industrial background CO2(−14.1 PgC).
For the experiment with prescribed increasingpCO2
(cor-responding to ATCO2const), the oceanic uptake amounts to 46.1 PgC by year 2100, which is 12% larger than the oceanic uptake of run ATCO2const under pre-industrial background CO2 (41.0 PgC, Table 1). That is, the relative differences
in simulated fertilization-induced oceanic carbon uptake be-tween experiments ATCO2const and COUPLED are similar in the emission scenario and the pre-industrialpCO2
sce-nario. Since the main focus of this paper is on relative rather than absolute differences among different model configura-tions, this gives some support for the robustness of our re-sults.
4 Impact of enhanced phytoplankton maximum growth rates
While the experiments of the previous section assumed a globally uniform increase in C:N ratios on the centennial timescale of the anthropocene, this section considers the ide-alized scenario of an instantaneous switch in phytoplankton growth rate in order to investigate the impact of atmospheric and terrestrial carbon feedbacks on different timescales and for different regional patterns of the perturbation. The as-sumed perturbation is a large increase in phytoplankton max-imum growth rates (see Sect. 2).
These experiments can be viewed as (yet another) indi-rect attempt to estimate the potential impact of large-scale iron fertilization on the global carbon cycle. The enhanced growth-rate approach taken here is intermediate between more idealized experiments that restore euphotic-zone nutri-ents to zero (e.g., Sarmiento and Orr, 1991; Gnanadesikan et al., 2003) and more detailed experiments with an explicit representation of iron (e.g., Aumont et al., 2006; Jin et al., 2008). In particular, surface nutrients are not fully depleted under enhanced maximum phytoplankton growth rates in the Southern Ocean, because of light limitation in winter, un-der sea ice and in areas of deep mixed layers. This is il-lustrated in Fig. 5 by the surface phosphate fields simulated for model run COUPLED after switching to the enhanced phytoplankton maximum growth rate. Apart from a sensi-tivity experiment discussed below, the maximum growth rate is enhanced at all depth levels, although light limitation sup-presses any significant impact below about 130 m. For the idealized global scenario, the four different configurations ATCO2const, VEGconst, CONSTclim, and COUPLED are integrated over a period of 1000 years, for the regional sce-narios the integration is limited to 100 years.
4.1 Temporal evolution
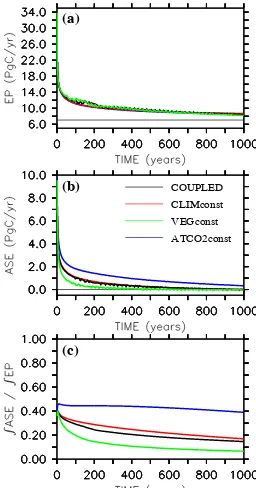
On switching to higher maximum growth rates, all model configurations show an initial peak in export production caused by a rapid consumption of surface nutrients left unuti-lized at the end of the model spin up. This peak in export production reaches 34 PgC/yr in the first year, i.e., about 27 PgC/yr above the normal level simulated by the control run with unchanged phytoplankton maximum growth rate. After 10 years, the excess export production is already re-duced to 9 PgC/yr, and it reaches 4 PgC/yr after 100 years and about 1.5 PgC/yr after 1000 years (Table 2, Fig. 6a). The enhanced maximum growth rates increase export pro-duction by more than 20% even after 1000 years of opera-tion. However, apart from experiment ATCO2const, oceanic carbon uptake has saturated during this time and residual air-sea carbon fluxes are less than 0.03 PgC/yr in year 1000 (Fig. 6b). Accordingly, the oceanic uptake efficiency, which is defined here as the cumulative CO2air-sea flux to the
(a) (b)
[image:7.595.141.454.61.238.2](c) (d)
Fig. 5. Surface phosphate concentrations simulated by (a) the control experiment, (b) the experiment with globally enhanced phytoplankton
[image:7.595.361.489.313.557.2]maximum growth rates, (c) the experiments with maximum phytoplankton growth rates enhanced south of 30◦S, and (d) with maximum phytoplankton growth rates enhanced in the tropical belt between 18◦S and 18◦N. All results are shown for model year 100, but look virtually identical already a few years after the onset of the perturbation. Units are mmol PO4m−3.
Table 2. Simulated changes in carbon fluxes for globally enhanced
phytoplankton maximum growth rate.
Property Time ATCO2const VEGconst COUPLED CLIMconst (yr)
1EP 1 26.8 26.8 26.8 26.8
(Pg C yr−1) 10 8.7 8.9 8.9 8.7
100 4.1 5.3 5.0 4.1
1000 1.64 1.15 1.35 1.54
1ASE 1 9.8 9.6 9.5 9.5
(Pg C yr−1) 10 4.0 2.6 3.0 3.1
100 1.8 0.40 0.96 1.1
1000 0.33 −0.029 −0.011 0.016
R
1ASE/ 1 0.37 0.36 0.35 0.35
R
1EP 10 0.47 0.37 0.39 0.39
100 0.44 0.20 0.29 0.32
1000 0.39 0.067 0.15 0.17
will eventually approach zero (Fig. 6c). The oceanic up-take efficiency is identical to the atmospheric upup-take effi-ciency defined by Jin et al. (2008). The change in termi-nology reflects the fact that in experiments with interactive terrestrial biosphere considered here (but not by Jin et al. (2008)), part of the carbon exchanged across the sea surface comes from the land. At the end of the 1000-year simula-tions with enhanced phytoplankton maximum growth rate, the ocean has taken up 190 PgC in run VEGconst, 460 PgC in run CLIMconst, 422 PgC in run COUPLED, and 1023 PgC in run ATCO2const (Table 3).
Qualitatively, the results of these millennial runs are very similar to those obtained in the previous section by varying the C:N ratio on centennial timescales: Experi-ment ATCO2const simulates the highest oceanic CO2
up-take and VEGconst simulates the smallest oceanic carbon
(a)
COUPLED CLIMconst VEGconst ATCO2const
(c) (b)
Fig. 6. Simulations with globally enhanced phytoplankton
max-imum growth rates: (a) Simulated export of organic carbon at
z=126 m (in PgC/yr). (b) Simulated air-sea gas exchange of CO2 (in PgC/yr). (c) Ratio of cumulative air-sea carbon flux to simu-lated export of organic carbon acrossz=126 m.
[image:7.595.50.286.349.490.2](a)
ATCO2const VEGconst CLIMconst COUPLED
(b)
[image:8.595.52.288.61.204.2](d) (c)
Fig. 7. Simulations with globally enhanced phytoplankton
maxi-mum growth rates: Simulated evolution of (a) atmosphericpCO2 (inµatm), (b) oceanic carbon inventory referenced to initial state (in PgC), (c) terrestrial carbon (vegetation plus soils, in PgC), (d) global-mean surface air temperature (in◦C).
Table 3. Simulated carbon inventory changes for globally enhanced
phytoplankton maximum growth rate.
Property Time ATCO2const VEGconst COUPLED CLIMconst (yr)
pCO2 1 280 276.8 277.0 277.0
(µatm) 10 280 260.0 264.5 265.6
100 280 218.1 240.5 247.1
1000 280 190.2 204.5 215.6
1Cocn 1 9.74 9.51 9.42 9.42
(Pg C) 10 53.9 43.3 45.0 45.2
100 269 131.0 186.3 193.3
1000 1023 190.3 422.4 460.1
1Cter 1 0 0 −0.30 −0.33
(Pg C) 10 0 0 −11.4 −13.9
100 0 0 −101.0 −121.4
1000 0 0 −262.8 −323.6
The change in oceanic carbon,1Cocnincludes dissolved inorganic carbon and organic particulate carbon (the model does not explicitly resolve dissolved organic carbon or particulate inorganic carbon). In year 1, increases in organic matter account for about 25% of
1Cocn.
324 PgC and 263 PgC, respectively). That is, after 1000 years most of the additional carbon taken up by the ocean comes from the land and not from the atmosphere!
The relatively small difference in terrestrial carbon loss between experiments CLIMconst and COUPLED is due to the lower surface temperatures in the COUPLED experiment (Fig. 7d), which reduce the respiratory losses of carbon from the terrestrial carbon pool. Interestingly, experiment CLIM-const shows a decline of surface air temperatures by about 0.2◦C within 1000 years although atmospheric CO2 is
as-sumed constant in the atmospheric radiation budget. This slight cooling is caused by changes in the albedo resulting from changes in terrestrial vegetation. In run CLIMconst,
the lower atmospheric CO2leads to a shift from boreal forest
with an albedo of 0.17 to tundra with an albedo of 0.22 over large parts of Asia and smaller parts of North America be-tween about 60◦N and 68◦N.
Similar to the results of the previous section, the efficiency of the enhanced export production to take up carbon from the atmosphere and store it in the ocean differs considerably among the different model configurations (Fig. 6c). In model year 1000, the oceanic uptake efficiency amounts to 0.39 in run ATCO2const and to only 0.065 in run VEGconst. The ra-tios diagnosed from experiments CLIMconst and COUPLED are 0.17 and 0.15, respectively.
4.2 Regional perturbations
Consistent with the findings of earlier studies (e.g., Gnanade-sikan et al., 2003; Aumont et al., 2006), enhancing phy-toplankton maximum growth rates in the tropics has only little impact on atmospheric CO2, with reductions in all
experiments being less than 8µatm over 100 years in all experiments (Fig. 8a, dashed lines). This is mirrored in the simulated export production that is, after an initial en-hancement during the first few years, only marginally (7%) larger than that simulated by the unperturbed control run (Fig. 8c). Oceanic carbon uptake amounts to some 20– 30 PgC after 100 years (Fig. 8b), with an air-sea CO2 flux
of about 0.1 PgC yr (Fig. 8d). In contrast, enhancing phy-toplankton growth in the Southern Ocean is much more ef-fective in the model, resulting in a much larger decline of atmospheric CO2 levels and a much larger increase in
ex-port production, air-sea CO2flux and oceanic carbon uptake
(Fig. 8, dotted lines). Typically, the impact of enhanced phy-toplankton maximum growth in the Southern Ocean amounts to about 80% of the impact obtained when phytoplankton growth increased globally.
The oceanic uptake efficiency is relatively insensitive to the chosen perturbation area. For the COUPLED experi-ment, the oceanic uptake efficiency after 100 years is 0.29 for the global perturbation, 0.31 for the tropical perturbation, and 0.32 for the Southern Ocean perturbation (Fig. 9). In a sensitivity experiment in which the phytoplankton maximum growth rate was increased only in the first grid level of the model (1z=50 m), the oceanic uptake efficiency increased to 0.36 for the tropical perturbation and to 0.33 for the South-ern Ocean perturbation. This increase is consistent with the findings of Jin et al. (2008) who showed that an enhancement of phytoplankton growth close to the sea surface resulted in a higher fraction of exported carbon being derived from the at-mosphere than for an enhancement of growth over the entire euphotic zone.
[image:8.595.49.286.326.469.2](d) VEGconst
CLIMconst COUPLED
dotted: S.Ocean ATCO2const
dashed: tropics solid: global
control
(b) (a)
[image:9.595.310.547.60.213.2](c)
Fig. 8. Simulations with enhanced phytoplankton growth rates
ap-plied globally (solid lines), to the tropical ocean between 18◦S and 18◦N (dashed lines), and to the Southern Ocean south of 30◦S (dot-ted lines). (a) Simula(dot-ted atmosphericpCO2(inµatm, left axis, and in PgC, right axis), (b) oceanic carbon uptake (in PgC), (c) export production (in PgC/yr), and (d) air-sea CO2exchange (in PgC/yr).
is prescribed at a fixed level, and is more than 30% higher when both atmospheric and terrestrial carbon feedbacks are accounted for in run COUPLED. Compared to these dif-ferences, the impact of the climate feedback is small and amounts to a few percent only.
5 Conclusions
This study was motivated by the considerable differences in published model-derived estimates of the impact of enhanced biological production on oceanic carbon uptake. Ocean-only studies that assumed a constant atmospheric pCO2 (e.g.,
Schneider et al., 2004; Moore et al., 2006; Jin et al., 2008) typically predicted an oceanic carbon uptake about twice as high as estimates from coupled ocean-atmosphere stud-ies that allowed atmospheric CO2to vary in response to
air-sea CO2fluxes (e.g., Bopp et al., 2003; Gnanadesikan et al.,
2003; Oschlies et al., 2008). While those investigators that assumed constant atmospheric CO2and generally obtained a
high oceanic uptake efficiency acknowledged that their esti-mates were likely overestiesti-mates because of the choice of the atmospheric boundary condition, the magnitude of this over-estimate has not yet been established. A first quantitative estimate is given in an as yet unpublished study of already referred to by Jin et al. (2008). In addition to the feedbacks originating from a finite atmospheric carbon reservoir, the current study also examined possible feedbacks from the ter-restrial carbon pool.
Prescribing atmosphericpCO2rather than using an
inter-active atmospheric carbon pool implicitly assumes an infi-nite size of the atmospheric carbon reservoir. Under this as-sumption that neglects the back flux of CO2form the ocean
to the atmosphere that occurs when atmospheric CO2is
re-VEGconst (a)
(c) (d)
(b) ATCO2const
CLIMconst
COUPLED
Fig. 9. Ratio of cumulative air-sea CO2 flux to cumulative ex-port production for experiments with enhanced phytoplankton max-imum growth rates applied (a) globally, (b) to the tropics between 18◦S and 18◦N, (c) to the Southern Ocean south of 30◦S, and (d) to the uppermost grid box in the tropics between 18◦S and 18◦N.
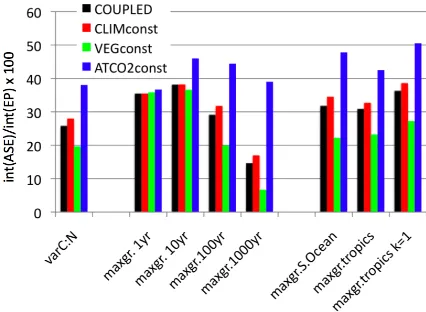
Fig. 10. Compilation of the oceanic uptake efficiency, i.e., the ratio
of cumulative air-sea CO2flux to cumulative export production for the different experiments. “varC:N” refers to the experiments with prescribed increase of C:N ratios (Sect. 3), “maxgr.” refers to the experiments with enhanced phytoplankton maximum growth rate (Sect. 4).
duced, the oceanic uptake efficiency turns out to be overesti-mated by about 25% on decadal timescales and about 100% on centennial timescales (Fig. 10). The addition of an in-teractive terrestrial carbon pool on the atmospheric side of the sea surface can, to some extent, buffer changes in atmo-sphericpCO2. The magnitude of this “buffering” effect
de-pends on the pCO2 sensitivity of the terrestrial biosphere,
which shows large differences among different models (e.g. Friedlingstein et al., 2006). There is evidence that elevated atmospheric CO2concentrations stimulate net accumulation
[image:9.595.50.286.62.206.2] [image:9.595.320.533.301.457.2]Table 4. Sensitivity of oceanic uptake efficiencies to atmospheric
and terrestrial carbon feedbacks.
Experiment ATCO2constVEGconst COUPLEDVEGconst CLIMconstCOUPLED
varC:N 1.94 1.32 1.09
maxgr.1 yr 1.02 0.99 1.00
maxgr.10 yr 1.26 1.04 1.00 maxgr.100 yr 2.23 1.46 1.09 maxgr.1000 yr 5.86 2.20 1.16 maxgr.S.Ocean 2.15 1.43 1.08 maxgr.tropics 1.83 1.33 1.06
Ratios of oceanic uptake efficiencies computed for ATMCO2const and COUPLED with respect to VEGconst, and of CLIMconst with respect to COUPLED. The experiments usepCO2-sensitive C:N ra-tios (varC:N) and enhanced phytoplankton maximum growth rates applied globally (maxgr.1 yr to maxgr.1000 yr), and over the South-ern Ocean (maxgr.S.Ocean) and over the tropics (maxgr.tropics). Values are given for year 2100 for experiment varC:N and for model year 100 for the other experiments unless indicated otherwise in the experiment name.
still unclear (e.g., Sokolov et al., 2008). The terrestrial com-ponent of the UVic model used here has a sensitivity of land carbon storage to atmosphericpCO2of about 1.2 PgC/µatm,
which is in the middle range of sensitivities of other com-monly used carbon cycle models (Friedlingstein et al., 2006). However, recent attempts to include the coupling of carbon and nitrogen cycles in the terrestrial biosphere have reported lower efficiencies of about 0.5 PgC/µatm (Thornton et al., 2007; Sokolov et al., 2008).
The terrestrial biosphere’spCO2sensitivity effectively
in-creases the actual atmospheric carbon pool of 2.1 PgC/µatm seen by the ocean on the atmospheric side of the sea surface by almost 60% according to the UVic model sensitivity. This figure would reduce to 25% for the recent terrestrial mod-els with coupled nitrogen and carbon cycles. For the current model, the oceanic carbon uptake in response to an enhance-ment of the biological pump increases by a few percent on decadal timescales, by about 50% on centennial timescales, and by more than 100% on millennial timescales compared to a simulation that neglects feedbacks from the terrestrial carbon pool (Table 4). This impact is much larger than the feedback effects from fertilization-induced climate change which, in the biological-pump perturbations modeled here, reduce the simulated oceanic CO2 uptake by a few percent
only.
The results of the idealized model experiments have re-vealed a considerable impact of atmospheric and terrestrial carbon feedbacks on estimated oceanic carbon uptake in re-sponse to changes in the biological carbon pump. On decadal to centennial timescales, model-derived estimates of oceanic carbon uptake can vary by up to a factor 2, depending on the treatment of the atmospheric and terrestrial carbon pools.
This can explain a substantial part of the difference reported by different previous studies. The results reported here are also relevant for attempts to assess the impacts of either natu-ral or purposeful ocean fertilization. Any local enhancement of the biological pump will generate remote carbon fluxes, making a quantitative assessment of the net impact on atmo-spheric CO2 difficult. Moreover, oceanic carbon uptake is
not identical to atmospheric CO2drawdown because of
ter-restrial carbon feedbacks.
Given our current understanding of global carbon feed-backs, the quantitative details of the idealized model exper-iments presented remain uncertain, although the sign of at-mospheric and terrestrial carbon feedbacks and their impacts on fertilization-induced marine carbon uptake are expected to be robust. The results indicate the difficulties and inhe-rent uncertainties we are still facing when trying to assess the impact of natural or purposeful ocean fertilization on at-mospheric CO2.
Acknowledgements. I thank Jorge Sarmiento for kindly providing
a copy of a manuscript in preparation, Michael Eby for support with the UVic model, and Birgit Schneider, Jorge Sarmiento and an anonymous reviewer for constructive and helpful reviews. This study was supported by the Deutsche Forschungsgemeinschaft.
Edited by: C. P. Slomp
References
Aumont, O. and Bopp, L.: Globalizing results from ocean in situ iron fertilization experiments, Global Biogeochem. Cy., 20, GB2017, doi:10.1029/2005GB002591, 2006.
Bopp, L., Kohfeld, K. E., Le Qu´er´e, C., and Aumont, O.: Dust im-pact on marine biota and atmospheric CO2during glacial peri-ods, Paleoceanography, 18, 1046, doi:10.1029/2002PA000810, 2003.
Caspersen, J. P., Pacala, S. W., Jenkins, J. C., Hurtt, G. C., Moor-croft, P. R., and Birdsey, R. A.: Contributions of land-use his-tory to carbon accumulation in U.S. forests, Science, 290(5494), 1148–1151, 2000.
Cox, P. M., Betts, R. A., Jones, C. D., Spall, S. A., and Totterdell, I. J.: Acceleration of global warming due to carbon-cycle feed-backs in a coupled climate model, Nature, 408, 184–187, 2000. Duce, R. A., LaRoche, J., Altieri, K., et al.: Impacts of atmospheric
anthropogenic nitrogen on the open ocean, Science, 320(5878), 893–897, 2008.
Engel, A., Delille, B., Jacquet, S., Riebesell, U., Rochelle-Newall, E., Terbr¨uggen, A., and Zondervan, I.: TEP and DOC production by Emiliania huxleyi exposed to different CO2concentrations: A mesocosm experiment, Aquat. Microb. Ecol., 34, 93–104, 2004. Friedlingstein, P., Cox, P., Betts, R., Bopp, L., von Bloh, W., et al.: Climate-carbon cycle feedback analysis: Results from the C4MIP model intercomparison, J. Climate, 19, 3337–3353, 2006.
Houghton, J. T., Meira Filho, L. G., Griggs, D. J., and Maskell, K.: Stabilization of atmospheric greenhouse gases: Physical, biological and socioeconomic implications, Intergovernmental Panel on Climate Change, World Meteorological Organization, Geneva, Technical Paper III, 1997.
Jin, X., Gruber, N., Frenzel, H., Doney, S. C., and McWilliams, J. C.: The impact on atmospheric CO2of iron fertilization induced changes in the ocean’s biological pump, Biogeosciences, 5, 385– 406, 2008,
http://www.biogeosciences.net/5/385/2008/.
Kurz, K. D. and Maier-Reimer, E.: Iron fertilization of the austral ocean – the Hamburg model assessment, Global Biogeochem. Cy., 7, 229–244, 1993.
Lampitt, R. S., Achterberg, E. P., Anderson, T. R., Hughes, J. A., Iglesias-Rodriguez, M. D., Kelly-Gerreyn, B. A., Lucas, M., Popova, E. E., Sanders, R., Shepherd, J. G., Smythe-Wright, D., and Yool, A.: Ocean fertilization: a potential means of geoengi-neering?, Philos. T. Roy. Soc. A., 366(1882), 3919–3945, 2008. Luo, Y., Hui, D., and Zhang, D.: Elevated CO2stimulates net
ac-cumulations of carbon and nitrogen in land ecosystems: a meta-analysis, Ecology, 87, 53–63, 2006.
Moore, J. K., Doney, S. C., Lindsay, K., Mahowald, N., and Michaels, A. F.: Nitrogen fixation amplifies the ocean biogeo-chemical response to decadal timescale variations in mineral dust deposition, Tellus B, 58, 560–572, 2006.
Orr, J. C., Maier-Reimer, E., Mikolajewicz, U., Monfray, P., Sarmiento, J. L., Toggweiler, J. R., Taylor, N. K., Palmer, J., Gruber, N., Sabine, C. L., Le Qu´er´e, C., Key, R. M., and Boutin, J.: Estimates of anthropogenic carbon uptake from four three-dimensional global ocean models, Global Biogeochem. Cy., 15, 43–60, 2001.
Oschlies, A. and K¨ahler, P.: Biotic contribution to air-sea fluxes of CO2and O2and its relation to new production, export produc-tion, and net community producproduc-tion, Global Biogeochem. Cy., 18, GB1015, doi:10.1029/2003GB002094, 2004.
Oschlies, A., Schulz, K. G., Riebesell, U., and Schmittner, A.: Simulated 21st century’s increase in oceanic suboxia by CO2 -enhanced biological carbon export, Global Biogeochem. Cy., 22, GB4008, doi:10.1029/2007GB003147, 2008.
Riebesell, U., Schulz, K., Bellerby, R. G. J., Fritsche, P., Mey-erh¨ofer, M., Neill, C., Nondal, G., Oschlies, A., Wohlers, J., and Z¨ollner, E.: Enhanced biological carbon consumption in a high CO2ocean, Nature, 450, 545–548, 2007.
Riebesell, U., Zondervan, I., Rost, B., Tortell, P. D., Zeebe, R. E., and Morel, F. M. M.: Reduced calcification of marine plankton in response to increased atmospheric CO2, Nature, 407, 364–367, 2000.
Sarmiento, J. L. and Le Qu´er´e, C.: Oceanic carbon dioxide uptake in a model of century-scale global warming, Science, 274, 1346– 1350, 1996.
Sarmiento, J. L. and Orr, J. C.: Three dimensional simulations of the impact of Southern Ocean nutrient depletion on atmospheric CO2and ocean chemistry, Limnol. Oceanogr., 36, 1928–1950, 1991.
Sarmiento, J. L., Slater, R., Dunne, J., and Gnanadesikan, A.: Small scale carbon mitigation by patch iron fertilization, in preparation, 2009.
Schmittner, A., Oschlies, A., Giraud, X., and Eby, M.: A global model of the marine ecosystem for multi-millennial simulations, Global Biogeochem. Cy., 19, GB3004, doi:10.1029/2004GB002283, 2005.
Schmittner, A., Oschlies, A., Matthews, H. D., and Galbraith, E. D.: Future changes in climate, ocean circulation, ecosystems and biogeochemical cycling simulated for a business-as-usual CO2 emission scenario until 4000 AD, Global Biogeochem. Cy., 22, GB1013, doi:10.1029/2007GB002953, 2008.
Schneider, B., Engel, A., and Schlitzer, R.: Effects of depth-and CO2-dependent C:N ratios of particulate organic matter (POM) on the marine carbon cycle, Global Biogeochem. Cy., 18, GB2015, doi:10.1029/2003GB002184, 2004.
Sokolov, A. P., Kicklighter, D. W., Melillo, J. M., Felzer, B. S., Schlosser, C. A., and Cronin, T. W.: Consequences of consid-ering carbon-nitrogen interactions on the feedbacks between cli-mate and the terrestrial carbon cycle, J. Clicli-mate, 21, 3776–3796, 2008.
Thornton, P. E., Lamarque, J.-F., Rosenbloom, N. A., and Mahowald, N. M.: Influence of carbon-nitrogen cycle cou-pling on land model response to CO2 fertilization and cli-mate variability, Global Biogeochem. Cy., 21, GB4018, doi:10.1029/2006GB002868, 2007.
Volk, T. and Hoffert, M. I.: Ocean carbon pumps – Analysis of rel-ative strengths and efficiencies in ocean-driven atmospheric CO2 changes, in: The Carbon Cycle and Atmospheric CO2: Natu-ral Variations, Archean to Present, edited by: Sundquist, E. and Broecker, W., AGU Geophysical Monograph, Washington DC, 32, 99–110, 1985.