www.impactjournals.com/oncotarget/ Oncotarget, 2017, Vol. 8, (No. 60), pp: 102291-102300
Diagnostic efficacy of long non-coding RNA MALAT-1 in human
cancers: a meta-analysis study
Yan Chen1, Zhenzhou Xiao1, Minhua Hu1, Xiaoli Luo1 and Zhaolei Cui1
1Laboratory of Biochemistry and Molecular Biology Research, Fujian Provincial Key Laboratory of Tumor Biotherapy, Department
of Clinical Laboratory, Fujian Cancer Hospital and Fujian Medical University Cancer Hospital, Fuzhou, Fujian, China
Correspondence to: Zhaolei Cui, email: [email protected] Keywords: MALAT-1, cancer, diagnosis, meta-analysis
Received: June 19, 2017 Accepted: August 26, 2017 Published: September 18, 2017
Copyright: Chen et al. This is an open-access article distributed under the terms of the Creative Commons Attribution License 3.0 (CC BY
3.0), which permits unrestricted use, distribution, and reproduction in any medium, provided the original author and source are credited.
ABSTRACT
Metastasis-associated lung adenocarcinoma transcript 1 (MALAT-1) is one kind of long non-coding RNAs (lncRNAs) that has been recognized as a hallmark of the onset and development of several carcinomas. This study seek to meta-analyze the overall diagnostic efficacy of elevated MALAT-1 expression profile for human cancers. Studies on the diagnostic performance of MALAT-1 in cancers were retrieved by searching the online databases. The combined effect sizes were summarized using a bivariate meta-analysis model. Impacts of publication bias on the pooled effect sizes were assessed using “Duval and Tweedie nonparametric trim and fill method”. Sensitivity analysis and meta-regression test were applied to deeply trace the heterogeneity sources among eligible studies. A total of 14 studies with 1342 cancer cases were included. The combined effect sizes showed that MALAT-1 expression profiling conferred an estimated sensitivity of 0.69 (95% CI: 0.62–0.75) (I2 = 84.01%, P < 0.001), specificity of 0.85 (95% CI: 0.79–0.90) (I2 = 87.95%, P < 0.001) and AUC (area under curve) of 0.83 in distinguishing cancer patients from noncancerous contrasts. Moreover, stratified analysis depending on cancer type manifested that elevated
MALAT-1 harbored a promising efficacy in the diagnosis of pulmonary tumors (AUC
= 0.90), digestive system tumors (AUC = 0.84), gynecologic cancers (AUC = 0.84) and nasopharyngeal carcinoma (AUC = 0.84), particularly in confirming the subtype of squamous carcinoma (AUC = 0.91) and non-small cell lung carcinoma (AUC = 0.88) in lung cancer. Other analyses based on test matrix and ethnicity also presented robust results. Collectively, elevated MALAT-1 could be developed as an auxiliary molecular marker to aid in cancer diagnosis.
INTRODUCTION
Cancer is now becoming a global burden that has increased massive economic and social pressures around the world. According to the global cancer statistics data in 2012, nearly 14.1 million new cancer cases and 8.2 million cancer deaths were reported worldwide [1]. Early detection and treatment remains the major effective approach to help the cancer patients obtain favorable clinical outcomes. The current bloody tumor biomarkers are far from enough to satisfy the diagnosis of cancer in clinic owing to a relative low diagnostic efficacy.
In human beings, the majority of the genome is transcribed, yet only 2% accounts for protein-coding
exons [2]. Long noncoding RNA (lncRNA) is an important population of the non-coding RNAs (ncRNAs) with a sequence longer than 200 nucleotides [3]. Evidence suggests that the lncRNAs can be classified as tumor suppressor genes or oncogenes according to their functions and expression pattern in tumoral tissues [4]. Metastasis-associated lung adenocarcinoma transcript 1 (MALAT-1) is one kind of nuclear lncRNAs that implicates in a spectrum of biological processes in vertebrate cells [5, 6].
MALAT-1 is overexpressed in multiple types of human
malignancies, such as the pulmonary cancers, digestive system tumors and genitourinary cancers, and so forth [7–20]. Notably, recent clinical studies have highlighted that MALAT-1 could be rated as a promising biomarker
to aid in cancer diagnosis and prognosis [7–22]. The clinical value of MALAT-1 in predicting metastasis and/or survival in cancers has been documented by some meta-analysis studies [21, 22]. To our knowledge, no evidence-based meta-analyses have been reported on the overall diagnostic performance of MALAT-1 for carcinomas. In order to elucidate the global diagnostic efficacy of
MALAT-1 in identification of cancers and provide valid
evidences, we conducted this meta-analysis according to standard statistical methods. Our data may help to better understand the clinical value of elevated MALAT-1 in the diagnosis of various cancers.
RESULTS
Study search and inclusion
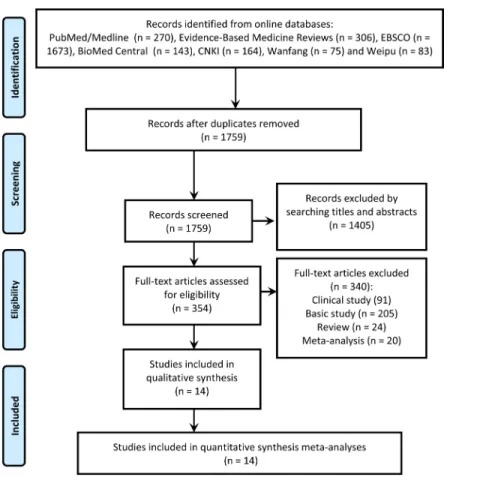
The search of relevant articles was undertaken following the procedures of the PRISMA diagram (Figure 1). Briefly, a total of 1759 records in line with the search strategy were initially included from the electronic databases following an elimination of duplicates. Then, titles and abstracts of the records received detailed evaluation and 1405 of them were eliminated due to the status that not fitting the topic of our study. The following 354 records underwent full-text identification, and 24 of them were identified as reviews, 205 were basic studies,
91 were clinical studies, 20 were meta-analyses, and thus were all discarded. At last, 14 studies [7–20] assessed the diagnostic utility of up-regulated MALAT-1 in cancer were included in the statistical analysis.
Study characteristics and quality
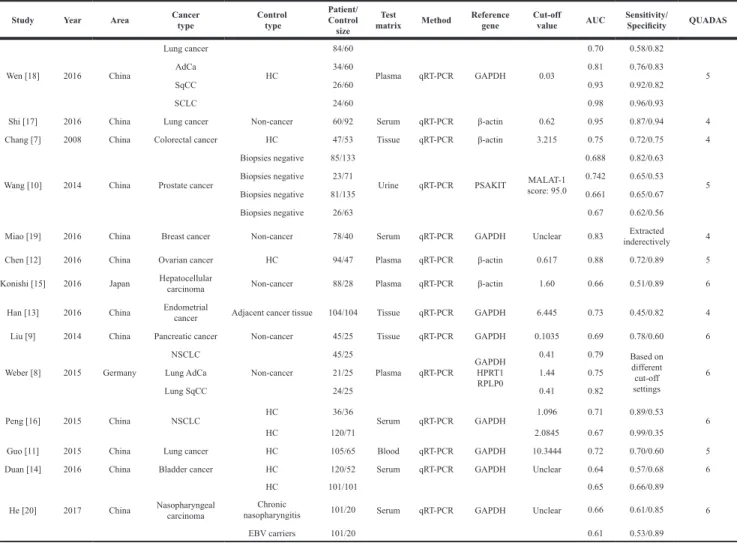
All essential data were collected from 14 studies, comprising a combined population of 1342 cancer patients and 1189 noncancerous controls. All cancer patients had a definite diagnosis based on histopathological examination. All samples were obtained by surgical operation or biopsy prior to other therapies, and the specimen sources were from plasma [8, 12, 15, 18], serum [14, 16, 17, 19, 20], urine [10] and tissue [7, 9, 13]. The included neoplasm types involved lung cancer [8, 16–18], colorectal cancer [7], prostate cancer [10], breast cancer [19], ovarian cancer [12], pancreatic cancer [9], hepatocellular carcinoma [15], bladder cancer [14] and nasopharyngeal carcinoma [20]. Among the 14 publications, 13 studies directly reported the estimated sensitivity and specificity, 1 study showed the original data of TP (true positive), FP (false positive), FN (false negative) and TN (true negative) [8], and 1 study provided indirect data [19]. The levels of MALAT-1 were determined based on the approach of quantitative real-time polymerase chain reaction (qRT-PCR), and that GAPDH [8, 9, 11, 13, 14, 16, 18–20], β-actin [7, 12, 15, 17],
HPRT190 [8], RPLP0 [8], or PSAKIT [10] were utilized
as the reference genes. The essential data of all included studies are summarized in Table 1.
Proportions of risks on bias and applicability by the QUADAS-2 checklist are shown in Figure 2, where all the eligible records showed low risks of bias. Correspondingly, the cumulative scores for the included studies are listed in Table 1, and each study revealed an evaluation score equal or larger than 4, revealing a relatively high quality of all included studies.
Diagnostic performance
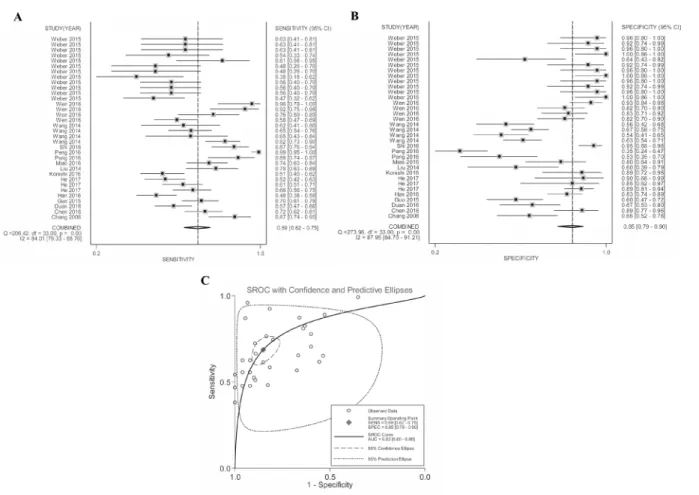
Quantitative analysis of the diagnostic performance manifested that elevated MALAT-1 expression harvested a combined sensitivity of 0.69 (95%CI: 0.62–0.75) and specificity of 0.85 (95%CI: 0.79–0.90) in discriminating cancers from noncancerous controls, corresponding to an AUC value of 0.83 (Figure 3). Moreover, the pooled DOR (diagnostic odds ratio), PLR (positive likelihood ratio) and NLR (negative likelihood ratio) were calculated as 12.56
Figure 2: Study quality assessed by the QUADAS-2 checklist.
(95% CI: 8.51–18.55), 4.62 (95% CI: 3.30–6.46) and 0.37 (95% CI: 0.31–0.44), respectively.
Study heterogeneity
Heterogeneity analysis by Chi2 and I2 tests showed obvious heterogeneity across the overall studies (Q = 264.95, P < 0.001, and I2 = 99.25%). Additionally, in the subgroup studies by type of carcinoma, test matrix and ethnicity, heterogeneity also appeared in the analyses of pulmonary tumor (I2 = 99.11%, P < 0.001), adenocarcinoma (AdCa) (I2 = 88.59%, P < 0.001), squamous carcinoma (SqCC) (I2 = 78.66%, P = 0.005), gynecologic cancer (I2 = 74.40%, P = 0.020) as well as in serum- (I2 = 80.20%, P < 0.001) and Asian-based (I2 = 75.90%, P < 0.001) analyses (Table 2). Correspondingly, the L’Abbe and Galbraith plots also showed obvious heterogeneity among studies (Supplementary Figure 1). Stratified analysis
Due to the existence of significant heterogeneity across the whole analyses, subgroups were analyzed
depending on cancer type, test matrix and ethnicity. As exemplified in Table 2, MALAT-1 testing achieved a high AUC value of 0.90 in the diagnosis of pulmonary tumor (overall), especially in confirming the subtypes of SqCC (AUC = 0.91) and non-small-cell lung cancer (NSCLC) (AUC = 0.88). Of note, the pooled specificities in pulmonary tumor, AdCa and SqCC were shown to be 0.92 (95% CI: 0.85–0.96), 0.91 (95% CI: 0.76–0.97) and 0.94 (95% CI: 0.85–0.98), respectively. Moreover, the diagnostic efficacy of MALAT-1 in other cancers, including digestive system tumor, gynecologic cancer and nasopharyngeal carcinoma also revealed robust results (Table 2). On the other hand, stratified analyses in terms of test matrix evidenced that plasma-based MALAT-1 testing presented an AUC of 0.88 better than that of serum- (AUC = 0.85), tissue- (AUC = 0.77) and urine-based (AUC = 0.65) analyses, indicating that plasma might be a suitable test matrix for the analysis of MALAT-1. Additionally, testing depending on ethnicity displayed that Asian- and Caucasian-based MALAT-1 analysis retained equal AUC values (0.82), whereas Caucasian-based analysis harbored a superior specificity of 0.93 (95% CI: 0.90–0.96) and DOR of 19.23 (95% CI: 10.92–33.88) (Table 2).
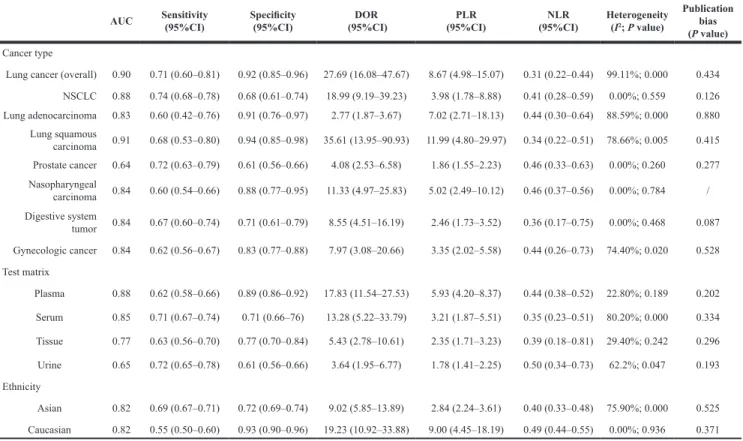
Table 1: Main features of the included studies
Study Year Area Cancer type Control type Patient/Controlsize Test
matrix Method Reference gene Cut-offvalue AUC Sensitivity/Specificity QUADAS
Wen [18] 2016 China Lung cancer HC 84/60 Plasma qRT-PCR GAPDH 0.03 0.70 0.58/0.82 5 AdCa 34/60 0.81 0.76/0.83 SqCC 26/60 0.93 0.92/0.82 SCLC 24/60 0.98 0.96/0.93
Shi [17] 2016 China Lung cancer Non-cancer 60/92 Serum qRT-PCR β-actin 0.62 0.95 0.87/0.94 4 Chang [7] 2008 China Colorectal cancer HC 47/53 Tissue qRT-PCR β-actin 3.215 0.75 0.72/0.75 4
Wang [10] 2014 China Prostate cancer
Biopsies negative 85/133
Urine qRT-PCR PSAKIT score: 95.0MALAT-1
0.688 0.82/0.63 5
Biopsies negative 23/71 0.742 0.65/0.53
Biopsies negative 81/135 0.661 0.65/0.67
Biopsies negative 26/63 0.67 0.62/0.56
Miao [19] 2016 China Breast cancer Non-cancer 78/40 Serum qRT-PCR GAPDH Unclear 0.83 inderectivelyExtracted 4 Chen [12] 2016 China Ovarian cancer HC 94/47 Plasma qRT-PCR β-actin 0.617 0.88 0.72/0.89 5 Konishi [15] 2016 Japan Hepatocellular carcinoma Non-cancer 88/28 Plasma qRT-PCR β-actin 1.60 0.66 0.51/0.89 6 Han [13] 2016 China Endometrial cancer Adjacent cancer tissue 104/104 Tissue qRT-PCR GAPDH 6.445 0.73 0.45/0.82 4 Liu [9] 2014 China Pancreatic cancer Non-cancer 45/25 Tissue qRT-PCR GAPDH 0.1035 0.69 0.78/0.60 6 Weber [8] 2015 Germany NSCLC Non-cancer 45/25 Plasma qRT-PCR GAPDHHPRT1 RPLP0 0.41 0.79 Based on different cut-off settings 6 Lung AdCa 21/25 1.44 0.75 Lung SqCC 24/25 0.41 0.82
Peng [16] 2015 China NSCLC HC 36/36 Serum qRT-PCR GAPDH 1.096 0.71 0.89/0.53 6
HC 120/71 2.0845 0.67 0.99/0.35
Guo [11] 2015 China Lung cancer HC 105/65 Blood qRT-PCR GAPDH 10.3444 0.72 0.70/0.60 5 Duan [14] 2016 China Bladder cancer HC 120/52 Serum qRT-PCR GAPDH Unclear 0.64 0.57/0.68 6
He [20] 2017 China Nasopharyngeal carcinoma
HC 101/101
Serum qRT-PCR GAPDH Unclear
0.65 0.66/0.89 6 Chronic
nasopharyngitis 101/20 0.66 0.61/0.85
EBV carriers 101/20 0.61 0.53/0.89
AdCa: adenocarcinoma; AUC: area under curve; GAPDH: Glyceraldehyde-3-phosphate dehydrogenase; HC: Healthy control; SqCC: squamous carcinoma; SCLC: small cell lung carcinoma; NSCLC: non-small cell lung carcinoma; QUADAS: quality assessment for studies of diagnostic accuracy.
Sensitivity analysis and meta-regression
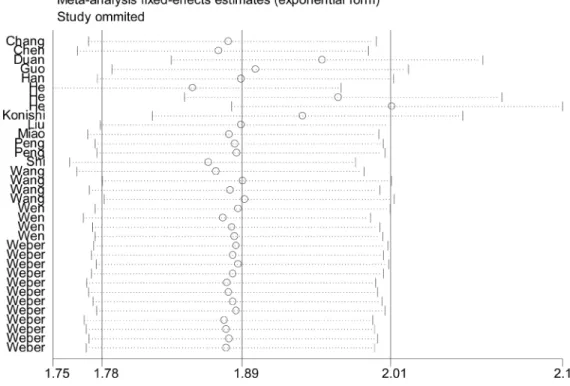
Sensitivity analyses of the overall pooled effect size showed that 1 individual study by He et al. [20] was estimated to be out of the effective line (Figure 4), and its removal resulted in a decrease of heterogeneity in sensitivity (I2 from 84.01% to 83.85%), but an increase of heterogeneity in specificity (I2 from 87.95% to 88.22%). Besides that, the pooled NLR dropped from 0.37 to 0.35, and DOR elevated form 12.56 to 12.71. Further univariate meta-regression test was undertaken depending on the covariates of cancer type, specimen source, sample size, reference gene and study quality [23]. As summarized in Table 3, the results showed that different specimen type (RDOR = 0.67, P = 0.0012) is more like to be a cause of study heterogeneity.
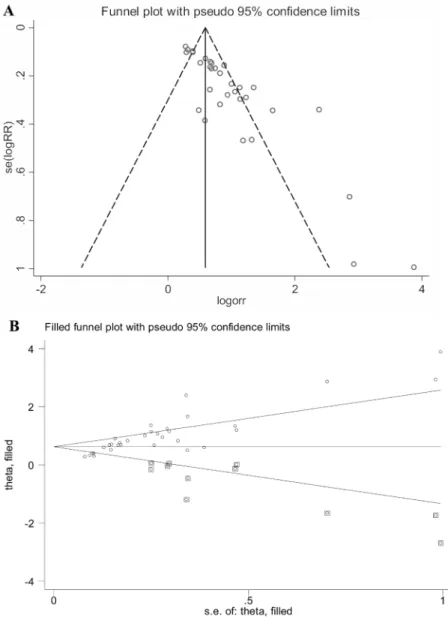
Publication bias
Publication bias was tested with Funnel plot and Deeks’ funnel plot asymmetry test. For the overall pooled effect size, both visual Funnel plot (Figure 5A) and quantitative Deeks’ funnel plot asymmetry test (Supplementary Figure 2, P < 0.05) displayed obvious publication bias among studies. In consequence, the “Duval and Tweedie nonparametric trim and fill method” was employed to elucidate the possible effects of bias on the pooled analysis [24]. As shown in Figure 5B, the imputed analyses generated a symmetrical funnel plot after filling the hypothetical 12 missing studies. Moreover, the linear trimming and filling estimator showed an estimate variance of 0.111 (P < 0.001) before adjustment versus
that of 0.166 (P < 0.001) after adjustment, suggesting that the pooled effect was slightly altered before and after adjustments. Evaluation of the publication bias in the subgroup studies was performed as well and no clear bias was detected among stratified analyses (Table 2).
DISCUSSION
MALAT-1 is a kind of non-protein-coding RNA
transcripts, and its elevated expression status has been demonstrated to be implicated in the occurrence and development of various carcinomas [5, 6]. The diagnostic feature of MALAT-1 in cancers has been documented by many single studies [7–20]. However, accuracies from single studies are often compromised due to limited sample size and single-center design. In the current study, we seek to conduct a systematic meta-analysis to elucidate the global diagnostic efficacy of MALAT-1 in human cancers.
Our data showed that MALAT-1 expression profiling sustained a pooled sensitivity of 0.69, specificity of 0.85 and AUC of 0.83 in discriminating cancer patients from noncancerous controls, revealing an overall high efficacy for the overall diagnostic test. Moreover, the pooled DOR of 12.56 also showed a powerful capability of
MALAT-1 testing in discriminating cancers from
cancer-free individuals [25]. The likelihood ratios involved PLR (positive likelihood ratio) and NLR (negative likelihood ratio) are often utilized for assessing the value of performing a diagnostic test [26]. In our study, the estimated PLR value of 4.62 means that the probability of cancer cases yield
MALAT-1 testing positive is nearly 5-fold higher towards
the cases do not have MALAT-1 testing positive; likewise, the NLR of 0.37 means that the probability of cancer cases retain MALAT-1 testing negative is only 0.37-fold towards the cases do not have MALAT-1 testing negative. All these data indicated that elevated MALAT-1 achieves a powerful efficacy to aid in the diagnosis of cancers.
In the present study, heterogeneity seems to be existed among the overall pooled analyses mainly due to the included different types of cancers. In consequence, we further conducted subgroup studies depending on the type of carcinoma, test matrix and ethnicity. Our results revealed that elevated MALAT-1 expression achieved a high AUC value of 0.90 in the diagnosis of pulmonary tumor as well as the subtypes of SqCC (AUC of 0.91)
and NSCLC (AUC of 0.88). Importantly, MALAT-1 testing showed promising specificities higher than 0.90 in confirming lung cancer (overall), as well as the AdCa and SqCC subtype. Analysis of the efficacy in other types manifested that MALAT-1 testing harvested an AUC of 0.84, specificity of 0.88 and DOR of 11.33 in identifying nasopharyngeal carcinoma, suggesting that MALAT-1 might be developed as a promising biomarker for nasopharyngeal carcinoma as well. Besides that, MALAT-1 showed equal AUC values of 0.84 in both of the digestive system and gynecologic tumors, but a higher combined specificity of 0.83 was observed in the latter.
The matrix differences of lncRNA signature in gastric cancer have been confirmed by our previous
Table 2: Stratified analyses of the diagnostic efficacy of MALAT-1 in cancers
AUC Sensitivity (95%CI) Specificity(95%CI) (95%CI)DOR (95%CI)PLR (95%CI)NLR Heterogeneity(I2; P value)
Publication bias (P value)
Cancer type
Lung cancer (overall) 0.90 0.71 (0.60–0.81) 0.92 (0.85–0.96) 27.69 (16.08–47.67) 8.67 (4.98–15.07) 0.31 (0.22–0.44) 99.11%; 0.000 0.434 NSCLC 0.88 0.74 (0.68–0.78) 0.68 (0.61–0.74) 18.99 (9.19–39.23) 3.98 (1.78–8.88) 0.41 (0.28–0.59) 0.00%; 0.559 0.126 Lung adenocarcinoma 0.83 0.60 (0.42–0.76) 0.91 (0.76–0.97) 2.77 (1.87–3.67) 7.02 (2.71–18.13) 0.44 (0.30–0.64) 88.59%; 0.000 0.880 Lung squamous carcinoma 0.91 0.68 (0.53–0.80) 0.94 (0.85–0.98) 35.61 (13.95–90.93) 11.99 (4.80–29.97) 0.34 (0.22–0.51) 78.66%; 0.005 0.415 Prostate cancer 0.64 0.72 (0.63–0.79) 0.61 (0.56–0.66) 4.08 (2.53–6.58) 1.86 (1.55–2.23) 0.46 (0.33–0.63) 0.00%; 0.260 0.277 Nasopharyngeal carcinoma 0.84 0.60 (0.54–0.66) 0.88 (0.77–0.95) 11.33 (4.97–25.83) 5.02 (2.49–10.12) 0.46 (0.37–0.56) 0.00%; 0.784 / Digestive system tumor 0.84 0.67 (0.60–0.74) 0.71 (0.61–0.79) 8.55 (4.51–16.19) 2.46 (1.73–3.52) 0.36 (0.17–0.75) 0.00%; 0.468 0.087 Gynecologic cancer 0.84 0.62 (0.56–0.67) 0.83 (0.77–0.88) 7.97 (3.08–20.66) 3.35 (2.02–5.58) 0.44 (0.26–0.73) 74.40%; 0.020 0.528 Test matrix Plasma 0.88 0.62 (0.58–0.66) 0.89 (0.86–0.92) 17.83 (11.54–27.53) 5.93 (4.20–8.37) 0.44 (0.38–0.52) 22.80%; 0.189 0.202 Serum 0.85 0.71 (0.67–0.74) 0.71 (0.66–76) 13.28 (5.22–33.79) 3.21 (1.87–5.51) 0.35 (0.23–0.51) 80.20%; 0.000 0.334 Tissue 0.77 0.63 (0.56–0.70) 0.77 (0.70–0.84) 5.43 (2.78–10.61) 2.35 (1.71–3.23) 0.39 (0.18–0.81) 29.40%; 0.242 0.296 Urine 0.65 0.72 (0.65–0.78) 0.61 (0.56–0.66) 3.64 (1.95–6.77) 1.78 (1.41–2.25) 0.50 (0.34–0.73) 62.2%; 0.047 0.193 Ethnicity Asian 0.82 0.69 (0.67–0.71) 0.72 (0.69–0.74) 9.02 (5.85–13.89) 2.84 (2.24–3.61) 0.40 (0.33–0.48) 75.90%; 0.000 0.525 Caucasian 0.82 0.55 (0.50–0.60) 0.93 (0.90–0.96) 19.23 (10.92–33.88) 9.00 (4.45–18.19) 0.49 (0.44–0.55) 0.00%; 0.936 0.371 NSCLC: non-small cell lung carcinoma; CI: confidence interval; PLR: positive likelihood ratio; NLR: negative likelihood ratio; DOR: diagnostic odds ratio.
Table 3: Analysis of potential sources of heterogeneity among studies by meta-regression test
Study characteristic P-value RDOR 95% CI
Cancer type 0.3952 0.95 (0.83–1.08)
Specimen type (plasma vs. serum vs. urine vs. tissue) 0.0012 0.67 (0.54–0.84) Patient size (< 100 vs. ≥ 100) 0.8093 1.15 (0.34–3.89) Control size (< 100 vs. ≥ 100) 0.8780 0.91 (0.27–3.09) Ethnicity ( Asian vs. Caucasian) 0.2137 3.03 (0.51–18.16) Reference gene ( GAPDH vs. β-actin vs. others) 0.4755 0.92 (0.71–1.18)
Study quality (QUADAS score) 0.5175 0.93 (0.74–1.17) RDOR: relative diagnostic odds ratio; QUADAS: quality assessment for studies of diagnostic accuracy; GAPDH: glyceraldehyde-phosphate dehydrogenase; CI: confidence interval; vs.:versus.
study [23]. In supporting with the previous findings, the current analysis found that plasma-based MALAT-1 testing presented a better AUC value than the serum-, tissue- and urine-based analyses, indicating that plasma might be a suitable matrix for the analysis of MALAT-1 expression in cancers. On the other hand, our subgroup analysis by region showed that Asian- and Caucasian-based MALAT-1 testing sustained equal AUC values (0.82), whereas the latter harbored a superior specificity (0.93) and DOR (19.23). Notwithstanding, the Caucasian-based analysis were only from 1 study (by Weber et al. [8]), thus, more evidences are warranted to confirm this point.
On the other hand, due to the existence of significant heterogeneity across the whole effect size, we further conducted sensitivity analysis and meta-regression test. The influence analysis identified 1 outlier study [20], and its removal resulted in a decrease of heterogeneity in sensitivity but an elevation of heterogeneity in
specificity, hinting that included outlier study is a factor that contributing to the generation of heterogeneities. Moreover, univariate meta-regression test showed that different specimen type is more like to be another cause of heterogeneity among studies. We also observed significant publication bias in the overall pooled analysis. To deeply assess the possible impacts of publication bias on our pooled effects, the Duval and Tweedie nonparametric trim and fill procedure was undertaken [24]. The imputed analyses identified 12 missing studies, and after filling with the 12 missing hypothetical studies, the adjusted effect was slightly altered as compared with the unadjusted one, indicating that the overall pooled accuracy does not yield to the impacts from publication bias.
In summary, our findings provide evidence that elevated MALAT-1 appeared to be a potential diagnostic marker for patients with cancer and could be rated as an auxiliary marker to aid in cancer diagnosis. Nevertheless,
Figure 5: Publication bias assessed by Funnel plot (A) and “Duval and Tweedie nonparametric trim and fill method” (B). Hollow cycle in
our study still reveals several limitations: Firstly, the analysis may have bias in some cancer types that analyzed based on small sample sizes. Secondly, the sample type, control sources as well as the reference gene for testing are complicated. Lastly, most of the included studies are conducted in Asian, and there might be ethnicity bias in the overall combined effects. Further comprehensive and large-scale studies are still warranted to confirm our evidence.
MATERIALS AND METHODS
Search strategyThe international databases included PubMed/ Medline, Evidence-Based Medicine Reviews, EBSCO, and BioMed Central were searched for the retrieval of eligible articles in English, and that CNKI, Wanfang and Weipu databases were retrieved for obtainment of studies published in Chinese. Date of publication was set up to May 1st, 2017. The search approaches with Medical Subject Heading terms or free-text words were utilized as:
(“long non-coding RNA” or “lncRNA” or “MALAT-1” or “Metastasis-Associated-in-Lung-Adenocarcinoma-Transcript-1”) and (“cancer” or “carcinoma” or “tumor” or “neoplasm” or “malignancy”) and/or (“diagnosis” or “area under the curve” or “AUC” or “sensitivity” or “specificity” or “ROC” or “Receiver operation characteristic curve”). We also manually
searched the attached references in articles to increase search sensitivity.
Study selection
Studies were firstly included if they in accordance with the following criteria: (1) studies evaluated the diagnostic performance(s) of MALAT-1 in cancer(s); (2) expression of MALAT-1 was assessed by quantitative real-time polymerase chain reaction (qRT-PCR) or microarray analysis or other approaches; (3) studies had at least a disease group and a control group, with a sample size larger than 20; (4) the estimated sensitivity, specificity or AUC were available; and (5) the full-text was published in English or Chinese. Studies did not match the following criteria were excluded: (1) the control types were undefined or the sample sizes were smaller than 20; and (2) studies identified as review articles, basic research, animal studies, comments, letters or conference abstracts. Study bias assessment
The bias among eligible studies was evaluated in duplicates by two group authors, using the evidence-based Quality Assessment for Studies of Diagnostic Accuracy II (QUADAS-2) checklist (www.quadas.org) [27]. This evaluation tool comprises four phases: review question,
review-specific tailoring, flow diagram, and judgments on bias and applicability. Study quality was mainly based on the judgments of risk on bias and applicability, in which the following sections were included: patient selection, index test, reference standard, flow and timing. Risk of bias can be rated as “low”, “high”, or “unclear”, corresponding to a score of “1”, “0” and “0”. A judgment answer of “high” indicates potential bias existing among studies. Study awarded a cumulative score higher or equal to 4 was considered as eligible and that lower than 4 will be eliminated for the meta-analysis.
Data extraction
The basic information of articles were extracted and collected in twice by two trained person, including author’s name, article publication date, study population, cancer type, sample size and type, control size and type, test method, reference gene, sensitivity, specificity, AUC (area under curve), cut-off value, etc. Any disagreements during data extraction will be solved by group consensus (all group members discussed and solved the disagreements together).
Statistical analysis
We conducted and reported this systematic meta-analysis in terms of the guidelines of the Preferred Reporting Items for Systematic reviews and Meta-Analyses (PRASMA) statement [28]. All statistics were conducted based on STATA 12.0 program (Stata Corporation, College Station, TX, USA). Heterogeneity from eligible studies was estimated by Chi2 (Chi-squared), and I2 (I-squared) tests as well as the L’Abbe and Galbraith plot analysis. Either P < 0.05 for the Chi2 test or I2 > 50% for the I2 test were both considered as pooled effects with significant inconsistency. The pooled effect sizes included sensitivity, specificity, PLR, NLR, and DOR were generated using either a random-effect model or a fixed-effect model depending on study heterogeneity. The underlying sources of heterogeneity were further traced by sensitivity analysis and univariate meta-regression test [23]. Study bias due to publication was estimated by visual Funnel plot and quantifiable Deeks’ funnel plot asymmetry test, with a statistical level of P < 0.05. The possible effects of publication bias on the overall pooled accuracy were assessed using “Duval and Tweedie nonparametric trim and fill method” [24].
ACKNOWLEDGMENTS AND FUNDING
This study was supported by the National Clinical Key Specialty Construction Program of China (2013) and Provincial Natural Science Fund of Fujian (No. 2014J01297 to Y. Chen, No.2016J0105 to Z. Xiao and No.2017J05120 to Z. Cui).
CONFLICTS OF INTEREST
All authors declare that there are no conflicts of interest.
REFERENCES
1. Torre LA, Bray F, Siegel RL, Ferlay J, Lortet-Tieulent J, Jemal A. Global cancer statistics, 2012. CA Cancer J Clin. 2015; 65:87–108.
2. Boon RA, Jaé N, Holdt L, Dimmeler S. Long Noncoding RNAs. J Am Coll Cardiol. 2016; 67:1214–1226.
3. Brosnan CA, Voinnet O. The long and the short of noncoding RNAs. Curr Opin Cell Biol. 2009; 21:416–425. 4. Inamura K. Major Tumor Suppressor and Oncogenic Non-Coding RNAs: Clinical Relevance in Lung Cancer. Cells. 2017; 6. https://doi.org/10.3390/cells6020012.
5. Yu B, Shan G. Functions of long noncoding RNAs in the nucleus. Nucleus. 2016; 7:155–166.
6. Ji P, Diederichs S, Wang W, Boing S, Metzger R, Schneider PM, Tidow N, Brandt B, Buerger H, Bulk E, Thomas M, Berdel WE, Serve H, et al. MALAT-1, a novel noncoding RNA, and thymosin beta4 predict metastasis and survival in early-stage non-small cell lung cancer. Oncogene. 2003; 22:8031–8041.
7. Chang JL, Li ZG, Wang XY, Yang MH. Detection of p53, malatl, ki-67 and β-catenin mRNA expression and its significance in molecular diagnosis of colorectaI carcinoma. [Article in Chinese]. World Chinese Journal of Digestology. 2008; 16:3849–3854.
8. Weber DG, Johnen G, Casjens S, Bryk O, Pesch B, Jockel KH, Kollmeier J, Bruning T. Evaluation of long noncoding RNA MALAT1 as a candidate blood-based biomarker for the diagnosis of non-small cell lung cancer. BMC Res Notes. 2013; 6:518.
9. Liu JH, Chen G, Dang YW, Li CJ, Luo DZ. Expression and prognostic significance of lncRNA MALAT1 in pancreatic cancer tissues. Asian Pac J Cancer Prev. 2014; 15:2971–2977. 10. Wang F, Ren S, Chen R, Lu J, Shi X, Zhu Y, Zhang W, Jing T, Zhang C, Shen J, Xu C, Wang H, Wang H, et al. Development and prospective multicenter evaluation of the long noncoding RNA MALAT-1 as a diagnostic urinary biomarker for prostate cancer. Oncotarget. 2014; 5:11091–11102. https://doi.org/10.18632/oncotarget.2691. 11. Guo F, Yu F, Wang J, Li Y, Li Y, Li Z, Zhou Q. Expression
of MALAT1 in the peripheral whole blood of patients with lung cancer. Biomed Rep. 2015; 3:309–312.
12. Chen Q, Su Y, He X, Zhao W, Wu C, Zhang W, Si X, Dong B, Zhao L, Gao Y, Yang X, Chen J, Lu J, et al. Plasma long non-coding RNA MALAT1 is associated with distant metastasis in patients with epithelial ovarian cancer. Oncol Lett. 2016; 12:1361–1366.
13. Han CX. The expression and clinical significance of long non-coding RNA MALAT1 in endometrial cancer.
[Article in Chinese]. Chinese Journal of Family Planning & Gynecotokology. 2016; 8:51–55.
14. Duan W, Du L, Jiang X, Wang R, Yan S, Xie Y, Yan K, Wang Q, Wang L, Zhang X, Pan H, Yang Y, Wang C. Identification of a serum circulating lncRNA panel for the diagnosis and recurrence prediction of bladder cancer. Oncotarget. 2016; 7:78850–78858. https://doi.org/10.18632/ oncotarget.12880.
15. Konishi H, Ichikawa D, Yamamoto Y, Arita T, Shoda K, Hiramoto H, Hamada J, Itoh H, Fujita Y, Komatsu S, Shiozaki A, Ikoma H, Ochiai T, et al. Plasma level of metastasis-associated lung adenocarcinoma transcript 1 is associated with liver damage and predicts development of hepatocellular carcinoma. Cancer Sci. 2016; 107:149–154. 16. Peng H, Wang J, Li J, Zhao M, Huang SK, Gu YY, Li Y, Sun XJ, Yang L, Luo Q, Huang CZ. A circulating coding RNA panel as an early detection predictor of non-small cell lung cancer. Life Sci. 2016; 151:235–242. 17. Shi T, Gao G, Cao YL. Expression of MALAT1 in serum of
the patients with non-small cell lung cancer(NSCLC) and its clinical significance. [Article in Chinese]. Chin J Clin Lab Sci. 2016; 34:114–117.
18. Wen Z, Li X. Diagnostic value of long non-coding RNA lung adenocarcinoma transcript 1 in serum for clinical diagnosis of lung cancer. [Article in Chinese]. Journal of Clinical Pulmonary Medicine. 2016; 21:2154–2158. 19. Miao Y, Fan R, Chen L, Qian H. Clinical Significance of Long
Non-coding RNA MALAT1 Expression in Tissue and Serum of Breast Cancer. Ann Clin Lab Sci. 2016; 46:418–424. 20. He B, Zeng J, Chao W, Chen X, Huang Y, Deng K, Huang
Z, Li J, Dai M, Chen S, Huang H, Dai S. Serum long non-coding RNAs MALAT1, AFAP1-AS1 and AL359062 as diagnostic and prognostic biomarkers for nasopharyngeal carcinoma. Oncotarget. 2017; 8:41166–41177. https://doi. org/10.18632/oncotarget.17083.
21. Tang R, Jiang M, Liang L, Xiong D, Dang Y, Chen G. Long Noncoding RNA MALAT-1 Can Predict Poor Prognosis: A Meta-Analysis. Med Sci Monit. 2016; 22:302–309. 22. Zhu L, Liu J, Ma S, Zhang S. Long Noncoding RNA
MALAT-1 Can Predict Metastasis and a Poor Prognosis: a Meta-Analysis. Pathol Oncol Res. 2015; 21:1259–1264. 23. Cui Z, Chen Y, Xiao Z, Hu M, Lin Y, Chen Y, Zheng Y.
Long noncoding RNAs as auxiliary biomarkers for gastric cancer screening: A pooled analysis of individual studies. Oncotarget. 2016; 7:25791–25800. https://doi.org/10.18632/ oncotarget.8268.
24. Duval S, Tweedie R. Trim and fill: A simple funnel-plot-based method of testing and adjusting for publication bias in meta-analysis. Biometrics. 2000; 56:455–463.
25. Glas AS, Lijmer JG, Prins MH, Bonsel GJ, Bossuyt PM. The diagnostic odds ratio: a single indicator of test performance. J Clin Epidemiol. 2003; 56:1129–1135. 26. Thornbury JR, Fryback DG, Edwards W. Likelihood ratios
as a measure of the diagnostic usefulness of excretory urogram information. Radiology. 1975; 114:561–565.
27. Whiting PF, Rutjes AW, Westwood ME, Mallett S, Deeks JJ, Reitsma JB, Leeflang MM, Sterne JA, Bossuyt PM. QUADAS-2: a revised tool for the quality assessment of diagnostic accuracy studies. Ann Intern Med. 2011; 155:529–536.
28. Moher D, Liberati A, Tetzlaff J, Altman DG. Preferred reporting items for systematic reviews and meta-analyses: the PRISMA statement. Int J Surg. 2010; 8:336–341.