Prognostication of Deaf and Treatment
Suggestion Using K-Means Clustering Algorithm
K.Rajalakshmi
1, Dr.S.S.Dhenakaran
2, N.Roobini
3 Department of computer science & engineering,Alagappa University, Karaikudi
Abstract-Data Mining is the fastest growing field in computational environment in which new patterns are discovered from huge volume of data. Data Mining techniques can be used in different area including networking, image processing and as well as in medical field. The medical industry has large volume of data collections. These data collections are needed to convert as useful knowledge. Nowadays, data mining techniques are applied in medical research to analysis the huge amount of medical data. Normally medical data mining is used for prediction. This paper analysis the data sets to predict the deafness earlier and suggesting treatments using K-Means algorithm.
Index Terms – Data Mining, Clustering, K-Means algorithm
I. INTRODUCTION
Data mining is the approach for finding invisible knowledge from massive amount of data. Since the patients counting increases the medical databases also expanding every day. The transactions and analysis of these medical data will be complex without the computer based analysis system. The computer based analysis system indicates the automated medical diagnosis system. This automated problem identification system supports the medical experts to make good decision in treatment and disease. Data mining is the massive areas for doctors to handle the huge amount of patient’s data sets in many ways such as make sense of complex diagnostic tests, interpreting previous results, and combining the different data together. Traditionally dispensary decision is sculpture by the medical expert’s observations rather than the knowledge
which obtain from the enormous amount of data. This computerized diagnosis system leads to increases the quality of service provided to the patients and decreases the medical expenses. Healthcare data mining is the maturing research area in data mining technology. Data mining holds great promising for healthcare management to allow health system to systematically use data and analysis to improve the care and reduce the cost concurrently could apply to as much as 30% of overall healthcare spending. In the healthcare management data mining prediction are playing active role. The healthcare management should provide better diagnosis and healing to the patients to accomplish good quality of service.
HEARING LOSS
Hearing impairment is inability of to hear sound partially or fully. There are three types of hearing loss. They are conductive hearing loss, sensorineural hearing loss, and combination of both. Hearing loss may be caused by different factors. They are as follows: Genetic Disease Accident Aging Drugs Infection Environment pollution
In India hearing loss is the second most common cause of disability. Approximately around 63million that is 6.3% people were suffered from auditory loss. Early identification and diagnosis of hearing problem will get proper treatments that may reduce the population of deaf people.
II.DATA MINING
Data mining is the process of joining one or more data source and derives the new knowledge from that data collection. The data mining process uses different techniques. Classification Clustering Association Regression Neural Network
The following figure represents various stages of data mining process.
Fig.1.Data Mining Process
III.CLUSTERING
Clustering is the most important unsupervised learning classification. The process of dividing data into similar object is known as clustering. These clustering methods can be classified as follows: a) Partitioning method b) Hierarchical method c) Density-based method d) Grid-based method e) Model-based method f) Constraint-based method Fig.2 Clustering K-Means Algorithm
K-means clustering is partition based clustering technique. It was introduced by Macqueen in 1967. This is one of the simplest forms of unsupervised learning algorithm that used to solve cluster based problem. In K-means clustering algorithm given data sets are divided into fixed number of clusters. This algorithm consists of two phases. They are as follows:
1. Fix the K value in advance and choose K center in random manner.
Method:
INPUT: Number of desired clusters K and a database
D= {d1, d2… dn} Containing n data objects.
OUTPUT: A set of K clusters.
Steps:
1. Determine the center of clusters
2. Determine the distance of each data object to the centroids
3. Set the position of each cluster to mean of all data points belonging to that cluster
4 .Repeat steps 2&3 until convergence
K-means algorithm uses iterative method that minimizes the sum of distances from each object to its cluster centroid. These algorithm processes until the sum of distance cannot be decreased further.
Advantages of k-means algorithm:
a) The main advantage of the algorithm is simplicity and its speed which allows running large datasets.
b) K-Means may be faster than hierarchical clustering (if K is small).K-Means may produce tighter clusters than hierarchical clustering, especially if the clusters are globular
Euclidean Distance Measure
Mostly commonly used distance measure is Euclidean distance measure. Normally it suited for continuous variables. This formal compare two items on their attributes and determines how they closed to each other. X, Y is two points.
V.PROPOSED WORK
There are many approaches that have been used for different disease prediction. In some cases, advance numerical analysis has used to predict the disease but cluster analysis is used for different types of predictions mostly.
Fig.3.System Architecture
This paper provides a methodology for predicting the deafness. By using the technique, K-means clustering deaf prediction is performed on the patient’s data which are given by the users in form based environment.
Datasets:
In this system totally 33attributes and nearly 1600 instances are taken for clustering to find out the results. Table 1(a), 1(b) shows sample data sets.
The K-means clustering algorithm is applied on user input and results are stored in database and then the causes, treatments suggestion will provide to the users. The results will be in three categories they are as follows:
a. Genetic(Cluster 1) b. Medication (cluster 2)
c. Accidental (cluster 3)
The k-Means algorithm assigns each point to the clusterwhose centroid is nearest. The centroid value is the mean of all the points in the cluster. The data set has three dimensions and the cluster has two points X, Y
X = (x1, x2, x3) and Y = (y1, y2, y3).
Then the centroid Cbecomes C = (z1, z2, z3), where
C1=𝒙𝟏+𝒚𝟏𝟐 , C2=𝒙𝟐+𝒚𝟐𝟐 , C3=𝒙𝟑+𝒚𝟑𝟐
Fig.4 K-Means algorithm
In this system mainly used clustering for groupingthe attributes. As we take almost 33 attributes such as age.In this system take various attributes such as age, diabetes, generation details, family syndrome, middle ear surgery, gender,blood pressure, chest pain,
etc.This attributes are grouped through K-Means clustering algorithm. For example took an attribute such as age and here considered the age of the person between 0-100. When applying K-means algorithm on the age data set, it will find the centroid value and divide it into three clusters.
Here, age will be divided into 3 clusters such as from 0-30,31-60,61-100. It will assign values to each cluster. The values are as follows
0-30=0 31-60=1 61-100=2
For gender attribute it will divide into groups such as Male=0 Female=1.Table 2 shows entire data set values. K-means algorithm will be applied on each and every attribute which are taken. According to values attributes and their values will be added in a dataset. Then the system is being ready for prediction.
1) init clustering[] to get things started.
o Initiate number of clusters as 3 o Initiate cluster centroid as 1,2,3
for cluster1, cluster2, cluster 3 respectively
2) The Updateclustering returns false if there is a cluster that has no tuples assigned to it parameter
means[][] is really a reference parameter, its
check existing cluster count can omit this check if InitClustering and UpdateClustering both guarantee at least one tuple in each cluster 3) Compute distances from current tuple to all k
means (Euclidean distance)
2925 ISSN: 2278 – 7798 All Rights Reserved © 2015 IJSETR
Initial cluster
Centroid (c1):1 Centroid (c2):2 Centroid (c3):3
Data sets values as follows 1,1,1,1,2,2,2,2,1,3,3,3,1,1,1,1,1,2,2,2,2,3,3,3,3,2,1,2,2,2,1
Distance calculation
E.g. .Distance= 32− 22=5 likewise distance value between clusters and data points is calculate for each data set value. Then the data points are move to the cluster which has minimum distance. And recalculate the centroid value
2927 ISSN: 2278 – 7798 All Rights Reserved © 2015 IJSETR
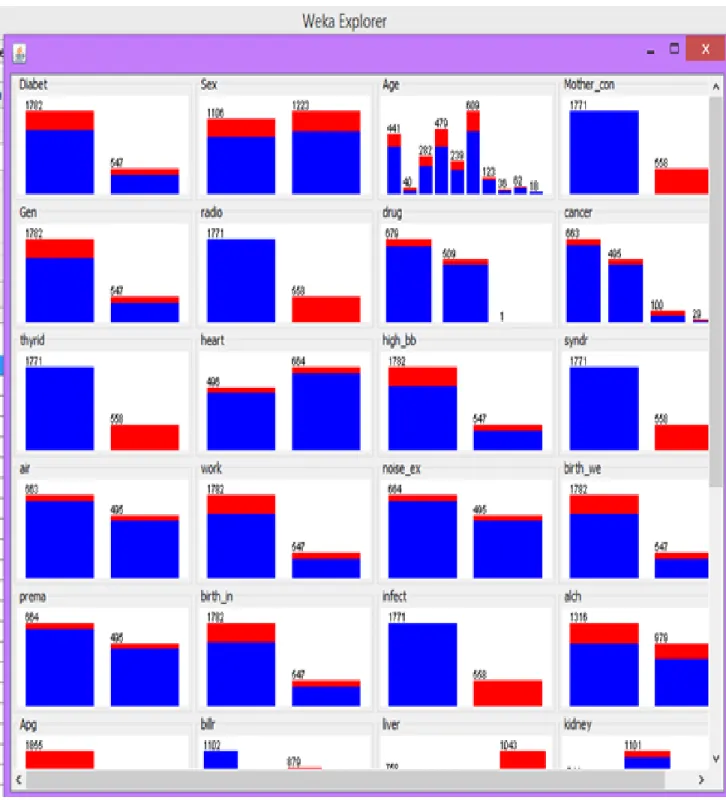
Fig .6 shows the resulting data file is “deaf.csv” and includes 1530 instances. As an illustration of performing clustering in WEKA,it’suse to implementing the K-means algorithm to cluster the patients in this data set, and to characterize the patients into different cluster. Figure 6 shows the main WEKA Explorer interface with the data file loaded.
Fig.7 cluster produced by weka tool
Fig.7shows the resulting window shows the centroid of each clusters and as well as statistics on the numbers. And
also the percentage of instances assigned to different clusters. Cluster centroids are the mean value for each cluster. These centroids can be used to characterize the clusters. For example, the centroid for cluster 1 representing people who has deafness because of genetic factors, like wise cluster 2 representing people has deafness because of accidental factors and cluster 3 representing people who has deafness because of medication.
2929 ISSN: 2278 – 7798 All Rights Reserved © 2015 IJSETR
Fig 8 shows no. of cluster can be decided by the user and for each attribute there is three different
dimensions available (x-axis, y-axis, and color). Different combinations of attributes will result in a visual rendering of different relationships within each cluster. In the above figure, fixthe cluster number as x-axis, the instance number (assigned by WEKA) as the y-axis cluster. In this case, by changing the color dimension to other attributes, it can be seen their distribution within each of the clusters.
CONCLUSION AND FUTURE SCOPE
In this paper, a new idea to predict deafness of people earlier throughK-means clustering algorithm has introduced. It overcomes the manual prediction of deafness. This technique is suitable for the dynamic databases where the people input may differ from each other. In future, incremental clustering algorithms can be used to predict the deafness and can compare them with each other to detect which algorithm among them provide better accuracy.
REFERENCE
[1] V.BalaSundar, T.devi, N. saravanan “Development of a Data Clustering Algorithm for Predicting Heart”, International Journal of Computer Applications (0975 – 888) Volume 48– No.7, June 2012.
[2] Marina Gorunescu, Florin Gorunescu, RaduBadea, and Monica Lupsor “Evaluation on liver ¯brosis stages using the k-means
clustering algorithm”, Annals of University of Craiova, Math. Comp. Sci. Ser. Volume 36(2), 2009, Pages 19{24 ISSN: 1223-6934.
[3] VelidePhani Kumar and Lakshmi Velide,” Data Mining Approach for Prediction and Treatment Of diabetes Disease” VelidePhani Kumar-et al., IJSIT, 2014, 3(1), 073-079
[4] Atul Kumar Pandey, PrabhatPandey, K.L. Jaiswal, Ashish Kumar Sen ,” DataMining Clustering Techniques in the Prediction of Heart
Disease using Attribute Selection Method”, International Journal of Science, Engineering and Technology Research (IJSETR) Volume 2,
Issue 10, October 2013
[5]. G.Visalatchi, S.J Gnanasoundhari, Dr.M.Balamurugan,” A Survey on Data Mining Methods and Techniques for Diabetes Mellitus”, G.Visalatchi et al, International Journal of Computer Science and Mobile Applications,
Vol.2 Issue. 2, February- 2014, pg. 100-105
[6] SathyabamaBalasubramanian, BalajiSubramani,” Symptom’s Based Diseases Prediction In Medical System By Using K-Means
Algorithm”, International Journal of Advances in Computer Science and Technology Available Online at http://warse.org/pdfs/2014/ijacst13322014.pdf
[7] V. Manikantan& S. Latha , “Predicting the Analysis of Heart Disease Symptoms Using Medicinal Data Mining Methods”, International Journal on Advanced Computer Theory and Engineering (IJACTE) ISSN (Print) : 2319 – 2526, Volume-2, Issue-2, 2013.
[8] K. Rajalakshmi&Dr. S. S. Dhenakaran , “Analysis of Datamining Prediction Techniques in Healthcare Management System” ,Volume 5, Issue 4, April 2015, ISSN: 2277 128X International Journal of Advanced Research in Computer Science and Software Engineering.