63
Corporate Social Responsibility Reporting:
Differences among Selected EU Countries
Nikolina Markota Vukic
RRiF d.o.o, Zagreb, Croatia
Abstract
Background: Greater transparency has become a relevant topic for companies around the world. Information and communication technologies revolution (ICT revolution) has forced companies to become more transparent. With the intention of increasing companies’ transparency, the European Union (hereinafter: the EU) has presented a new Accounting Directive 2013/34/EU which makes Corporate Social Reporting (hereinafter: CSR reporting) mandatory for certain companies. Objectives: EU Directives should be the same for all Member States; however, some authors have concluded that CSR reporting is different in companies of different sizes, industries or from different countries. The main objective of this paper is to research into differences of CSR reporting among selected EU countries. Methods/Approach: The Global Reporting Initiative (hereinafter: GRI) has shaped a reporting framework for CSR reporting. In this research the GRI will be used for comparison of CSR reports of different countries. Results: Results of this research revealed that the difference in CSR reporting is statistically significant among selected EU countries. Conclusions: As CSR reporting in the EU will become mandatory for certain companies, it will be a challenge for Member States to harmonize their national legislation to a degree which will increase companies’ transparency and at the same time protect local resources and interests of stakeholders.
Keywords: Corporate Social Responsibility reporting, Global Reporting Initiative, CSR reporting framework, European Union
JEL classification: O1, Q01 Paper type: Research article Received: March 10, 2015 Accepted: Jul 26, 2015
Citation: Markota Vukić, N. (2015), “Corporate Social Responsibility Reporting: Differences among Selected EU Countries”, Business Systems Research, Vol. 6, No. 1, pp. 63-73.
DOI: 10.1515/bsrj-2015-0012
Introduction
Development of corporate and business financial and non-financial reporting is at its crucial stage. Organizations and governments around the world have undertaken many important initiatives to increase global transparency and accountability of the
64
business sector. During the last years, definitions of business accountability and success have broadened, so companies today are expected to achieve environmental and social goals, as well as economic ones. To follow the trend of increased business accountability, strong initiatives like the International Integrated Reporting Council (IIRC) and the GRI have created a reporting framework to help companies on their path to achieving a sustainable competitive advantage on the global market. CSR proponents research and discuss the competitive advantage on the market as the main motif for implementation of CSR into company operations. The concept of CSR implies integration of social and environmental concerns into business operations and companies’ interaction with their stakeholders. CSR reporting as part of companies’ CSR strategy can be defined according to Elkington’s (1997) Triple Bottom Line approach of reporting the economic, social and environmental corporate impacts, activities and policies. Schreck (2013) offered a definition of CSR reporting as a company’s systematic disclosure of information on its social performance.
The goal of this paper is to investigate the existence of influence that different countries in the EU might have on companies’ CSR reporting. In order to achieve the set goal, a research of the selected EU countries will be conducted.
The paper is outlined as follows. After the introduction, theoretical background of CSR reporting is provided with special emphasis on the GRI. The subject of CSR reporting is presented as a separate dimension with definitions, trends, and the GRI as the most implemented methodology for CSR reporting. After the theoretical part, a research of different countries and a degree of CSR reporting are presented. The degree of CSR reporting is measured in accordance with the GRI Application level. After the empirical part of the paper, brief conclusion is provided, main limitations are presented, and future research is suggested.
Corporate Social Responsibility reporting
Corporate Social Responsibility (hereafter CSR) was for the first time formally introduced in the EU by the Commission of the European Communities in the Green Paper (2011, p. 8), which defined it as “a concept whereby companies integrate social and environmental concerns in their business operations and their interaction with their stakeholders on a voluntary basis”. There are many definitions of CSR, however, from the point of view of CSR reporting in EU context it could be considered the most relevant one. According to the mentioned definition, it is possible to conclude that CSR is a concept mostly focused on interaction and dialogue between a company and its stakeholders. The most common tool of interaction and dialogue are CSR reports issued by companies in order to respond to their stakeholders’ needs.
CSR reporting is a new term, but its main purpose existed before in business sector. It is possible to say that CSR reporting represents an evolution in corporate reporting which includes matters of company’s environmental (like usage of energy and resources) and societal (like care for employees, impacts on local communities) impacts and policies. However, there are many definitions of CSR reporting which explain the purpose of the reporting process. The most cited definition of CSR and CSR reporting is the one provided by Elkington (1997) who presented a concept of Triple Bottom Line. The concept of Triple Bottom Line presents a starting point for designing CSR reports, because it encourages companies to disclose their economic, social and environmental impacts in order to inform their stakeholders and increase transparency of their business. According to Schreck (2013, p. 801) “CSR reporting refers to a company’s systematic disclosure of information on its
65 social performance. The term social performance is understood in a broad sense and refers to social, environmental, and governance issues that are typically not covered by financial performance metrics.” However, when social and environmental issues became public concern, companies were expected to respond to those concerns (Cornelissen, 2008).
According to KPMG (2013) and (Global Reporting Initiative, 2013a) studies, the share of CSR reporting among 250 global companies increased from 35% in 1999 to 95% in 2011. However, the increasing trend raises questions about the quality of CSR reports. KPMG (2013) found that the number of CSR reports is increasing at the global level and starting to replace the local or industry CSR reporting. The increased global trend is mostly seen in global multinational companies, which again raises the question of the influence of national laws on the field of CSR of the local business. CSR reporting is still not mandatory for all companies. Considering CSR reporting practice companies can be divided into three groups. The first group is composed of companies who choose not to disclose their social and environmental activities because they do not consider it relevant for their business. Companies belonging to the second group choose to disclose CSR reports on voluntary basis. Companies in the third group have to disclose their CSR activities because of their size or industry. Companies that choose to disclose CSR reports can choose between many tools and communication channels to provide information about their social and environmental activities and thus increase or maintain stakeholder legitimacy. To disclose CSR activities companies can choose between integrated company reports or CSR reports. Michelon & Parbonetti (2010, p. 495) examined disclosures of 57 companies listed in the Dow Jones Sustainability Index (DJSI), and concluded that “on average companies disclose more sustainability information in social, environmental and CSR reports than in the annual report”.
What motivates companies to start CSR reporting is still not clear, and evidence provided by literature is mixed. According to Spence & Gray, (2007) companies start to issue CSR or non-financial reports because they are motivated through economic thinking, because this kind of reporting enhances shareholder value. To understand the motifs of CSR reporting, Michelon & Parbonetti, (2010) described CSR reporting or disclosure of financial, social and environmental information as part of the dialogue between a company and its stakeholders, in order to provide information on company’s activities that legitimize its behaviour, inform, and change perceptions and expectations of the stakeholders. Burnett, Skousen, & Wright (2011) show that in the long term non-financial reporting has a positive effect on firms’ market value. Even though relevant literature found a strong positive relation between CSR reporting and business performance, many companies still do not issue CSR reports. On the other hand, CSR reporting is considered to be a relevant tool for analysing stakeholders’ needs, identifying risks and achieving a competitive advantage on the market. Tangen (2005) states that CSR reporting can act as a sustainability performance measurement system (SPMS) which can help companies collect, measure, plan and manage important information.
The Global Reporting Initiative
The Global Reporting Initiative (GRI) was founded in 1997 as the Coalition for Environmentally Responsible Economies (CERES), with the main goal of increasing organizational transparency by developing a reporting framework containing environmental information. From the first guideline in 2000 to the latest guideline G4 in 2013, the process of creation was based on the dialogue with different stakeholder groups with the view of improving reporting on environmental
66
performance. According to Aktas, Kayalidere, & Kargin (2013) the GRI is the most widely applied guideline for sustainability reporting. Also, the GRI is the most widely used reporting framework for non-financial reports and it has become a standard for CSR reporting (Global Reporting Initiative, 2013a). A number of alliances between the GRI and key international initiatives such as the United Nations Global Compact, the Organization for Economic Cooperation and Development (OECD) and the UN Environmental Program had the biggest impact on the GRI becoming a standard for non-financial reporting. Today, the GRI is a non-profit organization with headquarters in Amsterdam, Europe.
Until 2013 companies followed the GRI Guidelines with reference to the G3 and G3.1. Application Levels C, C+, B, B+ or A, A+. Each Application Level reflects a degree of reporting coverage for a single measure in the field of Profile Disclosures, Disclosures on Management Approach or Performance Indicators. An additional “plus” (+) at each Application Level means that external assurance was utilized for a specific report (Figure 1).
Figure 1
GRI Application Level with reference to the G3 and G3.1. Application
level C C+ B B+ A A+
Profile
Disclosures Report fully on a minimum of any 10 GRI performance indicators, including at least one from each of: social, economic, and environment. Re po rt Ext e rnal ly A ssu red Report on all criteria
listed for level C plus a minimum of any 20 GRI performance indicators, at least one from each of: economic, environment, human rights, labour, society, product responsibility. Re po rt Ext e rnal ly A ssu red Report on all criteria
listed for level B plus respond on each
core and GRI’s sector supplement indicator with due regard to the materiality principle by either: (a) reporting on the indicator or (b) explaining the reason for its omission. Re po rt Ext e rnal ly A ssu red Disclosures on Management Approach Performance Indicators & Sector Supplement Performance Indicators
Source: GRI Guidelines with reference to the G3 and G3.1. Application Levels (2011), available at: globalreporting.org/resourcelibrary/G3.1-Application-Levels.pdf, (1 May 2015)
After 2013 and the presentation of the new GRI Guidelines, companies can choose between two options, Core or Comprehensive, when preparing their reports in accordance with the new G4 Guidelines. G4 Guidelines differ from G3 and G3.1 in materiality prioritization. According to G4, company discloses only on material aspects on the Core or Comprehensive level.
Methodology
As mentioned before in the paper, the GRI reporting framework is an internationally accepted institutional mechanism for CSR reporting. In this research the GRI
67 Application Level will present a degree of CSR reporting in the company. For this research, companies with headquarters in countries from Central and Western Europe were selected from the GRI Database (Austria, France, Italy, the Netherlands, Germany, Sweden, Switzerland and Great Britain). The criterion for the selection of countries was the highest number of CSR reports in the GRI Database in 2013 (Global Reporting Initiative, 2013b) and top 8 countries were selected.
Application Level criteria of CSR reports reported by the GRI methodology can be seen in Figure 1.
In this research the independent variable is a Country which repesents the analysed company headquarter`s country. The analysed companies have headquarters in the following countries: Austria, France, Italy, the Netherlands, Germany, Sweden, Switzerland, Great Britain (Table 1).
Table1
Independent and dependent variables
Variable Description Modalities
Independent variables
Country Company
headquarter`s country
Austria, France, Italy, Netherlands, Germany, Sweden, Switzerland, Great Britain
Deependent variables Application level of GRI
reporting framework Quality of the CSR report Level A, Level B, Level C Source: Authors' work
Table 1 also represents dependent variables of the Application Level which is measured with the GRI reporting framework using three different degrees (modes): Level A, Level B and Level C. To estimate the average rating of a country’s CSR reporting according to the GRI Application Level, ponder CSR reporting variables were used in the research. For Application Level A ponder was 3, for Application Level B, ponder was 2 and for Application Level C, ponder was 1.
Results
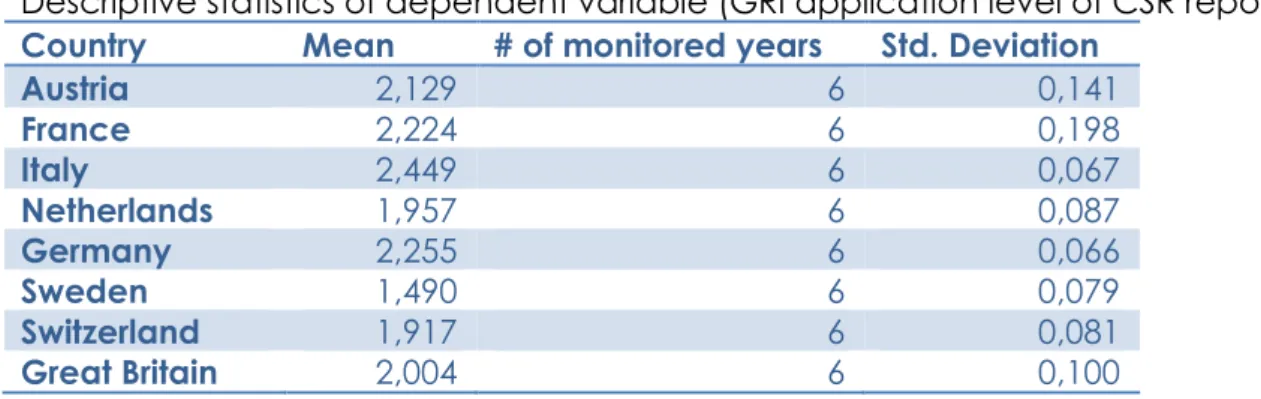
Table 2 represents descriptive statistics of the GRI Application level for the selected EU countries. Results indicate that Italy is the variable with the highest mean value (2,449), while Sweden is the variable with the lowest mean value (1,490). France is the variable with the biggest difference from the mean value (0,198), and Germany (0,066) with the smallest difference from the mean value.
Table 3
Descriptive statistics of dependent variable (GRI application level of CSR reporting) Country Mean # of monitored years Std. Deviation
Austria 2,129 6 0,141 France 2,224 6 0,198 Italy 2,449 6 0,067 Netherlands 1,957 6 0,087 Germany 2,255 6 0,066 Sweden 1,490 6 0,079 Switzerland 1,917 6 0,081 Great Britain 2,004 6 0,100
68
Total 2,053 48 0,291
Source: Authors' work based on GRI database research
Figure 2 represents mean values of the independent variable (the GRI Application Level of CSR reporting). It is evident from the graph that Italy (2,499) and Germany (2,255) have the highest mean values, while Sweden (1,490) has the lowest mean value.
Figure 2
Descriptive statistics of dependent variable (Application Level of GRI reporting framework)
Source: Authors' work based on the GRI database research
Table 3 represents Anova analysis of CSR reporting depending on the company`s headquarter country. The results revealed that the difference in the GRI Application Level is statistically significant between at least one pair of selected EU countries at the 1% level (p-value=0,000).
Table 3
Anova analysis of CSR reporting depending on the company`s headquarter country
Sum of Squares df Mean Square F Sig.
Between Groups 3,479 7 0,497 40,486 0,000***
Within Groups 0,491 40 0,012
Total 3,970 47
Note: *** Statistically significant at 1% level
Source: Authors' work based on GRI database research
Table 4 represents the results of Tukey post-hoc test of the difference in the GRI Application Level depending on the company`s headquarter country. Research results for the selected countries are presented below.
Austria revealed statistically significant results at the 1% level with Italy (p-value=0,000) and Sweden (p-(p-value=0,000). At the 5% level Austria has statistically significant results with Switzerland (p-value=0,038). The most representative CSR reports in Austria are: Österreichische Post, OMV, Kommunalkredit Austria, Verbund. France has statistically significant results at the 5% level with Italy (p-value=0,023) and Great Britain (p-value=0,026). At the 1% level results are statistically significant with the Netherlands value=0,003), Sweden value=0,000) and Switzerland (p-value=0,001). Companies like Saint-Gobain, Areva, Total, Atos, Orange Business
0 0,5 1 1,5 2 2,5 3Austria France Italy Netherlands Germany Sweden Switzerland Great Britain
69 Services, Alcatel-Lucent, France Telecom-Orange have the most representative CSR reports in France for 2013.
Italy revealed statistically significant results at the 1% level with the Netherlands (p-value=0,000), Sweden (p-(p-value=0,000), Switzerland (p-value=0,000) and Great Britain (p-value=0,000), and at the 10% level with Germany (p-value=0,075). In Italy companies like Enel, Telecom Italia, Anas S.p.A., UBI Banca, Eni S.P.A., Unicredit, Terna, Intesa Sanpaolo have a long history of CSR reporting and the most representative CSR reports in the country for 2013.
The Netherlands revealed statistically significant results only at the 1% level with Germany (p-value=0,001) and Sweden (p-value=0,000). Triodos Bank Internationaal, Rabobank, BNG Bank, ING Group, ASN Bank, Royal Dutch Shell, PostNL are companies with the highest Application Level (A+) in the Netherlands for 2013.
Germany revealed statistically significant results only at the 1% level with Sweden (p-value=0,000), Switzerland (p-value=0,000) and Great Britain (p-value=0,007). Companies like EnBW AG, BMW Group, Munich Airport, Entega, Puma, Bayer AG, BASF SE, Deutsche Bank, Allianz SE, Siemens, MAN Group, Deutsche Telekom, RWE have the most representative CSR reports in Germany for 2013.
Sweden revealed statistically significant results only at the 1% level with Switzerland (p-value=0,000) and Great Britain (p-value=0,000). Holmen, Ericsson, SKF Group, SCA - Svenska Cellulosa Aktiebolaget are the companies with the most representative CSR reports in Sweden for 2013.
It is possible to conclude from the research that only Italy has statistically significant results with Germany at the 10% level (p-value=0,075).
Table 4
Tukey post-hoc test of the difference in the GRI Application Level depending on the company`s headquarter country (p-values)
Au str ia Fr a nce Italy Net her la nd s G er m a ny Sw e d en Sw itz er land G rea t Br ita in Austria 1 0,804 0,000*** 0,157 0,508 0,000*** 0,038** 0,523 France 1 0,023** 0,003*** 1,000 0,000*** 0,001*** 0,026** Italy 1 0,000*** 0,075* 0,000*** 0,000*** 0,000*** Netherlands 1 0,001*** 0,000*** 0,998 0,996 Germany 1 0,000*** 0,000*** 0,007*** Sweden 1 0,000*** 0,000*** Switzerland 1 0,871 Great Britain 1
Note: * Statistically significant at the 10% level; ** 5%; *** 1% Source: Authors' work based on GRI database research
Conclusion and further research
Summary of the research
CSR reporting has become a relevant topic in the field of company transparency. Even though some companies are not disclosing CSR information, there are many companies with a long history of corporate transparency and CSR reporting. The EU has made a step forward in increasing companies’ transparency by announcing a new Accounting Directive 2013/34/EU according to which certain companies will
70
have to issue CSR reports. To understand CSR reporting, according to Kolk (2010) it is important to know how it differs between different countries, industries, or companies of different sizes. This research revealed statistically significant results showing the difference in CSR reporting among the selected EU countries. The biggest challenge of harmonisation of the EU Directive 2013/34/EU with the national legislation is to increase transparency and accountability of companies but at the same time protects local resources and interests of all stakeholders.
Practical implications
All Member States will have to modify their legislation according to the new EU Accounting Directive. Although the EU plans to provide a standard for CSR or non-financial reporting, organisations like the GRI or the IIRC are doing their best to become accepted as reporting frameworks. In the following years, it will be possible to see the results of the harmonization of the legislation in the Member States with the new EU Directive. In Croatia, low public and academic awareness can result in weak legislation regulating transparency of foreign companies that do business in Croatia and disclose or not disclose their CSR activities. For better harmonisation of Croatian legislation with the new Accounting Directive, it is a necessary to establish a National Non-Financial Reporting Agency with the main purpose of increasing awareness of transparency and accountability of the business sector, which will provide support and framework for the CSR or non-financial reporting.
Limitations and future research
This research, however, has several limitations. Firstly, this research has analysed only direct relationships, so future research should include the influence of additional variables like economic and financial performance or cultural values and norms. Secondly, the research sample of countries could be larger, or the research could be based on differences among companies of different sizes or from different industries. Today, companies involve in CSR reporting mostly on voluntary basis, but after 2016, when CSR reporting will be mandatory for certain companies in the EU, it will be interesting to analyse the trend of CSR reporting and how it differs among different EU countries or industries of the company.
References
1. Aktas, R., Kayalidere, K., Kargin, M. (2013), “Corporate sustainability reporting and analysis of sustainability reports in Turkey“, International Journal of Economics and Finance, Vol. 5, No. 3, pp. 113-125.
2. Burnett, R., Skousen, C., Wright, C. (2011), “Eco-effective management: an empirical link between firm value and corporate sustainability“, Accounting and the Public Interest, Vol. 11, No. 1, pp. 1-15.
3. Commission of the European Communities (2011), “Green Paper: Promoting a European framework for Corporate Social Responsibility”, available at
http://europa.eu/rapid/press-release_DOC-01-9_en.pdf (15 May 2015)
4. Cornelissen, J. (2008), Corporate communication: A guide to theory and practice, London, Sage.
5. Elkington, J. (1997), Cannibals with Forks: The Triple Bottom Line of 21 Century Business, Oxford, Capstone Publishing.
6. Global Reporting Initiative (2013a), Carrots and Sticks - Sustainability reporting policies worldwide – today’s best practice, tomorrow’s trends, 2013 edition.
71 7. Global Reporting Initiative (2013b), “Sustainability Disclosure Database“, available
at http://database.globalreporting.org/ (12 March 2015)
8. Kolk, A. (2010), “Trajectories of sustainability reporting by MNCs“, Journal of World Business, Vol. 45, No. 4, pp. 367-374.
9. KPMG (2013), “The KPMG survey of corporate social responsibility reporting”, available at
https://www.kpmg.com/Global/en/IssuesAndInsights/ArticlesPublications/corpor
ate-responsibility/Documents/corporate-responsibility-reporting-survey-2013-exec-summary.pdf (12 March 2015)
10. Michelon, G., Parbonetti, A. (2010), “The effect of corporate governance on sustainability disclosure“, Journal of Management and Governance, Vol. 16, No. 3, pp. 477-509.
11. Schreck, P. (2013), „Disclosure (CSR Reporting)“,.in Idowu, S. O. et al. (Eds.), Encyclopedia of Corporate Social Responsibility, pp. 801-810, Berlin, Springer-Verlag.
12. Spence, C., Gray, R. (2007), Social and Environmental Reporting and the Business Case, London, Certified Accountants Educational Trust.
13. Tangen, S. (2005), „Analysing the requirements of performance measurement systems”, Measuring Business Excellence, Vol.9, No.4, pp. 46-54.
About the author
Nikolina Markota Vukic is a Ph.D. student of Business Economy at the Faculty of Economics, University of Zagreb. Her research interests include CSR reporting, non-financial reporting, the GRI reporting framework, New Institutional Economics and textual analysis. The author regularly attends relevant conferences, seminars, and workshops. The most important events for CSR reporting understanding visited by the author are: Global Conference on Sustainability and Reporting in 2013, Amsterdam, the Netherlands, and Valuing Non Financial Performance Seminar, Nyenrode Business Universiteit, Amsterdam, the Netherlands. In order to be informed about recent developments in Institutional Economics and to network with relevant professors and young researchers at the global level, Nikolina participated in the 14th session of the European School on New Institutional Economics (ESNIE), Corsica, France founded by the Nobel Laureate Ronald H. Coase. The author can be contacted at: [email protected]
72
Appendix
Appendix 1GRI Application levels for selected EU countries in the period 2008 - 2013
20 13 20 12 20 11 20 10 20 09 20 08 Austria #A 24 14 14 14 11 7 #B 21 19 19 22 11 5 #C 11 11 10 5 15 3 France #A 17 13 9 6 4 1 #B 16 15 14 10 6 7 #C 2 2 2 1 3 2 Italy #A 50 37 39 25 22 19 #B 20 15 18 17 19 19 #C 11 8 7 6 5 4 The Netherlands #A 45 24 26 20 16 12 #B 45 41 35 31 26 17 #C 30 30 30 30 20 16 Germany #A 48 47 47 29 19 16 #B 48 50 36 31 29 22 #C 15 15 24 15 8 2 Sweden #A 15 8 7 9 8 7 #B 41 40 34 28 23 13 #C 57 57 66 68 51 45 Switzerland #A 31 18 22 18 15 8 #B 33 28 31 20 14 9 #C 33 33 24 24 15 13 Great Britain #A 27 21 17 18 16 15 #B 33 33 26 27 20 10 #C 16 16 20 18 25 15
73 Appendix 2
GRI Application levels for selected EU countries in a period 2008 - 2013
2013 2012 2011 2010 2009 2008 Austria #A 24 14 14 14 11 7 #B 21 19 19 22 11 5 #C 11 11 10 5 15 3 France #A 17 13 9 6 4 1 #B 16 15 14 10 6 7 #C 2 2 2 1 3 2 Italy #A 50 37 39 25 22 19 #B 20 15 18 17 19 19 #C 11 8 7 6 5 4 Netherlands #A 45 24 26 20 16 12 #B 45 41 35 31 26 17 #C 30 30 30 30 20 16 Germany #A 48 47 47 29 19 16 #B 48 50 36 31 29 22 #C 15 15 24 15 8 2 Sweden #A 15 8 7 9 8 7 #B 41 40 34 28 23 13 #C 57 57 66 68 51 45 Switzerland #A 31 18 22 18 15 8 #B 33 28 31 20 14 9 #C 33 33 24 24 15 13 Great Britain #A 27 21 17 18 16 15 #B 33 33 26 27 20 10 #C 16 16 20 18 25 15