M E T H O D O L O G Y
Open Access
An empirical study using permutation-based
resampling in meta-regression
Joel J Gagnier
1,2*, David Moher
3,4, Heather Boon
5, Claire Bombardier
6and Joseph Beyene
7Abstract
Background:In meta-regression, as the number of trials in the analyses decreases, the risk of false positives or false negatives increases. This is partly due to the assumption of normality that may not hold in small samples. Creation of a distribution from the observed trials using permutation methods to calculatePvalues may allow for less spurious findings. Permutation has not been empirically tested in meta-regression. The objective of this study was to perform an empirical investigation to explore the differences in results for meta-analyses on a small number of trials using standard large sample approaches verses permutation-based methods for meta-regression.
Methods:We isolated a sample of randomized controlled clinical trials (RCTs) for interventions that have a small number of trials (herbal medicine trials). Trials were then grouped by herbal species and condition and assessed for methodological quality using the Jadad scale, and data were extracted for each outcome. Finally, we performed meta-analyses on the primary outcome of each group of trials and meta-regression for methodological quality subgroups within each analysis. We used large sample methods and permutation methods in our meta-regression modeling. We then compared final models and finalPvalues between methods.
Results:We collected 110 trials across 5 intervention/outcome pairings and 5 to 10 trials per covariate. When applying large sample methods and permutation-based methods in our backwards stepwise regression the covariates in the final models were identical in all cases. ThePvalues for the covariates in the final model were larger in 78% (7/9) of the cases for permutation and identical for 22% (2/9) of the cases.
Conclusions:We present empirical evidence that permutation-based resampling may not change final models when using backwards stepwise regression, but may increasePvalues in meta-regression of multiple covariates for relatively small amount of trials.
Introduction
Systematic reviews are prone to various forms of hetero-geneity between included studies. Variability in the par-ticipants, interventions and outcomes across studies may be termed clinical heterogeneity; variability in the trial design and quality is typically termed methodological heterogeneity; variability in treatment effects between trials can be termed statistical heterogeneity [1,2]. Meth-odological heterogeneity hinges on the exact methods of the individual trials, and how they differ from each other. That is, trials that do not properly conceal alloca-tion to treatment groups may bias estimates in treat-ment effect and cause increased variations in effect
between studies included systematic reviews [3]. Signifi-cant statistical heterogeneity arising from methodologi-cal heterogeneity suggests that the studies are not all estimating the same effect due to suffering from differ-ent degrees of bias [2]. In the currdiffer-ent work, we focus on clinical heterogeneity that arises from differences in par-ticipant characteristics (for example, sex, age, baseline disease severity, ethnicity, and so on), types of outcome measurements, and intervention characteristics (for example, dose, duration of treatment, form of interven-tion and so on).
In systematic reviews that assess heterogeneity, this is typically examined through subgroup analyses or meta-regression. Subgroup analyses involve dividing the com-plete dataset into smaller subgroups to make compari-sons between them. It is suggested that subgroup analyses be preplanned as part of a systematic review
* Correspondence: [email protected]
1
Department of Orthopaedic Surgery, University of Michigan, Ann Arbor, MI, USA
Full list of author information is available at the end of the article
protocol, and even then they should be interpreted with caution [2]. Subgroup analyses may be performed for subsets of participants (for example, males and females) or for intervention characteristics (for example, dose or duration of treatment). These analyses may be per-formed as a means to investigate heterogeneous results, to answer questions concerning patient groups, types of intervention or types of study. However, as more sub-group analyses are performed on a set of trials, the like-lihood of finding false positive or false negative results increases [4].
Meta-regression is an extension of subgroup analyses that allows continuous as well categorical variables to be examined and for the investigation of multiple variables of interest, with the exception of comparisons with less than 10 trials [4]. Meta-regression is similar to simple regression in which an outcome variable is predicted relative to the values of one or more explanatory vari-ables. The outcome variable in meta-regression is the effect estimate, and the explanatory variables (that is, potential effect modifiers or covariates) are any charac-teristics of the study that might influence the effect esti-mate. The regression coefficient in meta-regression describes how the treatment effect changes with each unit increase in the explanatory variable and the statisti-cal significance of the coefficient is a test of whether there is a linear relationship between the two. These investigations can be misleading for several reasons [1,2].
First, meta-regression involves making observational associations that are subject to bias (for example, aggre-gation bias) and confounding (for example, resulting from correlation between characteristics). Also, many systematic reviews using this technique include only a small number of studies while any one of a large num-ber of characteristics of these studies could be a cause of heterogeneity [1,2]. That is, with a smaller amount of studies, the likelihood of a statistically significant expla-natory variable rises; a number of false-positive findings is more likely than in conventional regression [1,2,4]. For these reasons the use of permutation tests have been suggested to assess the‘true’statistical significance of an observed meta-regression finding for individual covariates [1,2,4].
The permutation test is useful for analyses of a small number of studies or a large number of covariates and has the goal of maintaining the type 1 error rate [4]. Permutation-based resampling tests the hypotheses of no effect when the distribution of the test statistic is unknown or when the data are not randomly sampled from a defined population, as is often the case in pri-mary meta-analyses or meta-regression [5]. For example, if we were testing the effect of allocation concealment on the summary treatment effects, and we want to
compare the summary effect of those trials that per-formed adequate allocation concealment (group A) and those that did not (group B), we would test the equality of the two summary treatment effects (one for A and one for B) to determine if they likely originated from the same sampling distribution. For meta-regression the
associated P value is based upon the assumption that
the two statistics were sampled from a normal distribu-tion. For permutation tests, a covariance matrix, or dis-tribution, is created for all possible pairs of observations for groups A and B (total is 32 possible pairs of observa-tions for 2 groups across 5 pairs of trials, or 32 matrices and a summary treatment effect difference for each). Next, a ratio is created relative to the frequency that the observed difference in treatment effect found in the pri-mary analysis exceed the overall sumpri-mary differences
obtained from the permutation analysis resulting in a P
value (for example, 3/32;P = 0.09). A simulation study
has demonstrated that permutation analyses result in more conservativeP values and less false positive rates than standard meta-regression (when referring to the t statistic) especially in the presence of heterogeneity, when there are a small number of studies, or when there are a large number of covariates [4].
Due to the large number of treatment level covariates in trials of herbal interventions [6] and the small num-ber of clinical trials included in systematic reviews of these interventions [7] it is important to decrease the false positive rate in meta-regression analyses while still providing valuable information on which characteristics of the intervention or other trial characteristics influence treatment effects. This may lead to increasingly valid and clinically relevant systematic reviews. With this in mind, our objective was to explore the differences in meta-regression modeling results for a predetermined set of covariates using standard large sample approaches verses permutation-based resampling methods.
Methods
Trial inclusion
From a sample of 406 randomized controlled trials (RCTs) of herbal medicine identified through a literature search reported elsewhere [8], 2 individuals (JJG, HB) with expertise in herbal medicine interventions identi-fied a selection of herbal intervention/condition pairings that would include the largest number of trials for this project. Through consensus they decided on the follow-ing pairfollow-ings: Hypericum perforatumL. (St. John’s wort)
for treating patients with depression, Ginkgo biloba
(ginkgo) for dementia,Serenoa repens(saw palmetto) for
benign prostatic hypertrophy, and Allium sativum
included similar outcome measures. All other trials were excluded from the analyses.
A generally accepted‘rule of thumb’is that ten events per predictor variable (EPV) will maintain bias and variability at acceptable levels. This guidance derives from two simulation studies carried out for logistic and Cox modeling strategies [9-11]. This has been adapted to meta-regression and thus it is suggested that for each covariate there should be at least ten trials to avoid spurious findings [12]. Therefore, we sought to include a minimum of 20 RCTs for each intervention/outcome pairing to allow for valid meta-regression with 2 or more covariates.
Development of intervention level covariates
Next, we identified a variety of intervention level covari-ates for which to explore heterogeneity. We consulted a group of four individuals with expertise in RCTs of her-bal medicine interventions who were asked to identify characteristics of the herbal medicine interventions that might influence estimates of treatment effect (for exam-ple, active constituent levels). The list intervention level covariates was compiled and included: dose, duration of use, percentage of active constituent, part of plant used, form of product (for example, liquid, dried, powder), method of extraction, and the extraction solvent used.
Methodological quality assessment
Methodological quality was assessed separately and independently by two individuals. We assessed the sequence generation, allocation sequence concealment, blinding, and description of withdrawals and dropouts, which was the Cochrane practice at the time of this research [13,14]. Each question was answered with a yes, no or don’t know response option.
All assessments were entered into preformatted extraction forms. The assessors met on a weekly basis to discuss disagreements that were then resolved by consensus. A third party was not required to resolve any disagreements.
Data extraction
One individual extracted the following data and a sec-ond individual checked all extractions: type of interven-tion, details of the intervention identified above, summary effect estimates (mean differences, odds ratio (OR), relative risk (RR), risk difference (RD), no. needed to treat (NNT), no. needed to harm (NNH)) for the out-comes of interest, baseline values for the outout-comes of interest in each group, participant levels characteristics (mean age, proportion of males and females), sample sizes per group (intention to treat where available), mea-sures of central tendency for all groups (mean, median, mode) and measures of variability (SD, SE, range, CI)
before and after treatment on all outcomes of interest, trial length (in weeks), and year of publication.
Statistical analysis
All statistical procedures were performed by one indivi-dual (JJG) using STATA 10.0 (Stata, College Station, TX, USA).
Effect size calculation for individual trials
For each trial, where effect sizes were not reported for continuous outcome measures we calculated them from reported means for all outcomes of interest. For contin-uous variables the effect sizes calculated were mean dif-ferences (MD) from baseline. All effect estimates for the outcomes of interest were calculated on intention to treat (ITT) data where reported. When variance data were not reported as SDs, they were calculated from the trial data using the standard error of the mean (SE),
95% confidence intervals, reported P values, ranges or
interquartile ranges according to methods described in the Cochrane handbook [14]. When trials did not report information to calculate the variances we imputed values by giving trials the average SD calculated from across the other trials.
Meta-analysis for overall effect
The main meta-analysis used a random effects model on the weighted mean differences (WMD) of the primary outcome of interest across all trials. We then collected
the WMD, together with 95% CI,P value for the main
effect and I2results for statistical heterogeneity with the
associated P value. Where measures of variance were
imputed from the average across the other trials, we performed a sensitivity analysis by removing those trials and comparing the results with the findings for the ana-lysis including all trials.
Exploration of heterogeneity
Statistical heterogeneity was detected with Cochran’s Q test [15,16], which tests if the amount of between trial heterogeneity is greater than due to chance and the
recently developed I2 statistic measures the magnitude
of statistical heterogeneity that can be expected by parti-tioning out the chance heterogeneity. Therefore, the presence of statistical heterogeneity was tested using Cochran’s Q test [15,16] and the magnitude of statistical heterogeneity between trials using I2 [1]. An I2 of 0% to 40% will indicate no observed statistical heterogeneity, 30% to 60% moderate heterogeneity, 50% to 90% sub-stantial heterogeneity, and 75% to 100% considerable heterogeneity [2].
outcome pairings. Covariates representing similar topics were grouped into models through a small group pro-cess with the investigators. The first model (model 1) included methodological covariates (proper randomiza-tion, proper double blinding, a description of withdrawal and dropouts (items 2, 4 and 5 of the Jadad scale) and adequate allocation concealment). The second model (model 2) included participant level and intervention level covariates (length of the trial, proportion of males/ females, dose of intervention, baseline severity for the intervention/treatment group). All categorical covariates were coded in a binary manner.
We used backwards stepwise elimination in which the variable with the largest non-significantPvalue for con-tribution to the model was dropped and the regression was repeated. For each model we used standard large sample methods (referring to the t distribution) and
per-mutation-based resampling to arrive at P values.
Vari-ables were dropped until only significant predictors of the treatment effect remained. To maintain model valid-ity, if a binary coded categorical variable was statistically significant, both categories of the variable were kept in the model. Collinear variables were also dropped from the model and explored individually for significance. Statistically significant P values were those less than 0.05. We then compared the final models and models obtained with each method.
In the permutation test we tested the equality of two means: Ho:ux = uy. The assumption being if × data are
sampled from the distribution Px and the Y data from Py then under the null hypothesis all permutations of observations are equally probable. The test statistic was the WMD from the meta-analysis results above on all levels of the covariates across trials. We then estimated the null distribution for the treatment effect by permut-ing (randomly shufflpermut-ing) the observations in the com-bined × and Y samples to create all possible distributions. We then compared the effect estimate (or difference in effect) obtained with meta-regression for each covariate against the permuted distribution of effects to arrive at aP value. All permutations were set at 10,000 shuffles for each analysis and were performed simultaneously across all variables.
Results
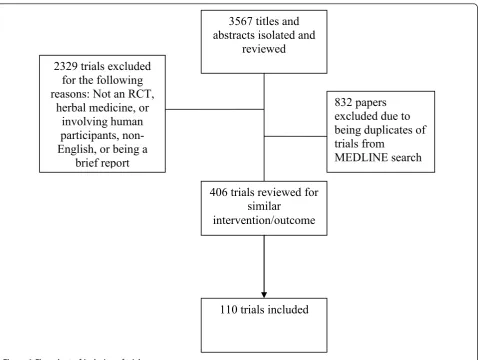
A total of 110 trials were included in our analyses (see Figure 1). The intervention outcome pairings are described in Table 1. All other intervention outcome pairings had less than 20 trials and thus were not included. The primary meta-analyses for each of the pairings are listed in Table 2. For all analyses there was a statistically significant effect in favor of the herbal medicine intervention. We also ran a sensitivity analysis removing those trials for which standard deviations
were imputed. Results of the sensitivity analyses did not appear to differ from the analyses with all trials included. In the primary analysis there was statistically significant heterogeneity for all analyses with I2 values ranging from 65.7% to 99.1%.
Many of the intervention level covariates were not reported in the included trials. Also, in no instance did a trial report enough information to code a trial as per-forming inadequate allocation concealment. Therefore, this variable was coded in a binary manner (1 = ade-quate allocation concealment; 0 = not enough informa-tion reported in the trial). For the backward stepwise meta-regression procedures, the covariates remaining in the final models were identical for large sample techni-ques and for permutation-based resampling methods of
arriving at P values. Out of a total of ten backwards
stepwise procedures, six of the models for both large sample methods and permutation-based resampling resulted in several significant covariates in the final models. Only the models for low-density lipoprotein (LDL)-A. sativum (garlic) and for total cholesterol
(TC)-A. sativumresulted in no covariates remaining
signifi-cant. The P values and I2 of the backwards stepwise
elimination procedure for large sample methods (refer-ring to the t table) and the correspondingPvalues using permutation-based resampling including are listed in
Tables 3, 4, 5. The P values for the covariates in the
final model were larger in 78% (7/9) of the cases for permutation and identical for 22% (2/9) of the cases.
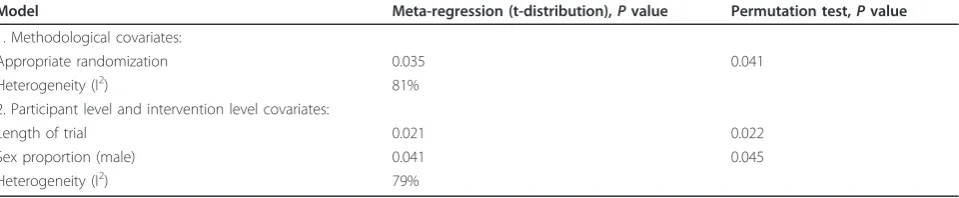
For the Hypericum perforatum (St. John’s
wort)-Hamilton Depression scale (HAM-D) pairing, the back-ward stepwise elimination meta-regression and permuta-tion Pvalues are listed in Table 3. AllPvalues obtained with the permutation tests exceeded those obtained with standard meta-regression. The stepwise elimination
meta-regression and permutation Pvalues for the
influ-ence of covariates on the effect of Allium sativum on
high-density lipoprotein (HDL) are listed in Table 4. None of the methodological variables reached signifi-cance in the first model. In the second model for
parti-cipant level and intervention level covariates both P
values obtained with permutation were identical to those obtained with standard large sample meta-regres-sion. This analysis yielded the smallest I2 value (45.8%) of all stepwise elimination values in all models. The
stepwise elimination meta-regression and permutation P
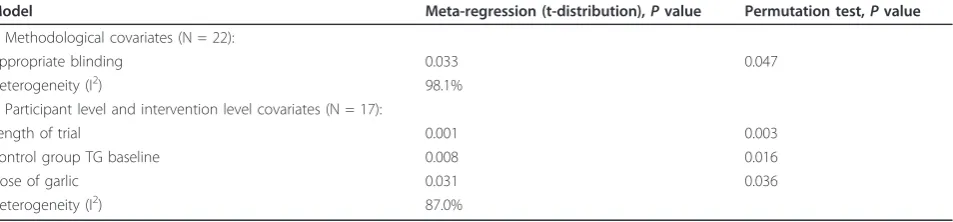
values for the effect of covariates on changes in trigly-ceride (TG) forAllium sativumare listed in Table 5. All
P values for permutation were larger than those
obtained with large sample methods.
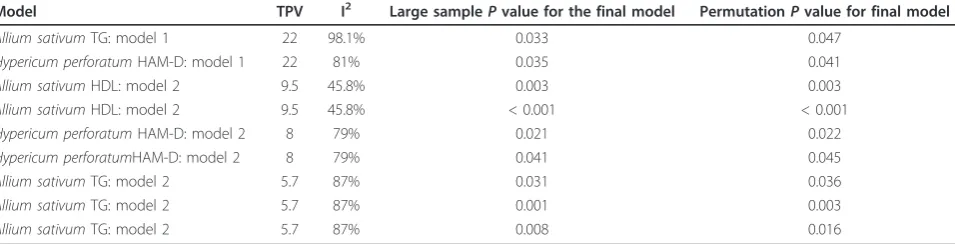
and permutation-based resampling. In the model exhi-biting moderate levels of statistical heterogeneity (that
is, 45.8%; A. sativum-HDL: model 2), and with an
ade-quate number of trials per variable (that is, 9.5) both methods of arriving atPvalues produce identical values.
Discussion
Approximately 50% of systematic reviews use statistical techniques to combine study results and most of these assess consistency across the studies [17]. Several studies
report that tests of presence of heterogeneity are fre-quently performed in meta-analyses, that they are often statistically significant, and that a variety of methods are used to explore heterogeneity, including subgroup ana-lyses and meta-regression [18-21]. Meta-regression may produce spurious findings when performed on a small number of studies, or when investigating multiple cov-ariates [4].
Our study found that using backwards stepwise meta-regression with large sample methods or with permuta-tion-based resampling resulted in identical final models. To the best of our knowledge this is the first empirical test of permutation in meta-regression modeling using an elimination procedure. The results are surprising given that we only had 5 to 6.25 trials per covariate in all of the initial models, which is well below the recom-mended 10 trials per variable [9-12]. Given that this rule of thumb was derived from simulations for logistic and Cox modeling it is possible that these results do not reliably apply to meta-regression procedures on continu-ous outcome variables. For example, a simulation study on using linear and logistic regression resulted in a rule
3567 titles and
abstracts isolated and
reviewed
406 trials reviewed for
similar
intervention/outcome
2329 trials excluded
for the following
reasons: Not an RCT,
herbal medicine, or
involving human
participants,
non-English, or being a
brief report
832 papers
excluded due to
being duplicates of
trials from
MEDLINE search
110 trials included
Figure 1Flow chart of inclusion of trials.
Table 1 Description of included intervention condition pairings
Herbal intervention Outcome measure Number of RCTs
Hypericum perforatum HAM-D 22
Allium sativum TC 25
Allium sativum LDL 20
Allium sativum HDL 21
Allium sativum TG 22
of thumb being proposed that, to avoid overfitting when using forward stepwise selection procedures, an event per variable of greater than 4 is required [22-25]. If we extend this observation to linear meta-regression with a backwards stepwise selection procedure then our results seem to make empirical sense. Furthermore, we recom-mend that more simulations be performed to test the ten trials per variable rule of thumb.
We also found that theP values obtained using
per-mutation tests are more conservative, or larger, than P
values obtained using standard meta-regression meth-ods. Specifically, the Pvalues for significant covariates obtained with stepwise meta-regression were larger with permutation 78% of the time and identical 22% of the time compared with using standard large sample
meth-ods of obtaining P values. This finding is particularly
important whenP values are near a set level of statisti-cal significance (for example, 0.05 or 0.01), since any increase in thePvalue will render the result non-signifi-cant. This finding provides empirical evidence that
per-mutation tests increase P values and that permutation
can be used in meta-analyses especially when examining the effects of multiple covariates, when faced with a relatively small number of included primary studies, or when a large amount of statistical heterogeneity is pre-sent. However, these results do not indicate that permu-tation-based resampling protects against associations arising due to ecological bias. One must always be aware that some associations found at the group level,
in this case the study level, may not apply at the indivi-dual level.
Our findings are similar to those of Higgins and Thompson [4] who found that when examining multiple covariates in a random effects analysis, permutation
resulted in generally larger P values, but not in all
instances. For example, they found that for the covariate
‘intention to treat analysis’ the P value obtained by
meta-regression was larger than that found with permu-tation. We found that out of nine significant covariates the Pvalues for seven of these were larger in the per-mutation tests. In the other two instances the Pvalues were identical. It is possible that the relatively low het-erogeneity found in the latter final model (45.8%), or the relative normality of the distribution of effects in the final model resulted in this finding. It is possible that the level of statistical heterogeneity plays a larger role than the number of trials in meta-regression. This hypothesis remains to be tested.
Meta-regression may result in spurious findings with either multiple covariates, with a small number of pri-mary studies [4,25-28] or when there is a large magni-tude of statistical heterogeneity. Permutation tests quell
P values when exploring heterogeneity in these
circum-stances and will lead to more conservative probability
estimates. In some cases theP value may cross over to
non-significance. This finding is important in meta-ana-lytic research especially since meta-analyses often include a small number of primary studies [4,15],
Table 2 Results of primary meta-analyses and sensitivity analyses
Intervention outcome pairing
Primary analysis main effect, (95% CI); N trials; I2 (%)
Sensitivity analysis main effect, (95% CI); N trials; I2 (%)
Hypericum perforatum-HAM-D WMD = -3.43 (-4.6 to -2.25); 22ab; I2= 84.7% WMD = -3.61 (-4.14 to -3.07); 13ab; I2= 87.7%
Allium sativum-TC WMD = -8.95 (-9.65 to -8.25); 25ab; I2= 99.1% WMD = -9.27 (-9.98 to -8.56); 19ab; I2= 99.3%
Allium sativum-LDL WMD = -4.99 (-5.4 to -4.59); 20ab; I2= 65.7% WMD = -5.05 (-5.45 to -4.64); 13ab; I2= 96.4%
Allium sativum-HDL WMD = 1.15 (1.05 to 1.25); 21ab; I2= 77.7% WMD = 1.15 (1.05 to 1.25); 11ab; I2= 86.4%
Allium sativum-TG WMD = -15.78 (-17.30 to -14.24); 22ab; I2= 98.4% WMD = -15.72 (-17.34 to -14.09); 10ab; I2= 99.2% a
P< 0.001 for the main effect.
b
P< 0.001 for Cochran’s Q test.
HAM-D = Hamilton Depression Scale score; HDL = high-density lipoprotein; LDL = low-density lipoprotein; TC = total cholesterol; TG = triglyceride; WMD = weighted mean differences.
Table 3Hypericum perforatumHAM-D pairing stepwise elimination results: comparison of finalPvalues for final models using both large sample and permutation techniques
Model Meta-regression (t-distribution),Pvalue Permutation test,Pvalue
1. Methodological covariates:
Appropriate randomization 0.035 0.041
Heterogeneity (I2) 81%
2. Participant level and intervention level covariates:
Length of trial 0.021 0.022
Sex proportion (male) 0.041 0.045
included studies often fail to report important informa-tion for these analyses [19], and they often have signifi-cant statistical heterogeneity [28-30]. The ability to accurately explore the reasons for heterogeneity and the influence of specific covariates could create increasingly specific and clinically relevant findings in meta-analyses and lead to valid hypothesis generation for future clini-cal trials. This could potentially save many resources including time, healthcare expenditure, and funding allo-cation. In agreement with previous recommendations [4] it is advised that permutation tests be used in all meta-analyses that include a small number of clinical trials per covariate (five or less to ten) or that have consider-able or substantial heterogeneity.
This study has several strengths. First, we included a large number of primary studies and crosschecked the data extractions. By including a large number of studies we have performed an empirical test of permutation, which goes beyond previous simulations [4]. Next, we used a set of covariates that have empirical and theoreti-cal relationships with our outcome variables. For exam-ple, it is well known that adequate randomization sequence generation and allocation concealment are important predictors of effect size [2,3,29,30]. Also, it follows from basic pharmacokinetics that differing doses of the active herbal medicine or its active constituent predict clinical responses [10]. An additional strength of this study was that we ran 10,000 iterations in the per-mutation tests. Given that perper-mutation tests are random processes, a larger number of permutations results in very similar findings with each additional permutation using the same variable. Therefore, our permutation test
Pvalues are likely robust. Another strength of this study
is that it extends the statistical techniques that can be used in meta-analyses, giving reviewers an empirically validated method when analyzing the influence of covariates.
A drawback of this study is that it may not include all RCTs examining the herbal medicine outcome pairings chosen. That is, the treatment effect estimates presented
in Table 2 may not be ‘true’ estimates of the effect
across all published trials. We did not set out to per-form a comprehensive meta-analysis on each pairing or to describe the actual or true extent/degree of bias or influence for certain covariates on summary effect
esti-mates. Our objective was to explore the difference in P
values obtained from standard meta-regression and per-mutation tests on a sample of trials for several covari-ates. This project was in effect an empirical exercise comparing two separate statistical techniques for
arriv-ing at P values. Another potential drawback of this
study was that at no point did the permutation test
change a significant P value to a non-significant one.
Even though we did not see this, this would be expected
since in most instances the permutation P value
exceeded the meta-regression values. It is conceivable that suchPvalue increases would result in a marginally
significant P value obtained with meta-regression to
become non-significant with permutation [4]. Also,
though Pvalues are often used to determine the
exis-tence of covariate-based effect modification, one should
be certain to complementP values with actual
differ-ences in the effects estimates to determine if changes in the effect are clinically significant. Further research could build upon the intersection of statistical and clini-cal significance in effect modification. Finally, the last
Table 4Allium sativumhigh-density lipoprotein (HDL) stepwise elimination: comparison of finalPvalues for final models using both large sample and permutation techniques
Model 2: participant level and intervention level covariates (N = 19) Meta-regression (t-distribution),Pvalue Permutation test,Pvalue
Mean age of participants 0.003 0.003
Baseline HDL of control group < 0.001 < 0.001
Heterogeneity (I2) 45.8%
Table 5Allium sativumtriglyceride (TG) stepwise elimination: comparison of finalPvalues for final models using both large sample and permutation techniques
Model Meta-regression (t-distribution),Pvalue Permutation test,Pvalue
1. Methodological covariates (N = 22):
Appropriate blinding 0.033 0.047
Heterogeneity (I2) 98.1%
2. Participant level and intervention level covariates (N = 17):
Length of trial 0.001 0.003
Control group TG baseline 0.008 0.016
Dose of garlic 0.031 0.036
drawback of this research was that data from eight trials for the SJW depression pairing were extracted from Cochrane reviews [31,32]. Therefore, any errors in extraction in the Cochrane review will result in errors in our extractions and the resulting data analyses we present.
Conclusions
In summary, given that systematic reviews frequently contain a small number of studies and often wish to explore the influence of covariates to explain heteroge-neity, the permutation test may help to protect against spurious findings when using meta-regression. However, the changes in significance level we found for the per-mutation test in the sample of trials we included were small. Furthermore, the relationship between the magni-tude of statistical heterogeneity, events per variable and meta-regression with permutation-based resampling should be explored in future research.
Acknowledgements
JJG was supported by a Canadian Institutes of Health Research postdoctoral fellowship at the time that this research was carried out.
Author details
1Department of Orthopaedic Surgery, University of Michigan, Ann Arbor, MI,
USA.2Department of Epidemiology, University of Michigan, Ann Arbor, MI, USA.3Clinical Epidemiology Program, Ottawa Health Research Institute,
Ottawa, Ontario, Canada.4Department of Epidemiology & Community
Medicine, Faculty of Medicine, University of Ottawa, Ottawa, Ontario, Canada.
5Leslie Dan Faculty of Pharmacy, University of Toronto, Toronto, Ontario,
Canada.6Health-Policy Management and Evaluation, Faculty of Medicine, University of Toronto, Toronto, Ontario, Canada.7Clinical Epidemiology and
Biostatistics, McMaster University, Hamilton, Ontario, Canada.
Authors’contributions
JJG conceived of the study design, performed all data extractions and data analysis and wrote the manuscript. JB conceived of the study design and helped write and edit the manuscript. DM aided in the study design and helped edit the manuscript. HB aided in the study design and helped edit the manuscript. CB aided in the study design and helped edit the manuscript. All authors read and approved the final manuscript.
Competing interests
The authors declare that they have no competing interests.
Received: 28 October 2011 Accepted: 23 February 2012 Published: 23 February 2012
References
1. Higgins JPT, Thompson SG:Quantifying heterogeneity in a meta-analysis. Statist Med2002,21:1539-1558.
2. Cochrane Handbook for Systematic Reviews of Interventions of interventions 5.0.0.Edited by: Higgins JPT, Green S [http://www.cochrane-handbook.org].
3. Pildal J, Hrobjartsson A, Jorgensen KJ, Hilden J, Altman DG, Gotzsche PC:
Impact of allocation concealment on conclusions drawn from meta-analyses of randomized trials.Int J Epidemiol2007,36:847-857. 4. Higgins JPT, Thompson SG:Controlling the risk of spurious findings from
meta-regression.Statist Med2004,23:1663-1682.
5. Huang Y, Xu H, Calian V, Hsu JC:To permute or not to permute. Bioinformatics2006,22:2244-2248.
6. Gagnier JJ, Rochon PA, Boon H, Barnes J, Moher D, Bombardier C, for the CONSORT Group:Improving the reporting of randomized controlled trials of herbal medicine interventions: an application of the CONSORT statement.Ann Intern Med2006,144:364-367.
7. Linde K, ter Riet G, Hondras M, Melchart D, Willich SN:Characteristics and quality of systematic reviews of acupuncture, herbal medicines and homeopathy.Forsch Komplmentarmed Klass Natureheilkd2003,10:88-94. 8. Gagnier JJ, DeMelo J, Boon H, Rochon P, Bombardier C:Quality of
reporting of randomized controlled trials of herbal medicine interventions.Am J Med2006,119:800.
9. Concato J, Peduzzi P, Holfold TR, Feinstein AR:Importance of events per independent variable in proportional hazards analysis. I. Background, goals, and general strategy.J Clin Epidemiol1995,48:1495-1501. 10. Peduzzi P, Concato J, Feinstein AR, Holfold TR:Importance of events per
independent variable in proportional hazards regression analysis. II. Accuracy and precision of regression estimates.J Clin Epidemiol1995,
48:1503-1510.
11. Peduzzi P, Concato J, Kemper E, Holfold TR, Feinstein AR:A simulation study of the number of events per variable in logistic regression analysis.J Clin Epidemiol1996,49:1373-1379.
12. The Cochrane Collaboration:The Cochrane Manual Issue 4, 2008.[http:// www.cochrane.org/admin/manual.htm].
13. Jadad AR, Moore RA, Carroll D, Jenkinson C, Reynolds DJ, Gavaghan DJ, McQuay HJ:Assessing the quality of reports of randomized clinical trials: is blinding necessary?Control Clin Trials1996,17:1-12.
14. Cochrane Handbook for Systematic Reviews of Interventions 4.2.6.
Edited by: Higgins JPT, Green S [http://www.cochrane-handbook.org]. 15. Cochran WG:The combination of estimates from different experiments.
Biometrics1954,10:101-129.
Table 6 Results of final stepwise models relative to number of trials per variable and statistical heterogeneity ranked by number of trials per variable in the final models
Model TPV I2 Large samplePvalue for the final model PermutationPvalue for final model
Allium sativumTG: model 1 22 98.1% 0.033 0.047
Hypericum perforatumHAM-D: model 1 22 81% 0.035 0.041
Allium sativumHDL: model 2 9.5 45.8% 0.003 0.003
Allium sativumHDL: model 2 9.5 45.8% < 0.001 < 0.001
Hypericum perforatumHAM-D: model 2 8 79% 0.021 0.022
Hypericum perforatumHAM-D: model 2 8 79% 0.041 0.045
Allium sativumTG: model 2 5.7 87% 0.031 0.036
Allium sativumTG: model 2 5.7 87% 0.001 0.003
Allium sativumTG: model 2 5.7 87% 0.008 0.016
This table represents the final models for standard large sample techniques, the statistical heterogeneity in the final model, and number of trials included in the final model and thePvalues for both the standard large sample techniques compared to the permutation-based resamplingPvalues. Model 1 refers to the stepwise model for methodological covariates. Model 2 refers to the stepwise model for the participant level and intervention level covariates.
16. Whitehead A, Whitehead J:A general parametric approach to the meta-analysis of randomised clinical trials.Stat Med1991,10:1665-1677. 17. Moher D, Tetzlaff J, Tricco AC, Sampson N, Altman DG:Epidemiology and
reporting characteristics of systematic reviews.PLoS Med2007,4:e78. 18. Higgins J, Thompson S, Deeks J, Altman D:Statistical heterogeneity in
systematic reviews of clinical trials: a critical appraisal of guidelines and practice.J Health Serv Res Policy2002,7:51-61.
19. Petittie DB:Approaches to heterogeneity in meta-analysis.Stat Med2001,
20:3625-3633.
20. Xu H, Platt RW, Luo Z, Wei S, Fraser WD:Exploring heterogeneity in meta-analyses: needs, resources and challenges.Paediatr Perinat Epidemiol2008,
21:18-28.
21. Schmid CH, Stark PC, Berlin JA, Landais P, Lau J:Meta-regression detected associations between heterogeneous treatment effects and study-level, not patient-level, factors.J Clin Epi2004,57:683-697.
22. Flack V, Change PC:Frequency of selecting noise variables in subset regression analysis: a simulation study.Am Stat1989,41:84-86. 23. Freedman LS, Pee D:Return to a note on screening regression equations.
Am Stat1989,43:279-282.
24. Freedman LS, Pee D, Midthune DN:The problem of understanding the residual error variance in forward stepwise regression.Statistician1992,
41:405-412.
25. Berlin JA, Antman EM:Advantages and limitations of metaanalytic regressions of clinical trials data.Online J Curr Clin Trials1994,4:134. 26. Davey Smith G, Egger M, Phillips AN:Meta-analysis: beyond the grand
mean?BMJ1997,315:1610-1614.
27. Lau J, Ioannidis JP, Schmid CH:Summing up evidence: one answer is not always enough.Lancet1998,351:123-127.
28. Thompson SG, Higgins JPT:How should meta-regression analyses be undertaken and interpreted?Stat Med2002,21:1559-1574.
29. Kunz R, Vist GE, Oxman AD:Randomisation to protect against selection bias in healthcare trials.Cochrane Database Syst Rev2007,2:MR000012. 30. Verhagen AP, De Bie RA, Lenssen AF, de Vet HC, Kessels AG, Boers M, van
den Brandt PA:Impact of quality items on study outcome.Int J Technol Assess Healthcare2000,16:1136-1146.
31. Linde K, Mulrow CD, Berner M, Egger M:St John’s Wort for depression. Cochrane Database Syst Rev2005,2:CD000448.
32. Linde K, Mulrow CD, Berner M, Egger M:St John’s Wort for depression. Cochrane Database Syst Rev2008,4:CD000448.
doi:10.1186/2046-4053-1-18
Cite this article as:Gagnieret al.:An empirical study using permutation-based resampling in meta-regression.Systematic Reviews20121:18.
Submit your next manuscript to BioMed Central and take full advantage of:
• Convenient online submission
• Thorough peer review
• No space constraints or color figure charges
• Immediate publication on acceptance
• Inclusion in PubMed, CAS, Scopus and Google Scholar
• Research which is freely available for redistribution