R E G U L A R A R T I C L E
Relationship between lifestyle and lifestyle-related factors
in a rural–urban population of Japan
Shi-chen Zhang•Chang-nian Wei•Koichi Harada•Kimiyo Ueda•
Kumiko Fukumoto• Hiroshi Matsuo•Keiko Minamoto•Takeshi Nishikawa•
Eiichi Araki• Atsushi Ueda•Jun Fang
Received: 8 June 2011 / Accepted: 14 October 2012 / Published online: 17 November 2012
ÓThe Japanese Society for Hygiene 2012
Abstract
Objective To clarify the actual state of residents’ lifestyle in a mixed rural–urban area in Japan, and to investigate the relationship between residents’ lifestyle and lifestyle-rela-ted factors.
Methods The Japanese version of Health Promoting Lifestyle Profile-II (HPLP-II), lifestyle-related factors developed through group work with residents of Town A, and demographic variables were used to evaluate 1176 community residents’ lifestyles and associated factors.
Results Factor analysis revealed that there were 4 factors related to healthy lifestyle. Nonparametric analysis revealed that female and elderly groups showed higher
overall HPLP-II score than male and young groups. A significant correlation coefficient was seen between scores of overall HPLP-II and lifestyle-related factors (r=0.611,
p\0.001). Multiple linear regression analysis demon-strated that HPLP-II was significantly associated with each lifestyle-related factor, showing a similar order in both gender and age groups. Finally, covariance structure anal-ysis demonstrated that the score of health cognition and regional factors increased the score of HPLP-II, which then increased the score of self-rated health.
Conclusions The present research clarified the actual state of residents’ lifestyles by age and gender in a mixed rural–urban area in Japan, demonstrating a vector model from health cognition and regional factors to self-rated health, via residents’ lifestyle.
Keywords Quality of lifeSelf-rated health HPLP-II Lifestyle-related factors
Introduction
Lifestyle-related diseases, aside from being induced by age, originate from our daily routines such as eating behavior, exercise, sleeping, smoking, and alcohol con-sumption, based on housework, employment, and social contact. Therefore, to prevent lifestyle-related diseases, it is crucial to adopt a proper lifestyle [1,2].
In addition, people’s view of health is also being restructured. The sense of satisfaction from living life is becoming more important compared with treatment and prevention of disease, which was the traditional health view. According to the World Health Organization charter (WHO, 1946), the most widely accepted definition of health is ‘‘a state of physical, mental and social S. Zhang (&)J. Fang (&)
School of Public Health, Anhui Medical University, Hefei, Anhui, China
e-mail: melody0724978@yahoo.co.jp
J. Fang
e-mail: fangjun@ph.sojo-u.ac.jp
S. ZhangC. WeiK. FukumotoH. MatsuoK. Minamoto A. Ueda
Department of Preventive and Environmental Medicine, Graduate School of Medical Sciences,
Kumamoto University, Kumamoto, Japan
K. HaradaK. Ueda
Graduate School of Medical Sciences, Kumamoto University, Kumamoto, Japan
T. NishikawaE. Araki
Department of Metabolic Medicine, Graduate School of Medical Sciences, Kumamoto University, Kumamoto, Japan
J. Fang
well-being’’ (WHO, 1946). Following the WHO concept, ‘‘A state where self-realization is achieved as in Maslow’s theory of human motivation’’ [3] and ‘‘holistic health’’ [4] have been recognized as specific concepts of health. Especially, the latter concept is defined as a condition where lifestyles are well controlled and not merely lack any mental and physical abnormalities. Those two concepts indicate that health is the most important resource to maintain good daily life, i.e., quality of life (QOL), and not the ultimate object for each life [5].
Based on the aforementioned changes in disease struc-ture and health views, it is becoming increasingly impor-tant to provide support to regional populations to help establish and maintain healthy lifestyle. It is therefore necessary to focus on lifestyle as a fundamental measure for prevention of lifestyle-related diseases [6]. This means that a healthy life needs to be well controlled by an appropriate lifestyle, which will, in turn, lead to improved QOL. Even though lifestyle is an issue of self-responsi-bility, its improvement by individual endeavor alone is difficult. Therefore, it is necessary to provide a suitable social environment and professional support to help people acquire the necessary knowledge to promote changes in behavior and establish a healthy lifestyle. This is now a well-known philosophy of health promotion proposed by the WHO [7].
Health promotion is defined as a process which enables people to increase control over the determinants of health, and thereby improve health. To reach a state of complete physical, mental, and social well-being, an individual or group must be able to identify and realize aspirations, satisfy needs, and change or cope with the environment [8]. In recent years, health promotion has been accepted as an effective means to promote health and increase levels of well-being [9].
As stated by the WHO (1986), health promotion includes encouraging healthy lifestyles, creating supportive environments for health, strengthening community action, reorienting health services, and building public health policies. In this sense, health promotion is neither disease prevention nor a method to measure disease or health problems. In fact, health promotion aims to achieve higher QOL and seeks to understand the significance of individual growth and health management [10]. Health promotion is not a behavior that focuses on disease or health problem prevention, but is an approach that helps individuals grow and change in the right direction [11].
Those viewpoints on health indicate that, to practice effective health promotion, we should firstly clarify the actual state of residents’ lifestyle and determine regional factors regulating residents’ lifestyles in an object area. From this viewpoint, we conducted a questionnaire survey to clarify the actual state of residents’ lifestyles and to
determine the relationship between lifestyle and health-related factors in a general population in Japan, as part of the creation of a framework for a health promotion project. For the present survey we adopted various batteries, such as an authorized questionnaire to evaluate residents’ life-styles, a newly developed questionnaire on lifestyle-related factors, derived from group work of our colleagues and regional residents, to determine factors regulating resi-dents’ lifestyle, and one of the factors of self-rated health as a factor directly relating to QOL.
Materials and methods
We participated in a project of Town A which was con-ducted to form an action plan together with the Healthy Japan 21 project in order to create a healthy town (along with a movement proposed by the Japanese Ministry of Health, Labor, and Welfare in 2000). The first step in the project was to conduct a questionnaire survey and to clarify the actual state of self-rated health, lifestyle, and lifestyle-related factors among the residents of Town A.
Structure of the questionnaire
Many measuring tools can be used to investigate health-promoting lifestyle; however, most address only a single aspect of health-promoting lifestyle [12,13]. Among those, the Health-Promoting Lifestyle Profile (HPLP) [14] is a well-used statistical method that measures and evaluates health-promoting practices. HPLP-II is an upgraded ver-sion of HPLP, which has been extensively used in health promotion research [15] and has been reported by various groups to be a valid and reliable method to explore deter-minants and the actual state of health-promoting lifestyle [9,16–18].
respectively [19]. A principal axis factor analysis supported the presence of the six factors used as subscales [15].
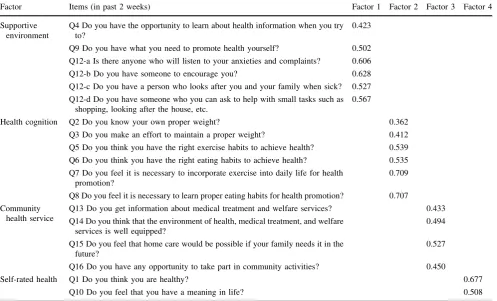
To determine lifestyle-related factors in Town A, a total of 50 members for a group work were organized together with residents of Town A, requiring public sector staffs, and colleague participants. The final questionnaire was composed of a cover sheet and some demographic data (job, age, and gender), HPLP-II, and questions relating to lifestyle-related factors, with a total of 18 items derived from the group work (Table1). Each respondent was asked to rate each item on a Likert response scale as follows: 0=no, 1=I don’t know, 2=yes.
Data collection and sampling
Town A is a mixed rural–urban society with 26000 total population, 19.0 % of which consists of individuals involved in agriculture (4.4 % for the nationwide average), and cultivation of vegetables in greenhouses is a major activity. A total of 3141 Town A residents aged 18–64 years, 20 % of the corresponding population in Town A, was selected randomly from a list of registered residents using a table of random digits from the book of Statistical Tables and Formulas with Computer
Applications (JSA-1972, pp. 418–427, 1972), and a ques-tionnaire with an informed consent form was sent to each. A total of 1270 (40.4 %) questionnaires were used for this study after discarding incomplete questionnaires. Finally, among those, 1176 were valid. The subjects were divided into two age groups: a young group (18–49 years) and an elderly group (50–64 years). The reason for this grouping was as follows: In the present analysis, the 50 %-ile of the age distribution of the present samples was shown to be 47–48 years, and the overall score of HPLP-II showed significant difference when comparing the age groups of 18–49 and 50–64 years (p\0.001). Furthermore, accord-ing to the report of Breslow et al. [21], the mean score of health status of community residents in their follow-up samples was for 50–55 years. So, we divided the samples into two groups using the age cutoff of 50 years.
Ethical considerations
This study was conducted after obtaining informed consent from all subjects and approval from the ethics committee of Kumamoto University Faculty of Life Sciences (approval number 408). The study was in accordance with the Dec-laration of Helsinki.
Table 1 Factor analysis of lifestyle-related items related to individual life and community environment
Factor Items (in past 2 weeks) Factor 1 Factor 2 Factor 3 Factor 4
Supportive environment
Q4 Do you have the opportunity to learn about health information when you try to?
0.423
Q9 Do you have what you need to promote health yourself? 0.502
Q12-a Is there anyone who will listen to your anxieties and complaints? 0.606
Q12-b Do you have someone to encourage you? 0.628
Q12-c Do you have a person who looks after you and your family when sick? 0.527
Q12-d Do you have someone who you can ask to help with small tasks such as shopping, looking after the house, etc.
0.567
Health cognition Q2 Do you know your own proper weight? 0.362
Q3 Do you make an effort to maintain a proper weight? 0.412
Q5 Do you think you have the right exercise habits to achieve health? 0.539
Q6 Do you think you have the right eating habits to achieve health? 0.535
Q7 Do you feel it is necessary to incorporate exercise into daily life for health promotion?
0.709
Q8 Do you feel it is necessary to learn proper eating habits for health promotion? 0.707
Community health service
Q13 Do you get information about medical treatment and welfare services? 0.433
Q14 Do you think that the environment of health, medical treatment, and welfare services is well equipped?
0.494
Q15 Do you feel that home care would be possible if your family needs it in the future?
0.527
Q16 Do you have any opportunity to take part in community activities? 0.450
Self-rated health Q1 Do you think you are healthy? 0.677
Q10 Do you feel that you have a meaning in life? 0.508
Statistical analysis
Statistical analysis was performed using SPSS11.0 (Sta-tistical Package for the Social Sciences). A sample sum-mary was carried out for all surveys, and nonparametric analysis was performed according to age and gender. To clarify the relation between HPLP-II and lifestyle-related items related to HPLP-II, multiple linear regression anal-ysis and covariance structure analanal-ysis were performed.
To determine the reliability of the survey, Cronbach alpha analysis was performed. In addition, factor analysis for 18 items relating to lifestyle-related factors derived from the group work by a method for extraction of prin-cipal components was used to evaluate the validity of the survey via rotational transformation analysis. Items with characteristic value of 1 or higher and factor loading of 0.35 or higher were selected.
Results
Study outline
All 1176 participants, with mean age of 45.2±13.2 years, in this study were categorized by work type as follows: primary industry (agriculture, aquaculture, stockbreeding, dairy farming) 11.1 %, public sector employee 6.5 %, office worker 30.8 %, health service worker 5.0 %, student 5.0 %, house-wife 20.1 %, and other 20.4 %. Among the subjects, 43.5 % were male (mean age 45.4±13.1 years), 56.5 % were female (mean age 44.7±13.3 years), 54.3 % were young (18–49 years), and 45.7 % were elderly (50–64 years). Reliability of analysis
Cronbach alpha coefficients of internal consistency for the present study were computed as 0.92 for HPLP-II and 0.68 for the battery of regional factors on health and welfare. Factor analysis of health and welfare
As presented in Table1, factor analysis for 18 items of life-style-related factors revealed four factors: Supportive envi-ronment (6 items), Health cognition (6 items), Community health service (4 items), and Self-rated health (2 items). Differences in scores between gender and age groups for HPLP-II and lifestyle-related factors
by nonparametric analysis
Table2presents the scores of the six subscales of HPLP-II, including the overall score, and lifestyle-related factors, by gender and age groups. Females had significantly higher
HPLP-II scores than males in the overall score (p\0.001) and 5 subscales (p\0.01 each). No significant differences were found in PA (p =0.941) between males and females. In age group by gender was showed the similar order. Elderly females had significantly higher scores compared with the young group for the overall score (p\0.001) and 6 subscales (p\0.05 each).
With regard to lifestyle-related factors, females scored significantly higher than males in Supportive environment and Health cognition (p\0.001 each). However, no sig-nificant differences were found in Community health ser-vice (p=0.454) or Self-rated health (p=0.084) between males and females. The same results were found in age group by gender (Table2).
Multiple linear regression analysis
We verified that the evaluation of lifestyle by HPLP-II was indeed related to these lifestyle-related factors. This was determined from a single correlation (r=0.611,p\0.001) showing significant association.
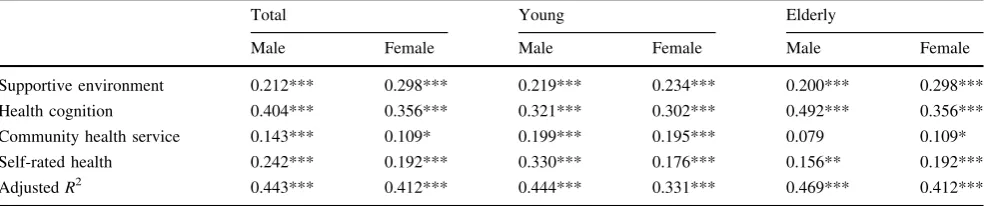
Table3presents results of the multiple linear regression analysis performed on overall HPLP-II, as a dependent vari-able, and 4 lifestyle-related factors, as independent variables, by gender and age groups. The model fitted well, indicating a significant high value ofR2(p\0.001 for each model);bis the standardized partial regression coefficient. The following features were identified in Table3:
The HPLP-II factor showed significant differences between genders. Health cognition was most strongly associated with males (b=0.404) and females (b = 0.356), followed by Self-rated health, Supportive environ-ment, and Community health service. In age group by gender was showed the similar order, except for HPLP-II and Community health service (b=0.079), which were not significantly associated with elderly males (Table3). Covariance structure analysis
Discussion
Study concept and validity
QOL is becoming increasingly important for evaluating an individual’s life. This has given rise to a recently devel-oped concept which holds health as the most important source of QOL [6]. Because QOL is defined as ‘‘the level needed to enjoy life’’ [22], health should also be defined as control and/or coping ability in various situations raised in one’s daily activity, not merely as a state of physical and mental health. In this regard, studies have shown that dis-ease incidence and progression are strongly associated with poor lifestyle, and that the degree of health is high among people of all ages who have a good lifestyle [23]. These findings strengthen the validity and reliability of the pres-ent study.
It should be noted, however, that QOL, lifestyle, and health are private issues that depend on individual endea-vor, self-determination, and self-responsibility to improve problem-solving skills. It is thus necessary to establish a
policy, system, or environment to guide people in the right direction through a network of expert support. In an effort to achieve this goal, a worldwide health promotion pro-gram was established by the WHO [22]. The foundations required to implement and execute an effective health promotion program include resident participation, expert assistance, and an appropriate policy that promotes these necessary measures. Therefore, to carry such a program forward, use of a comprehensive and collaborative study procedure based on qualitative and quantitative research techniques is necessary. These techniques include group work and creating a framework of the PRECEDE-PRP-CEED model to establish appropriate measures with the participation of people from the region [7].
The present survey was carried out utilizing the phi-losophy and technique of health promotion, in which res-idents were considered as research partners, and the study was undertaken in cooperation with the city’s administra-tive activities. Mostly, this study is a practice model that seeks to develop a healthy community, a process which has high practicality and validity.
Table 2 Scores from HPLP-II and lifestyle-related factors analyzed
Item (range of score) Male (N=512), mean±SD
Female (N=664), mean±SD
p Young male (N=268), mean±SD
Elderly male (N=224), mean±SD
Young female (N=371), mean±SD
Elderly female (N=293), mean±SD
v2
HPLP-II overall (1–4) 2.45±0.37 2.61±0.35 *** 2.42±0.37 2.48±0.37 2.55±0.32 2.69±0.37 77.116***
Health responsibility 2.20±0.51 2.44±0.53 *** 2.09±0.48 2.32±0.52 2.34±0.52 2.56±0.52 103.987***
Spiritual growth 2.59±0.54 2.68±0.53 ** 2.60±0.56 2.57±0.53 2.67±0.52 2.69±0.54 10.077*
Physical activity 1.82±0.60 1.81±0.59 ns. 1.82±0.59 1.82±0.62 1.71±0.51 1.93±0.65 20.187***
Interpersonal relationships 2.81±0.49 3.07±0.41 *** 2.83±0.49 2.79±0.50 3.07±0.40 3.08±0.43 91.123***
Nutrition 2.58±0.44 2.84±0.41 *** 2.48±0.44 2.69±0.41 2.73±0.39 2.97±0.38 174.692***
Stress management 2.67±0.47 2.76±0.49 *** 2.67±0.49 2.66±0.46 2.72±0.39 2.83±0.51 24.839***
Lifestyle-related factors (0–2)
Supportive environment 1.07±0.38 1.22±0.36 *** 1.07±0.36 1.08±0.40 1.20±0.35 1.25±0.37 48.129***
Health cognition 1.05±0.41 1.18±0.35 *** 1.01±0.38 1.09±0.43 1.14±0.34 1.22±0.35 43.745***
Community health service 1.05±0.45 1.07±0.44 ns. 1.05±0.45 1.06±0.46 1.05±0.43 1.10±0.44 2.545
Self-rated health 1.28±0.68 1.35±0.65 ns. 1.33±0.67 1.23±0.69 1.38±0.64 1.31±0.66 7.260
The results shown were obtained by nonparametric test. *p\0.05, **p\0.01, ***p\0.001
Table 3 Relationship between HPLP-II and lifestyle-related factors by multiple linear regression analysis
Total Young Elderly
Male Female Male Female Male Female
Supportive environment 0.212*** 0.298*** 0.219*** 0.234*** 0.200*** 0.298***
Health cognition 0.404*** 0.356*** 0.321*** 0.302*** 0.492*** 0.356***
Community health service 0.143*** 0.109* 0.199*** 0.195*** 0.079 0.109*
Self-rated health 0.242*** 0.192*** 0.330*** 0.176*** 0.156** 0.192***
AdjustedR2 0.443*** 0.412*** 0.444*** 0.331*** 0.469*** 0.412***
Scores shown are standardized partial regression coefficients (b).R2coefficient of determination
The questionnaire battery of HPLP-II used for this study had high internal consistency, with Cronbach alpha coef-ficient of 0.92, similar to the value obtained with the Jap-anese version [19]. Moreover, the questionnaire battery on lifestyle-related factors derived from the group work with residents of Town A was found to have a Cronbach alpha coefficient of 0.68, while the entire questionnaire had a coefficient of 0.91. These results verify that the presently developed questionnaire battery showed high stability and validity.
The subjects of the present study were selected from the most populous and representative area in Japan classified as a mixed rural–urban society by geographical location, age distribution, and industrial component. Then, the present study was performed by sending out questionnaires to a resident population in Town A, formed of 20 % of the residents in that area, by random sampling. The recovery rate for this survey was 40.4 %, with a valid answer rate of 94.6 %. As described in the results, the composition by age, gender, and occupation of the present subjects approximately reflected the demographic situation of Town A. Therefore, although the response rate was rela-tively low, the process of the present research indicated a relatively high level of consistency and reliability.
Interpretation of results
Regarding the association of gender with HPLP-II, females had higher scores for six subscales and the overall HPLP-II score. On the contrary, young females showed significantly lower scores in PA compared with other groups. These facts suggest that improvement of PA, especially for young females, might be the most critical problem in Town A, and also in Japanese community in general.
Regarding the overall score and all subscales of the HPLP-II, elderly females showed significantly higher scores compared with other groups. This result may be interpreted partly based on the consideration that elderly females tend to like health programs that are more inter-active, and prefer exercises that are not overly exhausting [24,25].
It was demonstrated that residents of the study area showed higher scores overall and on each subscale of HPLP-II compared with healthy populations in other areas, except for PA [19]. The previous study subjects were three selected groups, consisting of students, health service workers, and participants at a fitness center; in particular, the latter group had showed initiative to participate in physical exercise, so the PA score was higher than in the present study.
In addition, the present study subjects were community residents, consisting of agricultural workers, public sector Self-rated health
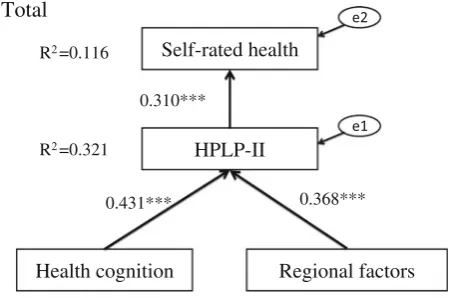
HPLP-II
Regional factors Health cognition
R2=0.321
R2=0.116
0.310***
0.431*** 0.368***
a
Total
Self-rated health
HPLP-II
Regional factors Health cognition
R2=0.314 R2=0.129
0.359***
0.512*** 0.228***
b
Male
Self-rated health
HPLP-II
Regional factors Health cognition
R2=0.257 R2=0.101
0.278***
0.439*** 0.254***
c
Female
employees, office workers, health service workers, stu-dents, and housewives. We previously reported on a dif-ference of HPLP-II scores between agricultural and nonagricultural workers using the same subjects as in the present study [17]. Because the items reflecting exercise in the questionnaires used were associated with jogging, swimming, or other formal sports, whereas for agricultural workers, exercise usually includes walking, doing house-work, and carrying out job-related activities, their scores may have been underestimated. However, the present research was not designed to analyze the difference in HPLP-II scores by occupational situation. We should conduct further research to analyze the difference of HPLP-II scores by occupation.
Regarding lifestyle-related factors, firstly we clarified by factor analysis that there were four factors related to resi-dents’ lifestyle. The same tendency as that of HPLP-II by age and gender was seen in those factors, namely females had higher scores for Health cognition, Supportive envi-ronment, Self-rated health, and Community health service, suggesting that these factors may be more beneficial for females, and may be used more effectively in females, especially elderly females, reflecting a difference of daily activity related to lifestyle pattern between males and females.
Next, we clarified that a significant relation was shown between the overall HPLP-II and lifestyle-related factors, as determined by a single correlation of r=0.611 (p\0.000). Then, we performed multiple linear regression analysis for a model by using overall HPLP-II as a dependent variable and lifestyle-related factors as explan-atory variables.
The multiple linear regression analysis demonstrated that HPLP-II was significantly associated with each factor, showing Health cognition to have the highest b-value, followed by Supportive environment, self-rated health, and Community health service, in that order, showing a similar order in both gender and age groups. This result is important when carrying out health-promotion planning in each community as there was a common factor existing to improve each lifestyle appropriately for all community members, regardless of age and gender.
Self-rated health has been recognized as the most important index regulating individual QOL level [26]. Therefore, we performed covariance structure analysis between health cognition, regional factors, HPLP-II, and self-rated health. The resulting vector model shown in Fig.1a–c suggests that health cognition together with regional factors act commonly on HPLP-II, which, in turn, impacts on self-rated health. This fact should be clarified, i.e., that individual’s cognition and regional factors are important influences via HPLP-II on self-rated health and QOL.
In summary, it is an essential concept that, when devising a health-promotion plan for Town A, consider-ation should be given to the differences in characteristics by gender, age, and occupation, although Health cognition, Supportive environment, Self-rated health, and Community health service should be adopted as common targets for improving geographical lifestyle-related factors.
Based on these results, we will try to make a framework for a health-promotion plan for Town A using the PRE-CEDE-PROCEED model.
Acknowledgments We would like to express our deep appreciation to the staff of the Health and Welfare Section of Town A Municipal Office, Kumamoto Prefecture, Japan, for their support in the present study. This study was undertaken as a part of a national model project (Health-Up model project of National Health Insurance, 2005–2007) by the Japanese Ministry of Health, Labor, and Welfare. This study was conducted as the collaborative project, Tabaruzaka study, between the Department of Metabolic Medicine and Preventive and Environmental Medicine, Graduate School of Medicine, Kumamoto University on the comprehensive prevention of lifestyle-related dis-eases. This study was supported by Grants for Scientific Research of BSKY (No. 0303025101) from Anhui Medical University.
Conflict of interest The authors declare that they have no conflicts of interest.
References
1. Morimoto K, Takeshita T. Lifestyle and lifestyle-related diseases. Jpn Med Assoc. 1999;12:865–71. (In Japanese).
2. Ezoe S, Morimoto K. Behavioral lifestyle and mental health status of Japanese factory workers. Prev Med. 1994;23(1):98–105. 3. Maslow AH. Theory of human motivation. Psychol Rev. 1943;
50:370–96.
4. Sonoda K, Kawada C. All human health. Tokyo: Shunjusha; 1984. (In Japanese).
5. WHO. Ottawa charter for health promotion. Health Promot Int. 1986;1:iii-v.
6. Sakurai H. Healthy Japan 21. JMAJ. 2003;46(2):47–9.
7. Green LW, Kreuter MW. Health promotion planning—an edu-cational and environmental approach. 3rd ed. Palo Alto: May-field; 1999.
8. Morimoto K. Adult disease prevention from lifestyle diseases: predictive medicine health. Gen Clin. 2000;49:2745–50. (In Japanese).
9. Fukumoto K, Wei CN, Matsuo H, Harada K, Zhang SC, Kalay L, et al. An intervention study to promote self-improvement of lifestyle in a Japanese community: a new health support program. Environ Health Prev Med. 2011;16(4):253–63.
10. Brubaker B. Health promotion: a linguistic analysis. ANS Adv Nurs Sci. 1983;5(3):1–14.
11. Pender NJ. Health promoting in nursing practice. 3rd ed. Norwalk: Appleton & Lange; 1996.
12. Thompson SN, Chambers JW. African self-consciousness and health-promoting behaviors among African American college students. J Black Psychol. 2000;26(3):330–45.
14. Walker S, Sechrist K, Pender N. The health-promoting lifestyle profile: development and psychometric characteristics. Nurs Res. 1987;36(2):76–81.
15. Walker S, Sechrist K, Pender N. The Health-Promoting Lifestyle Profile II. Omaha: University of Nebraska Medical Center, Col-lege of Nurs; 1995.
16. Braden CA, Cuthbert JP, Brenner L, Hawley L, Morey C, Newman J, et al. Health and wellness characteristics of persons with traumatic brain injury. Brain Inj. 2012;26(11):1315–27. 17. Zhang SC, Wei CN, Fukumoto K, Harada K, Ueda K, Minamoto
K, et al. A comparative study of health-promoting lifestyles in agricultural and non-agricultural workers in Japan. Environ Health Prev Med. 2011;16(2):80–9.
18. Eshah NF, Bond AE, Froelicher ES. The effects of a cardiovas-cular disease prevention program on knowledge and adoption of a heart healthy lifestyle in Jordanian working adults. Eur J Car-diovasc Nurs. 2010;9(4):244–53.
19. Wei CN, Yonemitsu H, Harada K, Miyakita T, Omori S, Ueda A, et al. A Japanese Language Version of the Health-Promoting
Lifestyle Profile. Jpn J Hyg. 2000;54(4):597–606. (In Japanese with English abstract).
20. Nakanishi N, Machiura M. Factors in health promotion behaviors of menopausal women. Jpn J Matern Health. 2008;48(4):514–21. 21. Lisa FB, Breslow L. Health and ways of living. The Alameda
County study. New York: Oxford University Press; 1983. 22. Clement M, Bouchard L, Jankowski L, Perreault M. Health
promotion behaviors in first year undergraduate nursing students. Can J Nurs Res. 1995;27(4):111–31.
23. Belloc L, Breslow L. Relationship of physical health status and health practices. Prev Med. 1972;1(3):409–21.
24. Robbins L, Pender N, Conn V, Freen M, Neuberger G, Nies MA, et al. Physical activity research in nursing. J Nurs Scholarsh. 2001;33(4):315–21.
25. Mufunda E, Albin B, Hjelm K. Differences in health and illness beliefs in zimbabwean men and women with diabetes. Open Nurs J. 2012;6:117–25.