R E S E A R C H A R T I C L E
Open Access
Retinal nerve fibre layer, ganglion cell layer and
choroid thinning in migraine with aura
Metin Ekinci
1*, Erdinç Ceylan
2, Halil Hüseyin Ça
ğ
atay
1, Sadullah Kele
ş
3, Nergiz Hüseyino
ğ
lu
4, Burak Tany
ı
ld
ı
z
5,
Özgür Çak
ı
c
ı
6and Baki Kartal
2Abstract
Background:The aim of this study was to investigate the thickness of the retinal nerve fiber layer (RNFL), the ganglion cell layer (GCL), and choroid thickness (CT) in patients who have migraines, with and without aura, using spectral optical coherence tomography (OCT).
Methods:Forty-five patients who had migraines without aura (Group 1), 45 patients who had migraines with aura (Group 2), and 30 healthy participants (control group) were included in the study. Spectral OCT was used to measure the RNFL, GCL and CT values for all patients.
Results:The mean age of Group 1, Group 2, and the control group was 34.6 ± 4.3, 32.8 ± 4.9, and 31.8 ± 4.6 years, respectively. The mean attack frequency was 3.6/month in Group 1 and 3.7/month in Group 2. The mean age among the groups (p = 0.27) and number of attacks in migraine patients (p = 0.73) were not significantly different. There was significant thinning in the RNFL and GCL in Group 2 (p < 0.05, p < 0.001 respectively), while there were no significant differences in RNFL and GCL measurements between Group 1 and the control group (p > 0.05). All groups were significantly different from one another with respect to CT, with the most thinning observed in Group 2 (p < 0.001). When all migraine patients (without grouping) were compared with the control group, there were significant differences on all parameters: RNFL thickness, GCC thickness and CT (p < 0.05).
Conclusions:RNFL and GCL were significantly thinner in the migraine patients with aura as compared with both the migraine patients without aura and the control subjects. In migraine, both with aura and without aura, patients’ choroid thinning should be considered when evaluating ophthalmological findings.
Keywords:Migraine with aura, Retinal nerve fiber layer thickness, Ganglion cell layer thickness, Choroid thickness, Optical coherence tomography
Background
Migraine is a disease presenting with an episodic head-ache capable of causing significant dysfunction, together with neurological, gastrointestinal, and autonomic changes, its pathogenesis is still unclear [1,2]. There are two syn-drome definitions related to migraine, namely with aura and without aura [3]. The migraine aura is a mixture of focal neurological symptoms that are seen prior to an at-tack, accompanying an atat-tack, and rarely after an attack. Most auras develop within 5–20 minutes, and generally last for less than 60 minutes. They may present as visual, sensory, and motor phenomena, and sometimes may affect
tongue and brain stem functions. Various vascular, neuro-vascular, hypoxic, cellular, hormonal, and genetic hy-potheses have been debated with respect to migraine pathogenesis [4]. Importantly, vasospasm in the occipital hemisphere in patients who have migraine with aura, and the subsequent reduction in the blood flow, is a major hypothesis in the explanation of visual aura and head-ache. In certain patients, vasospasm has been shown to occur in the tissues outside the brain, especially in the retina layer, concurrent with a reduction in brain blood flow [5,6]. There are various studies on the effects of vas-cular anomalies related to vasospasm and ischemia on the retina and optic nerve head [7]. Owing to techno-logical advances in recent years, the new-generation spectral domain OCT instruments that use improved
* Correspondence:drmetinekinci@gmail.com 1Ophthalmology, Univesity of Kafkas, Kars 36100, Turkey
Full list of author information is available at the end of the article
scanning speed and special software techniques (EDI) en-able the acquisition of high-resolution images OCT [8], which can perform reproducible, non-invasive in vivo evaluations, has come into clinical use as an imaging method for evaluating the thickness of the optic nerve head, peripapillary RNFL, GCL, and choroid layers in various neuroophthalmologic diseases [9,10].
Although some studies have investigated the RNFL thickness in patients who have migraine with and with-out aura by using OCT and scanning laser polarimetry [1,2,11], there are no studies on the GCL and CT in these patients. The aim of the present study was to in-vestigate potential differences in RNFL, GCL, and CT between patients who have migraine with aura and pa-tients who have migraine without aura.
Methods
This observational, cross-sectional and multicenter study adhered to the tenets of the Declaration of Helsinki. It was approved by the local ethical committee (Kafkas
University, Human Ethics Committee, Meeting: 2011/5, Document No:28, Kars, Turkey) and written informed consent was obtained from all patients before they had been recruited into the study. A total of 90 patients (30 males and 60 females with a similar mean age) who were followed in the Neurology Department; were divided into 2 groups (Group 1: Migraine without aura; Group 2: Migraine with aura). Each group consisted of 15 males and 30 females. Thirty non-smoking hospital employee participants (10 males and 20 females) were included in the control group. The right eye of each par-ticipant was included in the study. The diagnosis of mi-graine with and without aura was made according to the 2004 guidelines of the International Headache Society [12]. Patients’detailed histories were recorded, and infor-mation about the frequency of migraine attacks, pain localization, age at onset, duration, and the presence of aura was obtained. The type of migraine was determined, and systemic comorbidities, presence of migraine in the family, and history of glaucoma were noted. All measure-ments involving migraine patients were performed dur-ing both pain- and attack-free periods.
Patient selection
One hundred and thirty-seven migraine patients were evaluated. Volunteers who had full vision (1.0 with or without correction) and who had normal ocular findings were included in the study. Forty-seven patients with myopia, central serous chorioretinopathy, retinitis pig-mentosa, angioid streaks, primary angle-closure glau-coma, choroidal neovascularization, and those who had previous eye surgery for disorders such as scleral buck-ling, diabetes mellitus and chronic hypertension (untreated or on Ht medication), patients who had been diagnosed
with Multiple Sclerosis, Parkinson’s disease, or Alzheimer’s disease and patients who smoked tobacco were excluded from the study.
Ophthalmologic examination
Full ophthalmologic evaluations, including best-correct visual acuity, slit-lamp biomicroscopy, Goldmann appla-nation tonometry, gonioscopy with a three mirror con-tact lens, and fundoscopy were performed. RNLF, GCL and CT measurements were performed using an OCT RTVue version 4.0 (Optovue®, USA), through undilated pupils (Figure 1). Only scans that reached signal strength of at least ≥6, which indicate a high quality scan, were accepted for analysis. Considering the diurnal variations in the CT of all participants, CT was measured from 5 extra-foveal points, and RNFL and GCL thickness were measured between 10 a.m. and 12 a.m. The RNFL and GCL measurements were made to cover an area with a diameter of 3.45 mm in the horizontal and vertical planes. The instrument used a retina cross line scanning pattern that included a 1024 A-scan and consisted of two 6-mm orthogonal lines. With the automatic reversal of the image, the chorioretinal interface becomes adja-cent with zero delay. The retina cross line scanning method consists of a mean of 32 patterns in 16 direc-tions, without eye tracking. CT measurements were taken perpendicularly from the outer edge of the retinal pigment epithelium to the choroid sclera boundary at the fovea, and at four more points that are located, re-spectively, 500 μm nasal to the fovea, 1000 μm nasal to the fovea, 500 μm temporal to the fovea, and 1000 μm temporal to the fovea. CT measurements were made by two masked physicians (EC, ME). The average of the two measurements was used for analysis; the differences between readings of the masked physicians were found to be within 10% of the mean.
Statistical analysis
The normal distribution of the data was checked using the Kolmogorov-Smirnov test. The non-parametric Kruskal-Wallis test for continuous data was used to compare the three groups.. Non-parametric post-hoc tests with Bonferroni correction were performed on data that had reached significance with the Kruskal-Wallis Test. Com-parisons between the two experimental groups were per-formed with a Mann Whitney U test. IBM SPSS for Windows Ver. 20.0 was used for the statistical analysis, and a p value <0.01 was considered significant.
Results
(p = 0.27). The mean time required for migraine diagnosis in Group 1 and Group 2 was 88.8 ± 12.5 months (66–114) and 85.3 ± 11.9 months (62–110), respectively. The mean attack frequency was 3.6/month in Group 1 and 3.7/month in Group 2. There was no significant difference in mean time required for migraine diagnosis and mean attack fre-quency between Group 1 and Group 2 (p = 0.53, p = 0.73; respectively) (Table 1).
All patients in Group 2 reported visual symptoms such as light flashes, light refraction, and black dots in the visual area.
When the groups were evaluated according to their median RNFL thickness, there were significant differ-ences between Group 1 and Group 2 regarding overall, superior, and inferior faces (p = 0.02, p = 0.04, p = 0.04, respectively). No significant differences were found be-tween Group 1 and the control group (p > 0.05 for all). On the other hand, there were significant differences
between Group 2 and the control group regarding all faces (p < 0.05 for all) except for the nasal face (p = 0.10) (Table 2).
When the groups were evaluated according to their median GCC thickness, there were significant differ-ences between Group 1 and Group 2 regarding both su-perior and inferior faces (p = 0.02, p = 0.003, respectively). While there were no significant differences between Group 1 and the control group (p = 0.36, p = 0.75; re-spectively), there were significant differences between Group 2 and the control group regarding both faces (p < 0.001 for both) (Table 2).
There were significant differences among all groups with respect to median CT values (p < 0.001 for all) (Table 2).
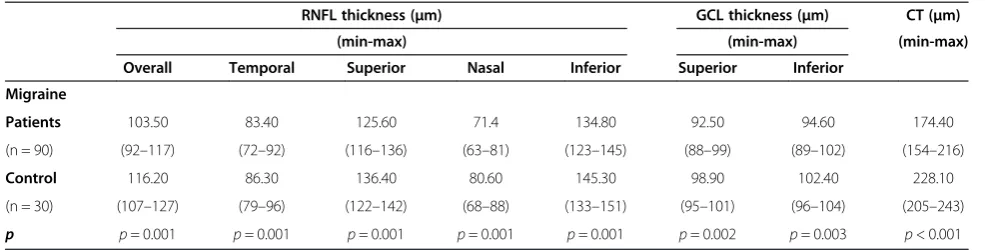
When comparing all migraine patients (without grouping) to the control group, we found significant dif-ferences on all parameters; RNFL thickness in overall (p = 0.001), temporal (p = 0.001), superior (p = 0.001), nasal (p = 0.001), and inferior (p = 0.001) faces; GCC thickness in the superior (p = 0.002) and inferior (p = 0.003) faces; and CT (p < 0.001) (Table 3).
Discussion
We investigated the correlations among RNLF, GCL, and CT values and migraine. When we collapsed the two migraine conditions and compared those patients to the control group, we found significant thinning of the RNLF, GCL and choroid in the migraine patients. When
Figure 1RNFL, choroid and ganglion cell layer thickness measurments using optical coherence tomography.A1, A2, A3: RNFL, choroid and ganglion cell layer thickness measurment of a patient in group 1. B1, B2, B3: RNFL, choroid and ganglion cell layer thickness measurment of a patient in group 2. C1, C2, C3: RNFL, choroid and ganglion cell layer thickness measurment of a patient in the control group.
Table 1 Demographic results of the three groups
N Average age Migraine diagnosed (months)
Mean attack frequency
Mean ± SD Mean ± SD per month
Group 1 45 34.6 ± 4.3 88.8 ± 12.5 3.6
Group 2 45 32.8 ± 4.9 85.3 ± 11.9 3.7
Control 30 31.8 ± 4.6 —————— ———————
P . p= 0.27 p= 0.53 p= 0.73
the patients were evaluated as subgroups of migraine with aura, without aura and a control group, there was a significant thinning of the RNLF, GCL and choroid in migraine patients with aura, but no significant differ-ences in RNLF and GCL measurements between mi-graine patients without aura and healthy subjects.
As far as we know, this is the first study to investigate the relationship between GCL, CT values and migraine.
Migraine is a chronic, progressive neurological dis-order with unknown etiology, and progresses with epi-sodic headache attacks [3]. The most common known event in migraine pathogenesis is vascular dysregulation (vasospastic diathesis) [13]. The neurovascular system is the most affected system in this pathology. Studies have detected an increased risk for ischemic stroke in patients who had migraine with aura [14,15]. Vasospasm emer-ging prior to or during the pain has been considered to occur concurrently in tissues located outside the brain, and local infarctions, by extension, have been considered to lead to histopathological and functional disorders at the tissue level. Various studies related to the vas-cular theory have been carried out in recent years to demonstrate changes in the retinal layer [5,6]. Killer et al.
demonstrated a reduction in blood flow in the lower tem-poral artery in a patient who had a visual area defect in the left eye during a migraine attack [16]. According to another hypothesis, the vasoconstrictive metabolites that join the systemic circulation during a migraine attack affect the ret-ina as a result of retrobulbar flow, thus reducing local blood flow [1]. Kara et al. used colored Doppler ultrason-ography and found a reduction in blood flow at the level of the central retinal artery and posterior ciliary artery in mi-graine patients, compared to healthy individuals [17].
Tan et al. [2] measured RNFL thickness in 15 patients who had migraine with aura and 24 patients who had migraine without aura using a scanning laser polarimetry instrument, and detected that there was no reduction in RNFL thickness in migraine patients compared to healthy individuals. On the other hand, although the method for measuring the retinal nerve fiber layer (RNFL) was differ-ent (Scanning Laser Polarimetry), Martinez et al.’s study results suggest a significantly difference between the mi-graine patients with aura and those without aura [11]. An-other of their anAn-other studies, Martinez et al. [1] used OCT to measure the RNFL, and determined that the mean RNFL thickness in migraine patients was similar to
Table 2 Median OCT analysis results of the three groups
RNFL thickness (μm) GCL thickness (μm) CT (μm)
(min-max) (min-max) (min-max)
Overall Temporal Superior Nasal Inferior Superior Inferior
Group 1 112.40 89.60 130.20 75.40 140.20 97.55 96.25 191.70
(101–117) (76–92) (122–136) (69–81) (131–145) (93–99) (96–102) (174–216)
Group 2 103.45 81.20 122.30 72.80 133.60 93.40 96.10 168.40
(92–107) (72–86) (116–128) (63–77) (123–138) (88–96) (89–98) (154–190)
Control 116.20 86.30 136.40 80.60 145.30 98.90 102.40 228.10
(107–127) (79–96) (122–142) (68–88) (133–151) (95–101) (96–104) (205–243)
RNFL: Retinal nerve fiber layer. GCL: Ganglion cell layer. CT: Choroid thickness. SD: Standard Deviation. p: Significance.
RNFL: Group 2 < Group 1 = Group Control.
GCL: Group 2 < Group 1 = Group Control.
CT: Group 2 < Group 1 < Group Control.
Table 3 Median OCT analysis results of the migraine and control groups
RNFL thickness (μm) GCL thickness (μm) CT (μm)
(min-max) (min-max) (min-max)
Overall Temporal Superior Nasal Inferior Superior Inferior
Migraine
Patients 103.50 83.40 125.60 71.4 134.80 92.50 94.60 174.40
(n = 90) (92–117) (72–92) (116–136) (63–81) (123–145) (88–99) (89–102) (154–216)
Control 116.20 86.30 136.40 80.60 145.30 98.90 102.40 228.10
(n = 30) (107–127) (79–96) (122–142) (68–88) (133–151) (95–101) (96–104) (205–243)
p p= 0.001 p= 0.001 p= 0.001 p= 0.001 p= 0.001 p= 0.002 p= 0.003 p< 0.001
that of healthy individuals, while only the thickness of the temporal quadrant RNFL was reduced in patients com-pared to the control group. Gippono et al. [18] found no difference in the foveal thickness and macular volume in female migraine patients compared to healthy women, but determined that there was a significant thinning in the RNFL thickness in the upper quadrant in the female mi-graine patients. In the present study, the thinning of the RNFL and GCL was detected only in patients who had migraine with aura. It is possible that Tan et al. obtained different results because they used a scanning laser polar-imetry instrument to measure the RNFL thickness. On the other hand, Gipponi et al. may have obtained different re-sults because they did not classify the patients according to the presence of aura. Several studies have emphasized that cerebral hypoperfusion, which occurs most com-monly in the posterior region of one hemisphere during the aura period [1], and the risk of ischemic stroke, cardiac diseases, intracerebral hemorrhage and mortality, in-creases in migraine patients with aura [15]; the pathogenic mechanism might be endothelial and vascular smooth muscle dysfunction and hypercoagulability [19]. Different studies have shown that neurodegenerative changes occur secondary to the subclinical ischemic lesions that form after hypoperfusion [14,15] . Moreover, some studies have reported a thinning in RNFL measurements in neurode-generative diseases such as multiple sclerosis, Alzheimer’s disease, and Parkinson’s disease [20-22]. In light of our findings in the present study, we propose that the thinning of the RNFL is a secondary event to the neurodegenerative changes in the central nervous system after ischemia in the migraine patients with aura.
The choroid is the vascular compartment of the eye. It supplies oxygen and nutrients to the outer retina. The major blood supply to the retina is the choroid, espe-cially in darkness, where 90% of the oxygen comes from choroidal circulation [23]. In the literature, Bourke et al. defined the correlation between untreated systemic hypertension and choroidopathy [24], Regatieri et al. de-fined CT in diabetic retinopathy and suggested that CT was associated with retinal tissue hypoxia [25], and Stei-gerwalt et al. and Sızmaz et al. reported a decrease in CT in patients who smoked cigarettes, due to the in-crease in vascular resistance of the vessels [26,27]. Ac-cording to the before-mentioned studies, migraine is known to be a neurovascular disease, and is known to reduce the blood flow at the level of the central retinal artery and posterior ciliary artery; the thinning of the choroid layer is an expected clinical outcome in mi-graine patients. Similarly, we found choroidal thinning in patients who had migraine both with aura and with-out aura.
Our study had some limitations. First, we did not grade migraine severity as was done in the Martinez
et al. study. Second, we did not have access to brain MRIs to support our theory and to show ischemic changes in migraine with aura, because ethical commit-tee disallowed this procedure.
Overall, a structurally and functionally normal retinal and choroidal vasculature is essential for the function of the retina: abnormal choroidal blood volume and/or compromised flow can result in photoreceptor dysfunc-tion and death [28]. Changes in retinal and choroidal blood flow may be important in retinal and choroideal pathologies.
Conclusion
We report the correlations among RNLF, GCL, and CT values and migraine with aura. Further investigation with a larger number of cases might provide more information about the relationship between retinal-choroidal patholo-gies and migraine with aura.
Competing interests
The authors declare that they have no competing interests.
Authors’contributions
Conceived and designed the study: ME, EC. Acquisition of data: HHÇ, NH. Analysis and interpretation of data: ME, EC, SK. Drafting the manuscript: ME, EC, BT, ÖÇ. Revising the manuscript critically for important intellectual content: BK. All authors read and approved the final manuscript.
Acknowledgements
We thank Barbara Reid for editing our manuscript as a native speaker. She had no role in study design, data collection and analysis, decision to publish, or preparation of the manuscript.
No commercial relationship exists for any of this article’s authors in the form of financial support or personal financial interest.
Author details 1
Ophthalmology, Univesity of Kafkas, Kars 36100, Turkey.2Ophthalmology, Erzurum Training and Research Hospital Ophthalmology Clinic, Erzurum, Turkey.3Ophthalmology, University of Atatürk, Erzurum, Turkey.4Neurology, University Of Kafkas, Kars 36100, Turkey.5Department of Ophthalmology,
Istanbul University, Istanbul Faculty of Medicine,İstanbul, Turkey.
6Ophthalmology, University of Muğla SıtkıKoçman, Muğla, Turkey.
Received: 13 November 2013 Accepted: 20 May 2014 Published: 31 May 2014
References
1. Martinez A, Proupim N, Sanchez M:Retinal nerve fibre layer thickness measurements using optical coherence tomography in migraine patients.Br J Ophthalmol2008,92:1069–1075.
2. Tan FU, Akarsu C, Güllü R:Retinal nerve fiber layer thickness is unaffected in migraine patients.Acta Neurol Scand2005,112:19–23.
3. Marror MF, Zrenner E:Standard for clinical electroretinograpy 1994 update.Doc Ophtalmol1995,89:199–210.
4. Totan Y, Çekiç O:Görme ile ilgili elektrofizyolojik testler ve klinik uygulamaları. (Vision-related Electrophysiological tests and their clinical applications.MN Oftalmol1996,3:195–198.
5. Beversdof D, Stommel E, Allen C, Stevens R, Lessel S:Recurrent branch retinal infarcts in association with migraine.Headache1997,37:396–399. 6. Killer HE, Forrer A, Flammer J:Retinal vasospasm during an attack of
migraine.Retina2003,23:253–254.
7. Solomon S, Grosberg BM, Friedman DI, Lipton RBJ:Retinal migraine.
J Neuroophthalmol2007,27:243–244.
8. Manjunath V, Taha M, Fujimoto JG, Duker JS:Choroidal thickness in normal eyes measured using Cirrus-HD optical coherence tomography.
9. Christiensen GS, Kylstra JA:A comparative study of the predicted postoperative visual acuity using the PAM and the Heine retinometer. InARVO Abstract Book.; 1993.
10. Xu W, Yao K, Shentu X:The comprasion of two methods to predict the postoperative visual acuity of cataractous patients.Zhonghua Yan Ke Za Zhi 2001,37:121–124.
11. Martinez A, Proupim N, Sanchez M:Scanning laser polarimetry with variable corneal compensation in migraine patients.Acta Ophthalmol 2009,87:746–753.
12. The Headache Classification Subcommittee of the International HeadacheSociety:The International classification of headache disorders (2nd edn).Cephalalgia2004,24(Suppl 1):1–160S.
13. Wang JJ, Mitchell P, Smith W:Is there an association between migraine headache and open-angle glaucoma? Findings from the blue mountains eye study.Ophthalmology1997,104:714–719.
14. Kurth T, Slomke MA, Kase CS, Cook NR, Lee IM, Gaziano JM, Diener HC, Buring JE:Migraine, headache, and the risk of stroke in women: a prospective study.Neurology2005,64:1020–1026.
15. Sacco S, Ricci S, Carolei A:Migraine and vascular diseases: a review of the evidence and potential implications for management.Cephalalgia2012,
32:785–795.
16. Sorkhabi R, Mostafaei S, Ahoor M, Talebi M:Evaluation of retinal nerve fiber layer thickness in migraine.Iran J Neurol2013,12:51–55. 17. Kara SA, Erdemoğlu AK, Karadeniz MY, Altinok D:Color Doppler
sonography of orbital and vertebral arteries in migraineurs without aura.
J Clin Ultrasound2003,31:308–314.
18. Gipponi S, Scaroni N, Venturelli E, Forbice E, Rao R, Liberini P, Padovani A, Semeraro F:Reduction in retinal nerve fiber layer thickness in migraine patients.Neurol Sci2013,34(6):841–845.
19. Larrosa-Campo D, Ramón-Carbajo C, Para-Prieto M, Calleja-Puerta S, Cernuda-Morollón E, Pascual J:Migraine as a vascular risk factor.Rev Neurol 2012,55:349–358.
20. Galetta KM, Calabresi PA, Frohman EM, Balcer LJ:Optical coherence tomography (OCT): imaging the visual pathway as a model for neurodegeneration.Neurotherapeutics2011,8:117–132.
21. Kirbas S, Turkyilmaz K, Anlar O, Tufekci A, Durmus M:Retinal nerve fiber layer thickness in Alzheimer disease.J Neuroophthalmol2013,33:58–61. 22. Kirbas S, Turkyilmaz K, Tufekci A, Durmus M:Retinal nerve fiber layer
thickness in Parkinson disease.J Neuroophthalmol2013,33:62–65. 23. Linsenmeier RA, Braun RD:Oxygen distribution and consumption in the
cat retina during normoxia and hypoxia.J Gen Physiol1992,99:177–197. 24. Bourke K, Patel MR, Prisant LM, Marcus DM:Hypertensive choroidopathy.
J Clin Hypertens (Greenwich)2004,6:471–472.
25. Regatieri CV, Branchini L, Carmody J, Fujimoto JG, Duker JS:Choroidal thickness in patients with diabetic retinopathy analyzed by spectral-domain optical coherence tomography.Retina2012,32:563–568. 26. Steigerwalt RD Jr, Laurora G, Incandela L, Cesarone MR, Belcaro GV,
De Sanctis MT:Ocular and orbital blood flow in cigarette smokers.
Retina2000,20:394–397.
27. Tamaki Y, Araie M, Nagahara M, Tomita K, Matsubara M:The acute effects of cigarette smoking on human optic nerve head and posterior fundus circulation in light smokers.Eye (Lond)2000,14:67–72.
28. Shiragami C, Shiraga F, Matsuo T, Tsuchida Y, Ohtsuki H:Risk factors for diabetic choroidopathy in patients with diabetic retinopathy.Graefes Arch Clin Exp Ophthalmol2002,240:436–442.
doi:10.1186/1471-2415-14-75
Cite this article as:Ekinciet al.:Retinal nerve fibre layer, ganglion cell
layer and choroid thinning in migraine with aura.BMC Ophthalmology
201414:75.
Submit your next manuscript to BioMed Central and take full advantage of:
• Convenient online submission
• Thorough peer review
• No space constraints or color figure charges
• Immediate publication on acceptance
• Inclusion in PubMed, CAS, Scopus and Google Scholar
• Research which is freely available for redistribution