chemotactic migration of mouse bone
marrow-derived stromal cells
Ryan
et al.
Ryanet al. Stem Cell Research & Therapy (2015) 6:136
R E S E A R C H
Open Access
ROCK activity and the G
βγ
complex mediate
chemotactic migration of mouse bone
marrow-derived stromal cells
Caroline M. Ryan
1,2†, James A. L. Brown
1,2,3†, Emer Bourke
4, Áine M. Prendergast
1,2,5, Claire Kavanagh
1,
Zhonglin Liu
6, Peter Owens
7, Georgina Shaw
1, Walter Kolch
2, Timothy O
’
Brien
1,2and Frank P. Barry
1,2*Abstract
Introduction:Bone marrow-derived stromal cells (BMSCs), also known as mesenchymal stem cells, are the focus of intensive efforts worldwide to elucidate their function and biology. Despite the importance of BMSC migration for their potential therapeutic uses, the mechanisms and signalling governing stem cell migration are still not fully elucidated.
Methods:We investigated and detailed the effects of MCP-1 activation on BMSCs by using inhibitors of G protein-coupled receptor alpha beta (GPCRαβ), ROCK (Rho-associated, coiled-coil containing protein kinase), and PI3 kinase (PI3K). The effects of MCP-1 stimulation on intracellular signalling cascades were characterised by using immunoblotting and immunofluorescence. The effectors of MCP-1-mediated migration were investigated by using migration assays (both two-dimensional and three-dimensional) in combination with inhibitors.
Results:We established the kinetics of the MCP-1-activated signalling cascade and show that this cascade correlates with cell surface re-localisation of chemokine (C motif) receptor 2 (CCR2) (the MCP-1 receptor) to the cell periphery following MCP-1 stimulation. We show that MCP-1-initiated signalling is dependent on the activation ofβγsubunits from the GPCRαβγcomplex. In addition, we characterise a novel role for PI3Kγ signalling for the activation of both PAK and ERK following MCP-1 stimulation. We present evidence that the Gβγcomplex is responsible for PI3K/Akt, PAK, and ERK signalling induced by MCP-1 in BMSCs. Importantly, we found that, in BMSCs, inhibition of ROCK significantly inhibits MCP-1-induced chemotactic migration, in contrast to previous reports in other systems.
Conclusions:Our results indicate differential chemotactic signalling in mouse BMSCs, which has important implications for the translation of in vivo mouse model findings into human trials. We identified novel components and interactions activated by MCP-1-mediated signalling, which are important for stem cell migration. This work has identified additional potential therapeutic targets that could be manipulated to improve BMSC delivery and homing.
Introduction
Bone marrow-derived stromal cells (BMSCs), also known as mesenchymal stem cells (MSCs), have generated much interest in recent years. Critical properties that contribute to the tissue regenerative capacity of BMSCs include their
ability to differentiate into selected cell types, their ability to secrete paracrine factors, and their migratory capacity, which is central to their ability to contribute to a repair response [1–3]. However, the cellular mechanics and chemotactic signalling events that guide BMSCs to their appropriate microenvironments have not been fully eluci-dated. Fully understanding these mechanisms will advance the therapeutic utility of BMSCs, improving methods for systemic delivery by enhancing efficiency of hom-ing to target tissues. Although it has been previously reported that human BMSCs migrate in response to the chemokine, monocyte chemoattractant protein 1 * Correspondence:[email protected]
†Equal contributors 1
Regenerative Medicine Institute (REMEDI), Biosciences, National University of Ireland Galway, University Road, Galway, Ireland
2
Systems Biology Ireland, UCD Conway Institute, University College Dublin, Belfield, Dublin 4, Ireland
Full list of author information is available at the end of the article
(MCP-1) [4, 5], the precise mechanisms remain to be completely elucidated. Furthermore, it was shown that MCP-1 migration is mediated by chemokine (C motif) re-ceptor 2 (CCR2) and the adapter molecule Pericentrin-1 (Nup85, FROUNT) [6, 7]. However, the kinetics of CCR2 activation and the downstream pathways involved remain unclear.
Chemotaxis is initiated when chemokines bind to transmembrane receptors, leading to the release of the Gα and Gβγ subunits from the Gαβγ complex of G protein-coupled receptors (GPCRs) [8, 9]. The selective activation of distinct pathways suggests that the GPCRs bind G proteins and additional effectors. Previously, it was demonstrated that Pericentrin-1 binds activated CCR2, linking it to the PI3 kinase (PI3K)-Rac-lamelli-podium cascade [7]. However, it is unresolved whether these signalling events are likewise involved in the chemotactic response of BMSCs. Additionally, RhoGT-Pase family members and the Rho kinase ROCK (Rho-associated, coiled-coil containing protein kinase), which are important mediators of polarisation and migration in many cells types, remain to be confirmed in BMSCs [10–15]. Here, we evaluate the role of ROCK, GPCR, and PI3K signalling events which mediate the chemo-tactic migration of BMSCs. Using a combination of migration assays, high-resolution imaging, and pharma-cological inhibitors, we have explored the critical medi-ators and order of signalling in MCP-1-mediated BMSC migration.
Methods
Cell culture
BMSCs were isolated from 8- to 10-week-old BalbC mice. Marrow was flushed from femurs and tibiae and plated directly onto plastic. BalbC BMSCs were maintained in modified Eagle’s medium-α (MEM-α) GlutaMAX™ (Life Technologies, Carlsbad, CA, USA) supplemented with 10 % fetal bovine serum (HyClone, part of GE Healthcare, Little Chalfont, UK), 10 % equine serum (HyClone), 1 % L-glutamine, and 1 % penicillin-streptomycin. Cells were seeded at a density of 5.7×10³ cells/cm2, and all experi-ments were performed by using BMSCs at passages 4–8. Human MSCs were aspirated under sterile conditions from the iliac crests of healthy human volunteers. The obtained marrow was filtered with a 70-μm cell strainer (Falcon, part of Thermo Fisher Scientific, Waltham, MA, USA) before centrifuging at 400×g for 10 min. Cell pellets were resuspended in media consisting of MEM-α(Gibco, part of Invitrogen, Carlsbad, CA, USA), supplemented with 10 % fetal bovine serum (Gibco) and 1 % antibiotics (streptomycin and penicillin) (Gibco), and cultured in 175-cm2flasks at 37 °C in a humidified atmosphere con-taining 5 % CO2. At day 4, the cultures were washed with
phosphate-buffered saline to remove the non-adherent
cells and further expanded until more than 80 % conflu-ence, when they were harvested and expanded in 175-cm2 flasks. After subculture, these cells were designated as pas-sage 1.
BMSCs were characterised by their ability to differenti-ate into chondrocytes, adipocytes, and osteoblasts and were confirmed to be CD105-, CD73-, Sca1-, CD29-, CD44-positive and CD34-, CD45-, and CD31-negative, as previously described [16]. BMSCs were cultured in serum-free conditions for 2 h prior to pre-treatment with either the CCR2 antagonist: 10 μM RS102895 (Sigma-Aldrich, St. Louis, MO, USA), 10 μM Anti-BetaGamma (MPS-Phosducin-like protein C terminus) (AnaSpec, Fremont, CA, USA) or the PI3K inhibitor: 5μM LY294002 (Merck, Kenilworth, NJ, USA). For two-dimensional (2D) migration assays, BMSCs were cultured in serum-free con-ditions overnight prior to assays. BMSCs were pre-treated with ROCK inhibitor (10 μM Y27632; Sigma-Aldrich) in combination with serum-free conditions for 24 h.
All work (both human and animal related) was ap-proved by the Animal Ethics Committee, National University of Ireland, Galway, and conducted under li-cense from the Department of Health, Ireland. Human MSCs were obtained and purified in accordance with the described protocol (above) from fully informed and con-senting patients as approved by the Animal Ethics Com-mittee, National University of Ireland, Galway. All animal experiments were conducted in compliance with the
“Principles of Laboratory Animal Care”formulated by the National Society for Medical Research and the“Guidelines for the Care and Use of Laboratory Animals”prepared by the National Academy of Science, which was published by the National Institutes of Health (ISBN 0-309-05377-3, revised 1996).
Migration assays
medium were seeded into the upper wells of the Cell Invasion and Migration plate, and recombinant mouse MCP-1 in serum-free medium was added to the lower wells. Lower wells containing either 0 % (negative) or 10 % (positive) serum were included as controls. 2D mi-gration was assessed by using the μslide chemotaxis2D system (ibidi, Martinsried, Germany) in the presence of a stable linear chemoattractant gradient established over 3 h in accordance with the instructions of the manufacturer. Cells from the 2D migration were visual-ized as indicated below.
Immunofluorescence
BMSCs were seeded onto glass slides and cultured for 48 or 24 (2D chemoattraction assays) h prior to the indi-cated treatments. BMSCs were exposed to 20 ng/ml MCP-1 at 37 °C for the indicated times and fixed in 4 % paraformaldehyde. Cells were permeabilised with 0.1 % TritonX100 for 30 min, unless otherwise indicated. Fixed cells were blocked with 5 % BSA (Sigma-Aldrich) and stained with the following antibodies: anti-CCR2 antibody ([E68] ab32144; Abcam, Cambridge, UK), antiPericentrin-1 antibody (Santa Cruz Biotechnology, Dallas, TX, USA), or mouse monoclonal anti αtubulin (T5168; Sigma-Aldrich). Bound antibodies were detected by using the appropriate secondary antibody: Cy3-labeled anti-rabbit antibody (Jackson ImmunoResearch Europe, Newmarket, Suffolk, UK), FITC labeled anti-goat IgG antibody (Santa Cruz Biotechnology), or Dylight 488labeled anti-mouse antibody. F-Actin was detected by using Rhodamine-conjugated phalloidin (Sigma-Aldrich). Isotype controls were mouse and rabbit (Thermo Fisher Scientific). Slides were mounted with slowfade gold antifade reagent with 4′,6-diamidino-2-phenylindole (DAPI) (Invitrogen). Z-stack images were captured by using an Andor Revolution spinning disk confocal microscope (Andor, Belfast, North-ern Ireland, including an Olympus inverted IX 81 micro-scope, Olympus, Tokyo, Japan, 40× or 60× oil immersion objective lenses with an Andor iXonEM+EMCCD camera). Z-stack images were processed by using Andor IQ 2.3 software, and images were presented as maximum inten-sity projections.
Immunoblotting
BMSCs were cultured for 48 h, serum-depleted, and treated with the inhibitors as indicated. Whole cell ly-sates were prepared by using RIPA buffer containing a protease inhibitor cocktail (Roche, Basel, Switzerland) with an additional 100 mM phenylmethylsulfonyl fluor-ide (PMSF) and 100 mM NA3VO4 (Sigma-Aldrich).
Whole cell lysates were separated by SDS-PAGE, and proteins were transferred to polyvinylidene difluoride (PVDF) (Immobilon, EMD Millipore Corporation, Billerica, MA, USA) membranes in accordance with the instructions
of the manufacturer. Membranes were blocked with 5 % skim milk powder and incubated overnight at 4 °C with the indicated primary antibodies: phosphoAktSer473 (Cell Signaling Technology, Beverly, MA, USA), AKT (Cell Signaling Technology), phosphoERK1/2 (Cell Signal-ing Technology), ERK (Cell SignalSignal-ing Technology), phos-phoPAK1Ser199/204/phosphoPAK2Ser192/197 (Cell Signaling Technology), and PAK1/2/3 (Cell Signaling Technology). Membranes were incubated for 1 h at room temperature with a horseradish peroxidase-conjugated anti-mouse or anti-rabbit IgG secondary antibody (Jackson ImmunoRe-search Laboratories Inc., West Grove, PA, USA). Bound antibodies were visualized by using SuperSignal West Pico Chemiluminescent substrate Thermo Fisher Scientific (Waltham, MA, USA), and the band intensities were quantified by using AlphaView software (FluorChem sys-tems; ProteinSimple, San Jose, CA, USA).
Viability and cytotoxicity assay
Effect of serum-free medium (SFM) treatment, alone or in combination with the indicated inhibitors, on BMSC viability and cytotoxicity was assayed by using the ApoTox-Glo™ Triplex Assay (Promega Corporation, Madison, WI, USA) in accordance with the instructions of the manufac-turer, under the indicated conditions.
Statistical analysis
To avoid any bias, counts were recorded from multiple fields from the indicated number of independent cell culture preparations. Data analyses were performed by using Prism 5 software (GraphPad Software, Inc., La Jolla, CA, USA) or Microsoft Excel (Microsoft Corpor-ation, Redmond, WA, USA). Statistical significance was calculated with a one-way analysis of variance by using a Kruskal-Wallis test with apost hocDunn’s or Tukey test to evaluate the statistical significance between groups, unless otherwise indicated. A P value of less than 0.05 (*) was deemed significant,P value of less than 0.01 (**) very significant, and P value of less than 0.001 (***) highly significant, as stated in the figure legends. Counts of cell numbers represent at least three separate discrete experiments with more than 100 counts made for each separate independent experiment (n and minimum number measurements for each separate experiment are indicated in figure legends).
Results
BMSCs migrate in response to the chemokine MCP-1
extension) and an accumulation of α-tubulin at the F-actin-positive cell extension (Additional file 1: Figure S1). The remaining cells observed were characterised as non-polarised, non-migrating. As previously demonstrated [5, 18], MCP-1 induced significant migration (Fig. 1a and Additional file 2: Figure S2a) and polarisation (demon-strated by F-actin re-localisation) in serum-starved mouse BMSCs (Fig. 1b). In addition, a trend (non-significant) of MCP-1 inducing greater migration than the non-specific chemoattractant fetal calf serum (FCS) was observed. Interestingly, investigating the dose-dependent effects of MCP-1 exposure on migration, we found that 20 and 50 ng/ml MCP-1 induced significant migration, compared
with the non-specific chemoattractant fetal bovine serum or higher doses of MCP-1 (Additional file 2: Figure S2b). Subsequently, 20 ng/ml MCP-1 was used for all experi-ments. Supporting previous work demonstrating ex-pression of the MCP-1 receptor gene CCR2 [6, 19], MCP-1 induced significant migration in human BMSCs (Additional file 3: Figure S3a, b). However, in contrast to mouse BMSCs, no difference between FCS- and MCP-1-mediated migration in human BMSCs was ob-served. Although ROCK inhibitor Y27632 did not in-hibit human BMSC MCP-1-mediated migration, it did induce stellate morphology, indicating its effectiveness (Additional file 3: Figure S3a).
ROCK activity is required for MCP-1-mediated migration in mouse BMSCs
So far, the effect of ROCK inhibition on chemotactic-induced migration has not been examined in mouse BMSCs. Consistent with previous reports, Y27632 pre-treatment resulted in mouse BMSCs with a stellate morphology (Additional file 4: Figure S4a), characteristic of inhibited RhoA/ROCK signalling [20–22]. Further-more, MCP-1 treatment of Y27632 pre-treated cells did not affect this stellate morphology (Additional file 4: Figure S4a). To investigate the effects on chemotactic migration, BMSCs were cultured in the presence or ab-sence of the ROCK inhibitor, Y27632, for 24 h prior to exposure to an MCP-1 gradient in a 2D migration assay (Fig. 2a and Additional file 4: Figure S4b). We found that Y27632 pre-treatment of mouse BMSC resulted in a significant inhibition in MCP-1-induced migration in both a 3D (Fig. 2b) and 2D migration assay (Fig. 2c). Significantly, however, pre-treatment of human BMSCs with Y27632 did not inhibit MCP-1-mediated migration in the 2D assay (Fig. 2d). Interestingly, human BMSCs treated with Y27632 also displayed a stellate morph-ology (Additional file 3: Figure S3a, b).
MCP-1-dependent signalling in mouse BMSCs
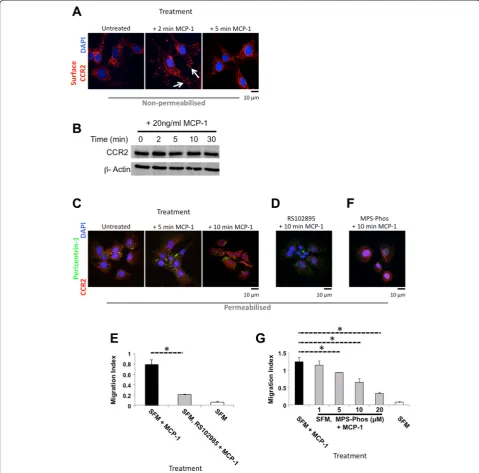
As chemotactic migration in mouse BMSCs was inhib-ited by Y27632 treatment, in contrast to previous mi-gration studies [12, 14, 20, 23–25], we characterised the MCP-1-dependent migration signalling pathway in mouse BMSCs. Investigating localisation of the extra-cellular MCP-1 receptor CCR2 (a member of the G protein-coupled receptor superfamily) on the surface of non-permeabilised untreated mouse BMSCs, we found that CCR2 displayed diffuse generalised cell sur-face staining (Fig. 3a). To support previous studies, we carried out a more detailed analysis, characterising the kinetics of this re-localisation. After 2 min of MCP-1 treatment, surface CCR2 re-distributed to the cell periphery and displayed a distinct punctate staining pattern (Fig. 3a, white arrows). Confirming a re-distribution of CCR2, we demonstrated no change in CCR2 levels fol-lowing MCP-1 treatment at the indicted time points (Fig. 3b).
To further examine MCP-1-dependent signalling, the CCR2 adaptor Pericentrin-1 (Nup85, FROUNT) [7] was investigated. After MCP-1 treatment, Pericentrin-1 was observed re-localising to the cell periphery (Fig. 3c). In addition, after 10 min of MCP-1 treatment, CCR2 staining in permeabilised BMSCs displayed peri-nuclear staining, as previously reported [6, 7] (Fig. 3c). Investigating the kinetics of Pericentrin-1 re-localisation, we found that this occurred swiftly, between 5 and 10 min after MCP-1 treat-ment (Fig. 3c).
MCP-1 signals migration through Pericentrin-1 and the
βγcomplex
To determine whether MCP-1 signalling required CCR2 activity, the CCR2 inhibitor (RS102895) [26] was employed. Inhibition of CCR2 activity abrogated the MCP-1-mediated re-localisation of CCR2 and Pericentrin-1 (Fig. 3d). This in turn led to a significant inhibition of MCP-1-mediated migration (Fig. 3e and Additional file 5: Figure S5a). To further probe the MCP-1-mediated signalling cascade, the role of GPCRs was investigated by using the cell-permeable peptide MPS-Phos, which sequesters the βγcomplex [27]. Pre-treating mouse BMSCs with MPS-Phos abolished MCP-1-dependent redistribution of both CCR2 and Pericentrin-1 (Fig. 3f). Consistent with CCR2 inhibition, pre-treatment with more than 5μM MPS-Phos resulted in significant inhibition of MCP-1-mediated migration (Fig. 3g and Additional file 5: Figure S5b).
MCP-1-dependent PI3Kγsignalling
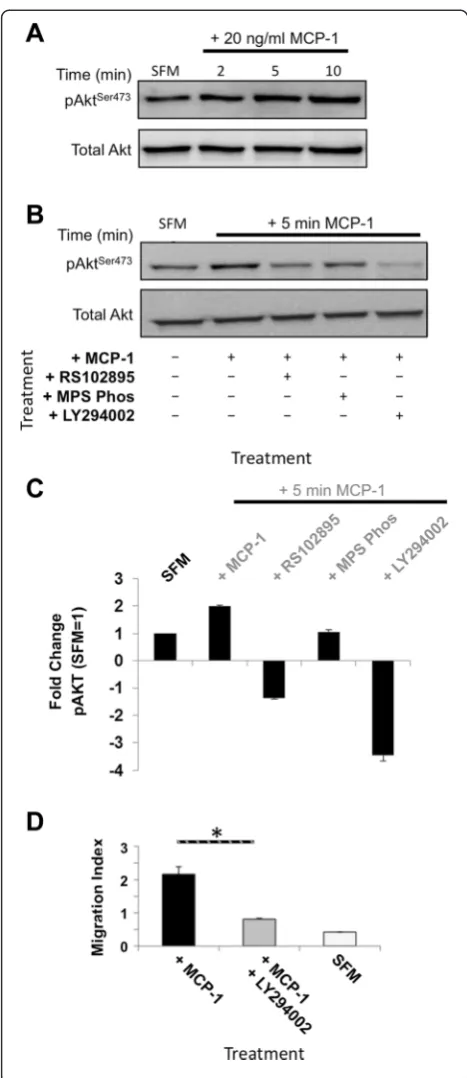
To determine whether MCP-1-mediated migration re-quired signalling though PI3K in mouse BMSCs, phos-phorylation of the PI3K target AKT was examined. After MCP-1 treatment, a time-dependent increase in PI3K-dependent AktSer473phosphorylation was observed (Fig. 4a, b). Quantification revealed that MCP-1 treatment induced a two-fold increase in phosphorylated AktSer473 (pAktSer473) (Fig. 4c, where phosphorylated AktSer473levels following 24 h SFM media set to 1). Furthermore, combining RS102895 pre-treatment and MCP-1 resulted in a marked decrease in pAktSer473. Interestingly, pre-treatment with MPS-Phos before MCP-1 treatment did not significantly effect pAktSer473levels, indicating that the βγ complex signals though an alternate pathway following MCP-1 treatment. To further dissect this signalling cascade, we employed the PI3K inhibitor, LY294002. Mouse BMSCs pre-treated with LY294002 had no MCP-1-induced phosphorylation of AktSer473 and indeed had
pAkt-Ser473
levels that were barely detectable (Fig. 4b, c). This reduction in pAktSer473led to a de-sensitization of BMSCs to the effects of MCP-1, resulting in a significant inhibition of MCP-1-induced migration (Fig. 4c and Additional file 5: Figure S5c).
The MCP-1 signalling cascade requires ERK1 phosphorylation to induce migration
Fig. 3CCR2 and GPCRβγactivity is required for MCP-1-mediated migration.aSurface CCR2 re-localises after MCP-1 treatment. Immunofluorescent staining of non-permeabilised serum-starved BMSCs, following the indicated treatments at the indicated times. CCR2 (red).α-tubulin (green). DNA stained with DAPI (blue). Scale bar = 10μm.bImmunoblotting of BMSC whole cell lysates for CCR2 andβ-actin following MCP-1 treatment; 100μg of total cell extract/lane. Representative blot of three separate independent experiments is shown.cKinetics of Pericentrin-1 re-localisation after MCP-1 treatment. Immunofluorescent staining of permeabilised serum-starved BMSCs. CCR2 (red) and Pericentrin-1 (green). DNA stained with DAPI (blue). Scale bar = 10μm.dSerum-starved BMSCs pre-treated with 10μM RS102895 (βγGPCR subunit inhibitor) and stained after exposure to MCP-1. CCR2 (red).α-tubulin (green). DNA stained with DAPI (blue). Scale bar = 10μm.e24-h treatment with 10μM RS102895 combined with serum starvation inhibits MCP-1-mediated BMSC migration in 3D. Graph represents three separate independent experiments. Data are presented as mean ± SD. fMCP-1-mediated Pericentrin-1 re-localisation is inhibited by 24-h pre-treatment with 10μM MPS-Phos (GPCRβγinhibitor) and SFM. Permeabilised BMSCs stained with CCR2 (red) andα-tubulin (green). DNA stained with DAPI (blue). Scale bar = 10μm.gCombination of serum-starved BMSCs with a GPCRβγinhibitor (10μM MPS-Phos) for 24 h significantly reduced MCP-1-mediated migration in 3D. Graph represents three separate independent experiments. Data are presented as mean ± SD. APvalue of less than 0.05 (*) was deemed significant.3Dthree dimensions,BMSCbone marrow-derived stromal cell,CCR2chemokine (C motif) receptor 2,DAPI4′,6-diamidino-2-phenylindole,GPCRG protein-coupled receptor,
To further explore this signalling cascade, we evaluated the effect on PAK1Ser199/204and PAK2Ser192/197 phosphorylation
by combining the previously described inhibitors (RS102895, MPS-Phos, LY294002, and Y27632; Figs. 2, 3, and 4) and MCP-1 treatment (Fig. 5a, b, right side). We found that PI3K (LY294002) and ROCK (Y27632) inhibition led to a noticeable decrease in MCP-1-induced PAK2Ser192/197 phosphorylation (Fig. 5a). Following this trend, both CCR2 and GPCR βγ inhibition also reduced the MCP-1 induc-tion of PAK2Ser192/197phosphorylation, although quantifica-tion revealed that this was not statistically significant (Fig. 5b). Importantly, we found that 24-h SFM treatment alone, or in combination with the inhibitors, did not significantly affect BMSC viability or cytotoxicity or induce apoptosis (Additional file 6: Figure S6).
ERK and PAK activation is required for MCP-1 stimulated migration
To further investigate the consequences of induced (acti-vation of ) PAK1 and PAK2 signalling, we explored the effects of MCP-1 treatment on the downstream mole-cules extracellular signal-regulated protein kinases 1 and 2 (ERK1/2). BMSCs pre-treated with SFM were exposed to MCP-1, and the kinetics of ERK1 and 2 phosphoryl-ation (pERK1/2) were investigated (Fig. 5c). After 5 min of MCP-1 treatment, there was a marked increase in pERK1, which had almost entirely diminished by 30 min after treatment (Fig. 5c, d, left side). Interestingly, pERK2 was also strongly increased at 2 min after MCP-1
Fig. 4MCP-1-induced migration is dependent on GPCRβγsubunit and PI3K activity.aKinetics of MCP-1-mediated AKT signalling. Immunoblotting for phosphorylated AktSer473and total Akt following serum-starved BMSCs exposed to MCP-1 for the indicated times; 100μg of total cell extract/lane. Representative blot of three separate independent experiments is shown.bDependence of the MCP-1 signalling cascade on CCR2 and PI3Kγactivity (inhibited by 24-h serum starvation combined with 10μM RS102895 and 10μM LY294002, respectively). Immunoblotting for pAktSer473and total Akt. Whole cell extracts prepared from serum-starved BMSCs pre-treated with the indicated inhibitors (10μM RS102895, GPCRβγsubunit inhibitor 10μM MPS-Phos, or 5μM PI3K inhibitor LY294002) for 24 h prior to MCP-1 exposure for the indicated time; 100μg of total cell extract/ lane. Representative blot of three separate independent experiments is shown.cDensitometric quantification of b (AktSer473phosphorylation). Untreated serum-starved BMSC AktSer473levels were set to 1. Graph represents three separate independent experiments. Data are presented as mean ± standard deviation.dPI3Kγactivity is required for MCP-1-induced BMSC migration in three dimensions. PI3Kγactivity inhibited by 24-h pre-treatment with 5μM LY294002. Graph represents three separate independent experiments. Data are presented as mean ± standard deviation. APvalue of less than 0.05 (*) was deemed significant.
Fig. 5PAK and ERK activation in response to MCP-1 is dependent on GPCRβγsubunit, PI3Kγ, and ROCK activity.aImmunoblotting for phosphorylation of PAK1Ser199/204and PAK2Ser192/197and total PAK1/2. Serum starvation of BMSCs in combination with 10μM RS102895, 10μM MPS-Phos, 5μM LY294002, or 10μM Y27632 for 24 h and exposed to MCP-1 for the indicated times; 100μg of total cell extract/lane. Representative blot of three separate independent experiments is shown.bDensitometric quantification of a (PAK1Ser199/204and PAK2Ser192/197phosphorylation). Untreated serum-starved BMSC PAK1Ser199/204and PAK2Ser192/197levels were set to 1. Graph represents three separate independent experiments. Data are presented as mean ± standard deviation.cImmunoblotting for phosphorylation of ERK1/2 and total ERK1/2 following serum-starved BMSCS was pre-treated with MCP-1 for the indicated times or with 10μM RS102895, 10μM MPS-Phos, 5μM LY294002, or 10μM Y27632 and exposed to MCP-1; 100μg of total cell extract/lane. Representative blot of three separate independent experiments is shown.dDensitometric quantification of c (ERK1/2 phosphorylation). Untreated serum-starved BMSC pERK1/2 levels were set to 1. Data are presented as mean ± standard deviation. Graph represents three separate independent experiments.
treatment, and mimicking pERK1, the pERK2 levels had returned to control levels by 30 min after treatment.
To explore the role of MCP-1 stimulation on this signal-ling cascade, we evaluated the effects of the previously described inhibitors (RS102895, MPS-Phos, LY294002, and Y27632; Figs. 2, 3, and 4) in combination with MCP-1 treatment. Accompanying the results of inhibition of pPAK1/2, we observed a reduction in the levels of pERK1/ 2 (Fig. 5c, d, right side). Supporting previous reports in human cells [28, 29], Y27632 pre-treatment combined with MCP-1 led to a decrease in pERK1/2. However, there are conflicting reports indicating that Y27632 did not affect phosphorylation of ERK1 and 2 in human leukocytes [30].
Discussion
The ability of stem cells to migrate provides the basis for the therapeutic treatment of a broad spectrum of condi-tions via systemic infusion of ex vivo preparations of stem cells. To maximize their therapeutic efficacy, an understanding of the various molecular mechanisms and signalling cascades mediating stem cell migration is essential [8, 31]. Furthermore, characterising the differ-ences in migration mechanisms between human and the model organism mouse is essential to allow results from
in vivo models to be accurately and meaningfully trans-lated into human trials.
Here, we have highlighted key differences in the way mouse BMSCs respond and signal in response to the key chemokine MCP-1 (Fig. 6). In addition, we have revealed previously unknown insights into the timing of these signalling cascades and characterised the key players in the cascades that facilitate mouse BMSC mi-gration in response to chemokines (Figs. 3, 4, and 5). Interestingly, we found that chemotactic migration of mouse BMSCs requires ROCK activity (Fig. 2), in con-trast to reports in other organisms (human, chicken, rat, and mouse) and cell types (glioma, mouse embry-onic fibroblast, chick embryembry-onic heart fibroblast, MSCs, and breast cancer) [12, 14, 20, 23–25]. Intri-guingly, our findings were supported by other studies but only in human cells [10, 28, 30, 32, 33]. Signifi-cantly, in response to MCP-1, ROCK-inhibited BMSCs were unable to migrate in a 3D assay and their ability to migrate in a 2D assay was also severely reduced (Fig. 2b, c). Interestingly, we found that BMSCs dis-played an MCP-1 dose-dependent inhibition of migra-tion (Addimigra-tional file 2: Figure S2b). This suggests the presence of a positive feedback loop mechanism, where lower concentrations of MCP-1 attract BMSCs and the higher concentrations encountered at the site of MCP-1 secretion result in a settling and retention of BMSCs. Indeed, the MCP-1 gradient used in our study would include the reported plasma levels of MCP-1 in healthy
individuals (0.1–0.7 ng/ml) [34–36]. Supporting this, we found that the majority of migrating cells were observed at the lower end of the MCP-1 gradient (data not shown). It is possible that acute exposure to MCP-1 alters the differentiation potential of BMSCs; how-ever, owing to the extremely short time frames investi-gated, additional experimentation would be required to confirm this.
To investigate the signalling cascades involved in mouse BMSC migration, we began with MCP-1 ligand binding and receptor activation and tracked this signal-ling, which ultimately results in cytoskeletal reorganisation and migration. We found that this sequence of events, including the clustering of Pericentrin-1, is entirely dependent on the release and activation of the βγ subunits from the Gαβγ receptor complex. This is supported by our findings thatβγ subunit activation is required for BMSC migration in response to MCP-1. Importantly, we demonstrate that the chemotactic mi-gration cascade is initiated with CCR2 re-localisation, supporting previous findings [37]. However, this activa-tion does not affect expression, particularly in such short time frames (Fig. 3).
Importantly, we defined the previously unknown kin-etics of this signalling cascade, and using specific inhib-itors we were able to characterise the key players in mouse BMSC chemotactic migration (Figs. 3, 4, and 5). We demonstrate that ROCK inhibition in BMSCs sig-nificantly retards migration which is likely through the observed disruption of ERK1/2 phosphorylation; how-ever, this remains to be verified directly by ERK1/2 in-hibition. This is a novel finding which is in contrast to a previous report of ROCK inhibition which, while inhi-biting chemotactic migration, did not affect ERK1/2 phosphorylation [30]. It is interesting to note that the underlying signalling was different, which may repre-sent a fundamental difference in the cell types (mouse BMSCs versus human leukocytes), chemokine (fMLP versus MCP-1) or receptor (FRP1 versus CCR2). Fur-ther work will need to focus on different chemokines that induce BMSC migration, such as transforming growth factor-beta, and determine whether they share common signalling pathways. Our work has highlighted the importance of determining whether these pathways are conserved in human BMSCs, which may impact on any therapeutic applications.
and migration by regulation of the downstream RhoGT-Pase, Rac. Activated Rac (RacGTP) then interacts with several downstream effectors, PAK being one of them, to coordinate cytoskeletal reorganization, lamellipodia formation, and resultant migration [39, 40]. Although active Rac (through ERK and PAK) and associated signalling is involved in orchestrating cytoskeletal dy-namics at the leading edge of the cell, Rho/ROCK has
largely been implicated in retraction at the rear of mi-grating cells [10, 30, 41, 42]. However, recent reports have confirmed that Rho/ROCK signalling is also active in lamellipodia [22, 43, 44].
Conclusions
Our findings advance our understanding of bone mar-row stromal (mesenchymal stem) cell biology and the
Fig. 6Proposed model of MCP-1-dependent signalling cascade in mouse BMSCs. Solid lines indicate direct interactions. Dotted lines indicate indirect actions.BMSCbone marrow-derived stromal cell,ERKextracellular signal-regulated kinase,MCP-1monocyte chemoattractant protein 1,
mechanisms orchestrating chemotactic migration. Using a systematic approach, we mapped additional compo-nents to the chemokine signalling pathway and provide additional novel data concerning the timing of these sig-nals (Fig. 6). Furthermore, for the first time, our work provides a detailed mechanistic analysis of motility signalling in BMSCs. This is significant, as increasing our knowledge of the chemokine-dependent signalling mechanisms essential for migration is undeniably re-quired to fully exploit any therapeutic applications. In addition, we define and highlight key areas where the model organism Mus musculus differs from humans, which may affect the translation of therapeutic applica-tions. Finally, we have described potential additional therapeutic targets in BMSCs that could be exploited to improve delivery, homing, and retention of BMSCs to sites of injury or disease.
Additional files
Additional file 1: Figure S1.Stages of BMSCs observed in culture. Permeabilised serum-starved BMSCs immunofluorescently stained with F-actin (red) andα-tubulin (green) and DNA counter-stained with DAPI (blue). Scale bar = 10μm. Representative BMSC stages observed are immotile, polarised, and actively motile. F-Actin filaments accumulate at the leading edge in polarised BMSCs. Actively motile BMSCs display an accumulation of F-Actin andα-tubulin at the cell edge orientated in the direction of movement. Isotype controls, mouse and rabbit (Thermo Fisher Scientific), demonstrate specificity of staining.BMSCbone marrow-derived stromal cell,DAPI4′,6-diamidino-2-phenylindole. (PNG 558 kb)
Additional file 2: Figure S2.MCP-1 induced significant BMSC migration. aImmunofluorescent images of representative fields of serum-starved (24 h) BMSCs migrating in response to a gradient of MCP-1 in a 2D assay. Permeabilised serum-starved BMSCs immunofluorescently stained with F-actin (red) andα-tubulin (green) and DNA stained with DAPI (blue). Scale bar = 30μm.bBMSC migration in response to the indicated MCP-1 concentrations in a 3D migration assay. Graph represents three separate independent experiments. Data are presented as mean ± SD. APvalue of less than 0.05 (*) was deemed significant.cRepresentative 3D migration assay results from serum-starved BMSCs exposed to the indicated conditions.
2Dtwo-dimensional,3Dthree-dimensional,BMSCbone marrow-derived stromal cell,DAPI4′,6-diamidino-2-phenylindole,MCP-1monocyte chemoattractant protein 1,SDstandard deviation. (PNG 571 kb)
Additional file 3: Figure S3.ROCK inhibition affects morphology and MCP-1-induced migration in mouse BMSCs. Permeabilised serum-starved BMSCs immunofluorescently stained with F-actin (red) andα-tubulin (green) and DNA counter-stained with DAPI (blue).aSerum-starved BMSCs polarise in response to MCP-1; 10μM Y27632 pre-treatment (24 h) results in a stellate morphology, with or without MCP-1 treatment. Scale bar = 10μm.bImmunofluorescent images of representative fields of serum-starved (24 h) BMSCs pre-treated with 10μM Y27632 and exposed to a gradient of MCP-1 in a 2D assay. Permeabilised serum-starved BMSC stained with F-actin (red) andα-tubulin (green) and DNA stained with DAPI (blue). Scale bar = 30μm.2Dtwo-dimensional,BMSCbone marrow-derived stromal cell,DAPI4′,6-diamidino-2-phenylindole,MCP-1monocyte chemoattractant protein 1,ROCKRho-associated, coiled-coil containing protein kinase. (PNG 1480 kb)
Additional file 4: Figure S4.Human BMSC chemotactic migration is unaffected by ROCK inhibition but does display the characteristic morphology.aSerum-starved human BMSCs polarise in response to MCP-1; 10μM Y27632 treatment results in stellate morphology in BMSCs, independent of MCP-1 treatment. Scale bar = 10μm.bROCK inhibition does not affect human BMSC migration in response to MCP-1.
Immunofluorescent images of representative fields of serum-starved (24 h) BMSCs pre-treated with 10μM Y27632 and exposed to a gradient of MCP-1 in a 2D assay. Permeabilised serum-starved BMSCs stained with F-actin (red) andα-tubulin (green) and DNA stained with DAPI (blue). Scale bar = 30μm.cQuantification ofb. Graph represents two separate independent experiments (>100 cells evaluated for each separate independent experiment). Data are presented as mean ± standard error of the mean. APvalue of less than 0.05 (*) was deemed significant, and a
P<0.001 (***) highly significant.2Dtwo-dimensional,BMSCbone marrow-derived stromal cell,DAPI4′,6-diamidino-2-phenylindole,MCP-1monocyte chemoattractant protein 1,ROCKRho-associated, coiled-coil containing protein kinase. (PNG 1175 kb)
Additional file 5: Figure S5.CCR2, GPCRβγsubunit and PI3K activity is required for MCP-1-induced BMSC migration.a-c3D migration of serum-starved BMSCs pre-treated with 10μM RS102895, 10μM MPS-Phos, 5μM LY294002, or 10μM Y27632 for 24 h prior to exposure to MCP-1. Representative migration traces shown of three separate independent experiments; 10 % fetal bovine serum included as a positive control.3Dthree-dimensional,BMSCbone marrow-derived stromal cell,CCRchemokine (C motif) receptor,GPCRG protein-coupled receptor,MCP-1monocyte chemoattractant protein 1,PI3KPI3 kinase. (PNG 273 kb)
Additional file 6: Figure S6.Inhibitors do not affect BMSC viability or cytotoxicity or induce apoptosis; 24-h serum starvation (SFM) of BMSCs alone or in conjunction with 10μM Y27632, 5μM LY294002, 10μM MPS-Phos, or 0.5μM Staurosporine. A very low dose of Staurosporine was included as a positive control for apoptosis. Untreated cells (cultured in normal media) were included as an untreated control. SFM set = 1. Graph represents three independent experiments. (Each individual experiment was performed in triplicate.) Data are presented as mean ± standard error of the mean. APvalue of less than 0.05 (*) was deemed significant, and aPvalue of less than 0.01 (**) very significant.BMSCbone marrow-derived stromal cell,
SFMserum-free medium. (PNG 360 kb)
Abbreviations
2D:Two-dimensional; 3D: Three-dimensional; BMSC: Bone marrow-derived stromal cell; CCR: Chemokine (C motif) receptor; ERK: Extracellular signal-regulated kinase; FCS: Fetal calf serum; GPCR: G protein-coupled receptors; MCP-1: Monocyte chemoattractant protein 1; MEM-α: Modified Eagle’s medium-α; MI: Migration index; MPS-Phos: MPS-phosducin-like protein C terminus; MSC: Mesenchymal stem cell; PAK: P21 Protein (Cdc42/Rac)-activated kinase 1; PI3K: PI3 kinase; Rac: Ras-related C3 botulinum toxin substrate 1; Rho: Rhodopsin; ROCK: Rho-associated, coiled-coil containing protein kinase; SFM: Serum-free medium.
Competing interests
The authors declare that they have no competing interests.
Authors’contributions
JB contributed to experimental design, collection and assembly of data, data analysis and interpretation, and manuscript writing. CR contributed to conception and design, collection and assembly of data, data analysis and interpretation, and manuscript writing. EB contributed to collection and assembly of data, data analysis and interpretation, and manuscript writing. AP contributed to collection and assembly of data and to data analysis and interpretation. CK and ZL contributed to collection of data. PO contributed to technical expertise and data analysis and interpretation. GS contributed to generation of MSCs. WK and TO contributed to conception and design and financial support. FB contributed to conception and design, final approval of manuscript, and financial support. All authors read and approve of the final version of the manuscript.
Acknowledgements
Author details
1
Regenerative Medicine Institute (REMEDI), Biosciences, National University of Ireland Galway, University Road, Galway, Ireland.2Systems Biology Ireland, UCD Conway Institute, University College Dublin, Belfield, Dublin 4, Ireland. 3Present address: Discipline of Surgery, School of Medicine, Lambe Institute, Translational Research Facility, National University of Ireland Galway, University Road, Galway, Ireland.4Discipline of Pathology, School of Medicine, National University of Ireland Galway, University Road, Galway, Ireland.5Present address: Hematopoietic Stem Cells and Stress’group, Division of Stem Cells and Cancer, Deutsches Krebsforschungszentrum (DKFZ), Im Neuenheimer feld 280, 69120 Heidelberg, Germany.6Department of Radiology, University of Arizona, Tucson, AZ 85724-5067, USA.7Centre for Micro and Imaging, National University of Ireland Galway, University Road, Galway, Ireland.
Received: 15 December 2014 Revised: 21 April 2015 Accepted: 7 July 2015
References
1. Barry FP, Murphy JM. Mesenchymal stem cells: clinical applications and biological characterization. Int J Biochem Cell Biol. 2004;36:568–84. 2. Chamberlain G, Fox J, Ashton B, Middleton J. Concise review: mesenchymal
stem cells: their phenotype, differentiation capacity, immunological features, and potential for homing. Stem Cells. 2007;25:2739–49.
3. Karp JM, Leng Teo GS. Mesenchymal stem cell homing: the devil is in the details. Cell Stem Cell. 2009;4:206–16.
4. Wang L, Li Y, Chen J, Gautam SC, Zhang Z, Lu M, et al. Ischemic cerebral tissue and MCP-1 enhance rat bone marrow stromal cell migration in interface culture. Exp Hematol. 2002;30:831–6.
5. Dwyer RM, Potter-Beirne SM, Harrington KA, Lowery AJ, Hennessy E, Murphy JM, et al. Monocyte chemotactic protein-1 secreted by primary breast tumors stimulates migration of mesenchymal stem cells. Clin Cancer Res. 2007;13:5020–7.
6. Belema-Bedada F, Uchida S, Martire A, Kostin S, Braun T. Efficient homing of multipotent adult mesenchymal stem cells depends on FROUNT-mediated clustering of CCR2. Cell Stem Cell. 2008;2:566–75. Elsevier.
7. Terashima Y, Onai N, Murai M, Enomoto M, Poonpiriya V, Hamada T, et al. Pivotal function for cytoplasmic protein FROUNT in CCR2-mediated monocyte chemotaxis. Nat Immunol. 2005;6:827–35.
8. Thelen M. Dancing to the tune of chemokines. Nat Immunol. 2001;2:129–34.
9. Jiménez-Sainz MC, Fast B, Mayor F, Aragay AM. Signaling pathways for monocyte chemoattractant protein 1-mediated extracellular signal-regulated kinase activation. Mol Pharmacol. 2003;64:773–82.
10. Fonseca A-V, Freund D, Bornhäuser M, Corbeil D. Polarization and migration of hematopoietic stem and progenitor cells rely on the RhoA/ROCK I pathway and an active reorganization of the microtubule network. J Biol Chem. 2010;285:31661–71.
11. Takesono A, Heasman SJ, Wojciak-Stothard B, Garg R, Ridley AJ. Microtubules regulate migratory polarity through Rho/ROCK signaling in T cells. PLoS One. 2010;5:e8774.
12. Kadir S, Astin JW, Tahtamouni L, Martin P, Nobes CD. Microtubule remodelling is required for the front-rear polarity switch during contact inhibition of locomotion. J Cell Sci. 2011;124:2642–53.
13. Petrie RJ, Yamada KM. At the leading edge of three-dimensional cell migration. J Cell Sci. 2012;125:5917–26.
14. Jaganathan BG, Ruester B, Dressel L, Stein S, Grez M, Seifried E, et al. Rho inhibition induces migration of mesenchymal stromal cells. Stem Cells. 2007;25:1966–74.
15. Meriane M, Duhamel S, Lejeune L, Galipeau J, Annabi B. Cooperation of matrix metalloproteinases with the RhoA/Rho kinase and mitogen-activated protein kinase kinase-1/extracellular signal-regulated kinase signaling pathways is required for the sphingosine-1-phosphate-induced mobilization of marrow-derived stromal cells. Stem Cells. 2006;24:2557–65.
16. Fábián Z, Ramadurai S, Shaw G, Nasheuer H-P, Kolch W, Taylor C, et al. Basic fibroblast growth factor modifies the hypoxic response of human bone marrow stromal cells by ERK-mediated enhancement of HIF-1αactivity. Stem Cell Res. 2014;12:646–58.
17. Moodley K, Angel CE, Glass M, Graham ES. Real-time profiling of NK cell killing of human astrocytes using xCELLigence technology. J Neurosci Methods. 2011;200:173–80.
18. Brown JAL, Santra T, Owens P, Morrison AM, Barry F. Primary cilium-associated genes mediate bone marrow stromal cell response to hypoxia. Stem Cell Res. 2014;13:284–99.
19. Baek SJ, Kang SK, Ra JC. In vitro migration capacity of human adipose tissue-derived mesenchymal stem cells reflects their expression of receptors for chemokines and growth factors. Exp Mol Med. 2011;43:596–603.
20. Salhia B, Rutten F, Nakada M, Beaudry C, Berens M, Kwan A, et al. Inhibition of Rho-kinase affects astrocytoma morphology, motility, and invasion through activation of Rac1. Cancer Res.
2005;65:8792–800.
21. Wheeler AP, Wells CM, Smith SD, Vega FM, Henderson RB, Tybulewicz VL, et al. Rac1 and Rac2 regulate macrophage morphology but are not essential for migration. J Cell Sci. 2006;119:2749–57.
22. Heasman SJ, Carlin LM, Cox S, Ng T, Ridley AJ. Coordinated RhoA signaling at the leading edge and uropod is required for T cell transendothelial migration. J Cell Biol. 2010;190:553–63.
23. Magdalena J, Millard TH, Machesky LM. Microtubule involvement in NIH 3T3 Golgi and MTOC polarity establishment. J Cell Sci.
2003;116:743–56.
24. Lin M-N, Shang D-S, Sun W, Li B, Xu X, Fang W-G, et al. Involvement of PI3K and ROCK signaling pathways in migration of bone marrow-derived mesenchymal stem cells through human brain microvascular endothelial cell monolayers. Brain Res. 2013;1513:1–8.
25. Yang S, Kim H-M. ROCK Inhibition Activates MCF-7 Cells. PLoS One. 2014;9:e88489.
26. Hung Y-W, Lai M-T, Tseng Y-J, Chou C-C, Lin Y-Y. Monocyte chemoattractant protein-1 affects migration of hippocampal neural progenitors following status epilepticus in rats. J Neuroinflammation. 2013;10:11.
27. Talaia C, Queiroz G, Pinheiro H, Moura D, Gonçalves J. Involvement of G-proteinβγsubunits on the influence of inhibitoryα2-autoreceptors on the angiotensin AT1-receptor modulation of noradrenaline release in the rat vas deferens. Neurochem Int. 2006;49:698–707.
28. Zohrabian VM, Forzani B, Chau Z, Murali R, Jhanwar-uniyal M. Rho/ROCK and MAPK signaling pathways are involved in glioblastoma cell migration and proliferation. Anticancer Res. 2009;29:119–23.
29. Zhao M, DiScipio RG, Wimmer AG, Schraufstatter IU. Regulation of CXCR4-mediated nuclear translocation of extracellular signal-related kinases 1 and 2. Mol Pharmacol. 2006;69:66–75.
30. Alblas J, Ulfman L, Hordijk P, Koenderman L. Activation of Rhoa and ROCK are essential for detachment of migrating leukocytes. Mol Biol Cell. 2001;12:2137–45.
31. Cain RJ, Ridley AJ. Phosphoinositide 3-kinases in cell migration. Biol Cell. 2009;101:13–29. Wiley Online Library.
32. Saso J, Shields S-K, Zuo Y, Chakraborty C. Role of Rho GTPases in human trophoblast migration induced by IGFBP1. Biol Reprod. 2012;86:1–9. 33. Zhang X, Lin M, van Golen KL, Yoshioka K, Itoh K, Yee D. Multiple signaling
pathways are activated during insulin-like growth factor-I (IGF-I) stimulated breast cancer cell migration. Breast Cancer Res Treat. 2005;93:159–68. 34. Piemonti L, Calori G, Lattuada G, Mercalli A, Ragogna F, Garancini MP, et al.
Association between plasma monocyte chemoattractant protein-1 concentration and cardiovascular disease mortality in middle-aged diabetic and nondiabetic individuals. Diabetes Care. 2009;32:2105–10.
35. Weir RAP, Murphy CA, Petrie CJ, Martin TN, Clements S, Steedman T, et al. Monocyte chemoattractant protein-1: a dichotomous role in cardiac remodeling following acute myocardial infarction in man? Cytokine. 2010;50:158–62.
36. Patil R, Shukre S, Paranjape R, Thakar M. Heparin and EDTA anticoagulants differentially affect the plasma cytokine levels in humans. Scand J Clin Lab Invest. 2013;73:452–5.
37. Volpe S, Thelen S, Pertel T, Lohse MJ, Thelen M. Polarization of migrating monocytic cells is independent of PI 3-kinase activity. PLoS One. 2010;5:e10159.
38. Weiss-Haljiti C, Pasquali C, Ji H, Gillieron C, Chabert C, Curchod M-L, et al. Involvement of phosphoinositide 3-kinase gamma, Rac, and PAK signaling in chemokine-induced macrophage migration. J Biol Chem.
2004;279:43273–84.
39. Raftopoulou M, Hall A. Cell migration: Rho GTPases lead the way. Dev Biol. 2004;265:23–32.
41. Ridley AJ, Schwartz MA, Burridge K, Firtel RA, Ginsberg MH, Borisy G, et al. Cell migration: integrating signals from front to back. Science.
2003;302:1704–9.
42. Worthylake RA. RhoA is required for monocyte tail retraction during transendothelial migration. J Cell Biol. 2001;154:147–60.
43. Pertz O, Hodgson L, Klemke RL, Hahn KM. Spatiotemporal dynamics of RhoA activity in migrating cells. Nature. 2006;440:1069–72.
44. Ridley AJ. Life at the leading edge. Cell. 2011;145:1012–22. Elsevier.
Submit your next manuscript to BioMed Central and take full advantage of:
• Convenient online submission
• Thorough peer review
• No space constraints or color figure charges
• Immediate publication on acceptance
• Inclusion in PubMed, CAS, Scopus and Google Scholar
• Research which is freely available for redistribution