R E S E A R C H
Open Access
Street characteristics preferred for
transportation walking among older adults:
a choice-based conjoint analysis with
manipulated photographs
Jelle Van Cauwenberg
1,2,3*, Ilse De Bourdeaudhuij
4, Peter Clarys
2, Jack Nasar
5, Jo Salmon
6, Liesbet Goubert
7and Benedicte Deforche
1,2Abstract
Background:Knowledge about the relationships between micro-scale environmental factors and older adults’ walking for transport is limited and inconsistent. This is probably due to methodological limitations, such as absence of an accurate neighborhood definition, lack of environmental heterogeneity, environmental co-variation, and recall bias. Furthermore, most previous studies are observational in nature. We aimed to address these limitations by investigating the effects of manipulating photographs on micro-scale environmental factors on the appeal of a street for older adults’transportation walking. Secondly, we used latent class analysis to examine whether subgroups could be identified that have different environmental preferences for transportation walking. Thirdly, we investigated whether these subgroups differed in socio-demographic, functional and psychosocial characteristics, current level of walking and environmental perceptions of their own street.
Methods:Data were collected among 1131 Flemish older adults through an online (n= 940) or an interview version of the questionnaire (n= 191). This questionnaire included a choice-based conjoint exercise with manipulated photographs of a street. These manipulated photographs originated from one panoramic photograph of an existing street that was manipulated on nine environmental attributes. Participants chose which of two presented streets they would prefer to walk for transport.
Results:In the total sample, sidewalk evenness had by far the greatest appeal for transportation walking. The other environmental attributes were less important. Four subgroups that differed in their environmental preferences for transportation walking were identified. In the two largest subgroups (representing 86 % of the sample) sidewalk evenness was the most important environmental attribute. In the two smaller subgroups (each comprising 7 % of the sample), traffic volume and speed limit were the most important environmental attributes for one, and the presence of vegetation and a bench were the most important environmental attributes for the other. This latter subgroup included a higher percentage of service flat residents than the other subgroups.
(Continued on next page)
* Correspondence:Jelle.Vancauwenberg@ugent.be
1Department of Public Health, Faculty of Medicine and Health Sciences, Ghent University, De Pintelaan 185, B-9000 Ghent, Belgium
2Department of Human Biometry and Biomechanics, Faculty of Physical Education and Physical Therapy, Vrije Universiteit Brussel, Pleinlaan 2, B-1050 Brussels, Belgium
Full list of author information is available at the end of the article
(Continued from previous page)
Conclusions:Our results suggest that the provision of even sidewalks should be considered a priority when developing environmental interventions aiming to stimulate older adults’transportation walking. Natural experiments are needed to confirm whether our findings can be translated to real environments and actual transportation walking behavior.
Keywords:physical activity, mobility, active ageing, environment, ecological model, experiment, latent class analysis, service flat residents, seniors
Background
The physically inactive lifestyle of the majority of Western older adults (≥65 years) puts them at increased risk for morbidity and mortality [1–4]. Therefore, the promotion of physical activity (PA) among older adults is deemed crucial to foster healthy ageing [5]. The promotion of walking seems particularly promising since walking is a healthy [6, 7], accessible and well-liked [8] type of phys-ical activity among older adults. Furthermore, walking for transport (e.g. to a shop or to a friend’s house) should be easy to integrate into the daily routines of most older adults.
According to socio-ecological models, the choice to walk for transport is not only determined by individual characteristics (such as attitudes and self-efficacy) but also by the environment in which older adults live [9, 10]. Hav-ing good access to a variety of daily destinations (such as grocery stores, bank offices, parks and libraries) has been linked consistently to higher levels of walking for trans-port among older adults [11–15]. Although easy access to daily destinations is important to stimulate older adults’ walking for transportation, these are macro-scale environ-mental factors that typically require high level government policy to change and come at a substantial economic cost. Hence, access to daily destinations is difficult to change in existing neighborhoods [16].
Micro-scale environmental factors (e.g. sidewalk char-acteristics and presence of vegetation), are mostly under the jurisdiction of local government and are more amen-able to change [16]. Several qualitative studies suggested that micro-scale environmental factors are important for older adults’walking for transport [17–20]. However, pre-vious quantitative studies examining the cross-sectional relationships between micro-scale environmental factors and older adults’transportation walking have yielded in-consistent findings [21, 22]. These inconsistencies might have been caused by the following methodological issues: no consensus about how to define a‘local neighborhood’ for older adults [23, 24], recall issues when older adults re-spond to questionnaires targeting their environmental perceptions and experiences while not being in that envir-onment [25], and limited variation in the envirenvir-onments being studied [26]. Furthermore, there is a tendency of en-vironmental factors to co-occur (so-called enen-vironmental co-variation), which hinders differentiating the separate
influence of each environmental factor [27]. Lastly, the vast majority of evidence in this research area comes from observational studies and there is a strong need for experi-mental research to establish causal associations [21, 28, 29]. However, conducting natural experiments in real envi-ronments is very expensive and time-consuming and such experiments may have long-lasting effects. Therefore, they should be well-informed to avoid unanticipated (negative) effects on older adults’transportation walking.
This information may be obtained from studies using photographed street environments to examine the effects of manipulating micro-scale environmental factors on a streets’appeal for walking for transport. This approach al-lows the researcher to observe the effects of hypothetical environmental changes on preferences for transportation walking under controlled conditions since it is easy to control the variation within and co-variation between the manipulated environmental factors. Furthermore, there is no need to accurately define an older adults’ ‘local neigh-borhood’nor do the older adults have to recall their envir-onmental perceptions and experiences because exposure to and assessment of the environment occurs simultan-eously and consistently between participants. Results of such experiments with photographs can inform natural experiments about which environmental modifications will most likely stimulate older adults’ walking for trans-port leading to more effective natural experiments.
further improvements in the environmental factor no lon-ger result in increases in appeal. Therefore, in the current study we wanted to examine a larger set of environmental attributes with more levels of manipulation (e.g. even, slightly uneven and very uneven sidewalk). For this pur-pose, we used conjoint analysis which allows for numerous attributes and levels to be studied by assigning their combi-nations randomly across participants [31].
The importance of certain micro-scale environmental factors for walking for transport might differ between sub-groups of the older population (based on socio-demographic and functional characteristics). In our previous pilot study it was found that compared to older adults who walk less than an hour per week, those who walk an hour or more reported that streets with benches were more inviting for walking [30]. Knowledge of such moder-ators is necessary for designing environments that suit the needs of multiple subgroups [32]. For example, press-competence models assume that when people become more functionally limited and their competence decreases, their sensitivity to environmental pressure and barriers increases [33]. Hence, one could hypothesize that certain environmental characteristics (e.g., sidewalk evenness) are more important for older adults who suffer from func-tional limitations or fear from falling. However, such hy-potheses have received mixed support [11, 34–36]. Other potentially relevant moderators are psychosocial factors regarding walking for transport (e.g. attitude, self-efficacy, habit), and current walking for transport level [32]. The identification of environmental factors that especially appeal to older adults with a less favorable psychosocial profile (i.e. low attitude, self-efficacy towards walking) or to infrequent walkers, can help to inform environmen-tal interventions regarding how to promote walking for transport among the least active.
Environmental preference may also be influenced by the environmental characteristics of the street in which one lives. For example, older adults residing in a street with heavy traffic may experience this hazard when walk-ing for transport on a daily basis and, therefore, pay more attention to this particular environmental characteristic. Furthermore, older adults with a general preference for na-ture (and, therefore, also for streets with vegetation while walking for transport) may have self-selected themselves to live in a street with a lot of vegetation. Currently, know-ledge regarding the moderators of associations between micro-scale environmental factors and walking for trans-port is limited [21]. While conjoint analyses do not allow the examination of moderators of relationships between micro-scale environmental factors and appeal for transpor-tation walking directly (by means of interaction effects), it is possible to investigate the existence of subgroups that have different environmental preferences (by means of latent class analysis) [31, 37]. These subgroups can then
be compared according to characteristics hypothesized to influence (or moderate) the relationships between the micro-scale environmental factors and a street’s ap-peal for transportation walking.
The primary aim of the current study was to investi-gate the perceived influence of a large set of micro-scale environmental factors on a street’s appeal for transporta-tion walking using manipulated photographs of a street among a large sample of older adults. Further aims were to examine whether there were subgroups that differed in environmental preferences for transportation walking, and whether these subgroups differed by socio-demographic, functional and psychosocial characteristics, current level of walking, and environmental perceptions of their own street.
Methods
Protocol and participants
A computerized structured questionnaire and a choice-based conjoint exercise with manipulated photographed streets was developed using Sawtooth Software (SSI-Webversion 8.3.8). Data were collected through: (1) an online questionnaire; or (2) an interview version of the questionnaire. Interviews were performed to reach older adults who do not have access to or use the Internet. According to the annual study on ICT-use in Belgian households in 2013, 52 % of the Flemish 65 to 74 year-olds did not use the Internet during the last three months [38].
Several sampling strategies were used to recruit Flemish older participants. The online recruitment occurred by contacting (senior) organizations and asking them to dis-seminate information about the study with a link to the questionnaire among their members. The information and link was posted on their websites, published in their newsletters and/or spread via Facebook or e-mail. Organi-zations contacted included member organiOrgani-zations of the Flemish Senior Council (including political, socio-cultural and leisure organizations), city and municipal govern-ments, social services and senior councils of cities and mu-nicipalities, health funds, organizations providing courses for older adults, and websites specifically targeting older adults. Flyers with information about the study were also distributed via shops, libraries and local service centers. After filling out the online questionnaire, participants were also asked to send the questionnaire link to their relatives.
eight owned by the public center for social welfare) and seven local service centers across Flanders. In the service flat residences, our visit was announced by an information letter for each resident, in the social service centers our visit was announced by flyers and posters. During our visit, participants could come to a communal area where we interview-administered the computerized questionnaire.
For inclusion in the study, participants had to be 65 years or older and non-institutionalized. Prior to data collection, the protocol and questionnaires were pilot-tested among ten older adults and questions that were unclear or ambiguous were modified. Actual data collec-tion was performed between November 2014 and January 2015. Completing the questionnaire took approximately 30 min. Informed consent was automatically obtained when participants completed the questionnaire. The study protocol was approved by the ethical committee of the Brussels and Ghent University hospital.
Development of manipulated photographs
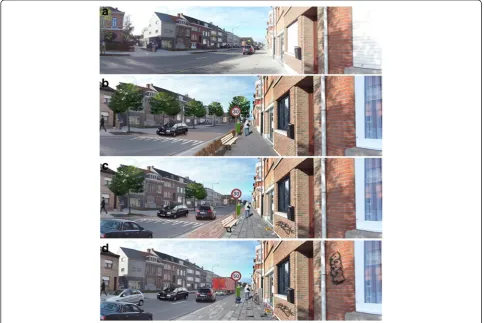
The panoramic photographs were all modified versions of one“basic”panoramic photograph (see Fig. 1a). This basic photograph was taken at eye level from the sidewalk in a typical (semi-)urban street in Flanders (Belgium). The
original photograph itself was not included in the choice-based conjoint exercise, because it was necessary to modify it slightly to be able to perform the intended manipula-tions. The original photograph was experimentally manip-ulated on nine environmental attributes using Adobe Photoshop® software. The selection of environmental attri-butes to be manipulated (see Table 1) was based upon the environmental attributes that appeared to be most import-ant for walking for transport in three previous studies with Flemish older adults [17, 30, 39]. Four environmental at-tributes had two (e.g. absence vs. presence of a bench) levels and five attributes had three levels (e.g. very uneven, slightly uneven and even sidewalk). Photographs with all possible combinations between the environmental attri-butes were created, yielding 3888 (= 24× 35) photographs. Figures 1b and 1d represent the anticipated best and worst street for walking for transport. Figure 1c represents a street with the medium levels of the environmental attri-butes with three levels (and the anticipated best level for the environmental attributes with two levels).
Structured questionnaire
The structured questionnaire collected socio-demographic information (i.e., age, gender, area of residence, place of
birth, marital status, car ownership, educational level, and former main occupation), functional limitations, use of walking aids, fear of falling, psychosocial factors, current walking for transport level, and environmental perceptions. To obtain information on mode of online recruitment, participants were also asked to indicate which channel they received the link to the question-naire through.
To assess physical functioning, the physical function-ing scale of the validated RAND SF-36 questionnaire was used [40, 41]. Participants were asked to indicate how their health limited their ability to perform ten ac-tivities of daily living (e.g. climbing stairs, washing and dressing, etc.) on a 3-point scale: severely, somewhat, or not limited. Following the RAND SF-36 scoring protocol (available on http://www.rand.org/health/surveys_tools/mos/ mos_core_36item.html), these responses were recoded as: 0; 50; and 100, respectively, and averaged to obtain the variable
‘physical functioning’with a higher score indicating greater levels of functioning.
To assess use of a walking aid, participants selected one of the following response options: no; use a cane; or use a walker and/or a wheelchair. These responses were dichotomized into‘not using a walking aid’versus‘using
a walking aid’. Fear of falling was measured using the validated Falls Efficacy Scale-International [42, 43]. This scale consists of 16 items (e.g. cleaning the house, getting in or out of a chair, walking on an uneven surface) for which participants indicated how concerned they were about falling when performing these activities on a 4-point scale (1 = not at all concerned, 4 = very concerned).
Questions targeting psychosocial variables were similar to those used in previous studies [44, 45], but applied specifically to walking for transport to a destination within 10 min walking distance. Preference for active/passive transport was assessed by asking ‘which transport mode do you prefer to travel to a destination located within a 10 min walking distance?’: car; motorbike; public trans-port; bicycle; electrical bicycle; walking; or scooter. Self-efficacy was assessed with a single item: ‘How confident are you that you can continue to walk to a destination lo-cated within a 10 min walking distance when conditions are difficult (e.g. bad weather, you feel tired, etc.)?’. Re-sponse options ranged from (1) ‘I am sure I cannot continue with walking’to (5) ‘I am sure I can continue with walking’.
Social support was assessed with a single item: ‘Do you receive support from family and friends to walk to a destination located within a 10 min walking distance?’. Perceived benefits (‘Do you believe that walking to a destination located within a 10 min walking distance has many benefits for you (e.g. fresh air, pleasant, healthy, etc.)?’) and barriers (‘Do you experience many barriers to walk to a destination located within a 10 min walking distance (e.g. lack of time, health problems, bad weather, etc.)?’) were assessed with two items. A single item assessed intention to walk by asking: ‘Imagine that you live in a neighborhood where it is easier to walk to a destination located within a 10 min walking distance (e.g. there are more shops nearby, it is safer to walk…). Do you think you would walk more to destinations lo-cated within a 10 min walking distance?’ For the latter four constructs, response options ranged from: (1) ‘no, definitely not’ to (5)‘yes, definitely’. Habit was assessed by four items that asked whether walking for transport is something: (1) they automatically do; (2) that belongs to their daily routine; (3) that typifies them; (4) that they do for a long time already. Response options ranged from: (1) completely disagree to (5) completely agree. Responses on the four items were averaged to obtain the variable‘habit’.
To assess current walking for transport and walking for recreation levels, a section of the validated International Physical Activity Questionnaire (IPAQ, long form, last 7 days) was used [46]. Participants were asked to report the frequency of walking for transport during the last seven days and the average duration of walking for trans-port on one of those days. Weekly minutes of walking for
Table 1Manipulated environmental factors with their levels
Environmental factors Levels
Sidewalk evenness Very uneven
Slightly uneven
Even
Separation from traffic No separation
Cycling path in other color (red)
Small shrub between sidewalk and cycling path
Obstacle on sidewalk Obstacle (electrical box and bicycle on sidewalk)
No obstacle
Traffic volume 4 cars + 1 truck
3 cars
1 car
Speed limit 50 km/h
30 km/h
Traffic calming device No speed bump
Speed bump
Overall upkeep Bad upkeep (a lot of litter and graffiti)
Moderate upkeep (a bit of litter and graffiti)
Good upkeep (no litter and graffiti)
Vegetation No tree
Two trees
Five trees
Benches No bench
transport was calculated by multiplying the reported num-ber of days by the duration of walking for transport on one of those days (standard scoring procedures available on http://www.ipaq.ki.se/). Weekly minutes of walking for recreation was assessed and calculated similarly.
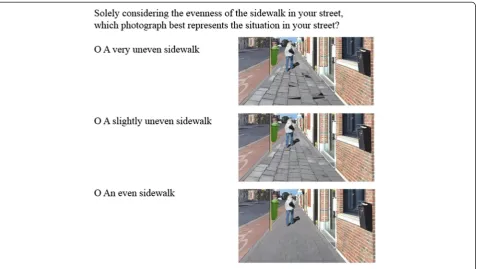
Environmental perceptions of participants’ own street were assessed by asking how participants perceived their street in terms of sidewalk evenness, separation from traffic, sidewalk width, traffic volume, speed limit, traffic calming devices, overall upkeep, presence of vegetation and presence of benches. These environmental factors corresponded to the factors that were manipulated in the photographs. Similarly, the response options corre-sponded to the levels of the manipulated factors in the photographs and the manipulated photographs were used to illustrate the response options. An example of the ques-tion assessing perceived sidewalk evenness is provided in Fig. 2 (assessment of the eight remaining environmental perceptions is available in Additional file 1). Since these questions were especially developed for the current study, test-retest reliability was assessed in a subsample (n= 46). All questions had substantial to perfect test-retest reliabil-ity (kappa’s > 0.60), except for separation sidewalk-cycling path (kappa = 0.51) and overall upkeep (kappa = 0.45), which had moderate reliability [47].
Choice-based conjoint exercise
To investigate the effects of the environmental manipu-lations on the appeal of a street for transportation
walking a choice-based conjoint exercise was developed using Sawtooth Software (SSIWeb version 8.3.8). Choice-based conjoint exercises are frequently used in marketing research to study consumer preferences. During a choice-based conjoint exercise, participants are asked to choose between products (e.g. televisions) that differ in some pre-defined characteristics (e.g. screen size, screen quality and price) (Orme, 2009). In the current study the ‘products’ are streets that differed in nine pre-defined environmental attributes. This methodology has been used previously to study older adults’preferences for public open spaces [48] and walking programs [49]. While these previous studies used text descriptions, the current study used the manipu-lated photographs to depict the environmental attributes of the streets. Responses to color photographs have been shown to accurately reflect on-site responses to real envi-ronments [50, 51].
The choice-based conjoint exercise consisted of 20 choice tasks in which participants were required to choose be-tween two manipulated streets. Participants were requested to indicate which street they would prefer for transporta-tion walking. The choice task was full-profile, which implies that the two streets presented in one task could differ in a minimum of one and a maximum of nine environmental attributes (Orme, 2009). The conjoint exercise started with three training tasks to get acquainted with the format; these three exercises were similar for all participants and were not used in the analyses. The remaining 17 tasks consisted of 14 random and three fixed tasks. The 14 random tasks
were different for all participants and were randomly assigned by the software using the recommended balanced overlap method [52]. The three fixed tasks were similar for all participants and two of these tasks were exactly the same to enable examination of test-retest reliability. The results of the fixed tasks were also compared against the predictions of the final statistical model to check the validity of the statistical model.
Prior to the choice-based conjoint exercise participants received the following standardized instructions:“Imagine yourself walking to a friend’s home located 10 min from your home during daytime. The weather is ideal for walking, it is not too warm, not too cold, there is no wind, and it is not raining. Two photographs of streets will be presented to you, one in the upper part of the screen and another one in the lower part of the screen. Each photograph depicts the same street, but you will notice that certain things differ from photograph to photograph. The purpose is that you indicate which street you would choose to walk along. The distance to your friend’s home is the same along both streets. There is no good or bad solution, we are just interested in what you consider as most important while walking to your friend’s home.”By instructing participants to imagine walking to a friend’s home located ten minutes from their own home, a specific context was provided [53] and distance to the destination was standardized.
Data analyses
Online recruitment yielded 1442 eligible participants filling out the questionnaire. Participants not completing the choice task (n= 412) were removed from the dataset resulting in 1030 complete cases. Additionally, 169 older adults completed an interview-administered version of the questionnaire yielding a total sample size of 1199 partici-pants. Test-retest reliability of the two fixed tasks resulted in a percentage agreement of 94.3 % which corresponds to 68 participants not responding consistently. These incon-sistent responders were removed yielding a final analytic sample of 1131 participants. The inconsistent responders were older, more likely to live in a service flat and had the questionnaire administered by interview than consistent responders.
Descriptive characteristics of the sample were calculated using SPSS Statistics 22. Data obtained from the choice-based conjoint exercise were analyzed using Sawtooth Software SSI Web version 8.3.8. Choice-based conjoint analyses yield two types of parameters: part-worth utilities and importances [31]. A part-worth utility of an environ-mental attribute level can be interpreted similar to a re-gression coefficient and represents the desirability of the environmental attribute level. For ease of interpretation, these part-worth utilities were zero-centered. For example, if the attribute levels ‘very uneven’,‘slightly uneven’ and
‘even’sidewalk have part-worth utilities -5.0, 1.0 and 4.0, respectively, this means that a very uneven sidewalk is the least preferred and an even sidewalk is the most preferred level. Importances reflect the impact an environmental at-tribute has on choice (with greater importances reflecting greater impacts on choice). It should be noted that impor-tances are directly related to the environmental attribute ranges (i.e. the difference between the least and most fa-vorable environmental attribute level) that were used in the experiment.
The conjoint analyses were performed in three steps. First, part worth utilities and importances were calcu-lated in the total sample using Hierarchical Bayes esti-mation as recommended [31, 54]. Administration mode (individually online versus interview) was entered as a covariate in the analyses. Preliminary iterations were run until convergence was reached and, consecutively, 10,000 draws were used per respondent. Average part-worth util-ities and importances were calculated and 95 % confi-dence intervals were constructed to compare part-worth utilities and importances. Part-worth utilities within one attribute and importances with non-overlapping 95 % confidence intervals are significantly different from each other with alpha = 0.05. The fit of the conjoint model was presented by the Root LikeliHood (RLH) which ranges be-tween 0 and 1. For a choice exercise with two alternatives, the RLH should be substantially larger than 0.50 (the predictability of the response using uninformative utilities) [31]. Furthermore, to assess the validity of the models, we presented the percentage of agreement between the choice predicted by the model and the actual choice of the partic-ipants in the two different fixed tasks. This represents for how many participants the choice predicted by the model corresponded to the actual choice of the participants.
In a third step, we used SPSS statistics 22 to examine whether the four subgroups obtained in step two dif-fered in socio-demographic, functional and psychosocial characteristics, current level of walking and environmental perceptions of their own street. For continuous variables, differences between the four subgroups were examined using MANOVAs, we interpreted Wilks’ Lambda’s with Tukey post-hoc analyses when variances were homogenous and Tamhane post-hoc analyses when variances were heterogeneous [55]. For categorical variables, differ-ences between the four subgroups were examined using chi square tests. Significance level was defined at alpha = 0.05.
Results
From the analytic sample of 1131 participants, 83.1 % completed the questionnaire online. The most important channels from which these participants received the link to the questionnaire were: relatives (24.3 %), senior orga-nizations (13.0 %), websites or newsletters from their health funds (10.6 %), city/municipalities (7.8 %) and the Flemish senior council (7.0 %), other websites (12.9 %), and city/municipal senior councils (8.5 %).
Descriptive characteristics of the sample
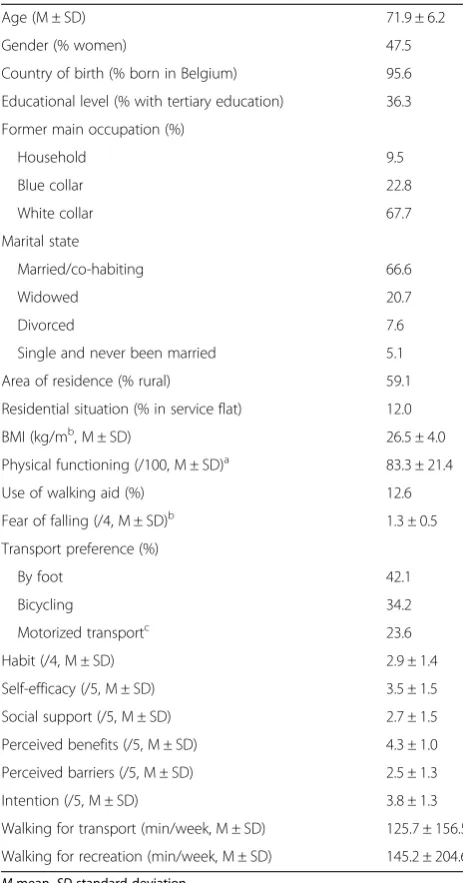
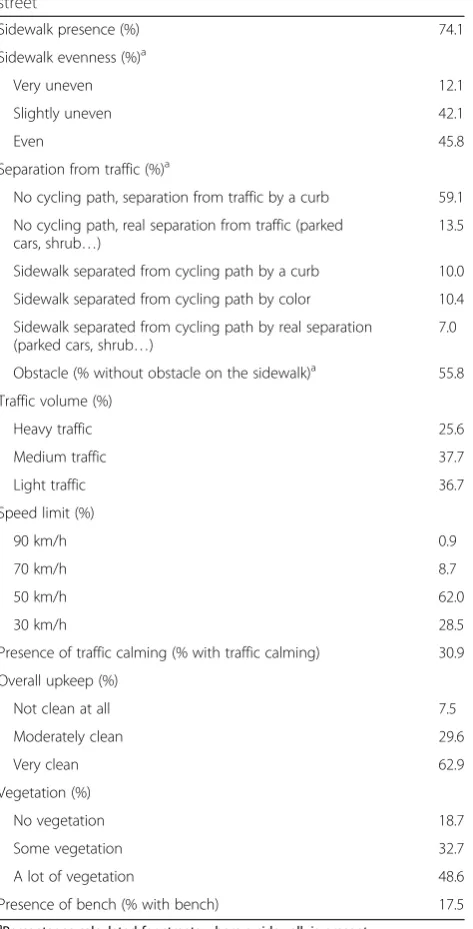
Table 2 presents the socio-demographic, functional and psychosocial characteristics, and current walking levels of the sample. Table 3 presents participants’perceptions of their own street. About 74 % of the participants re-ported having a sidewalk in their street. Of the partici-pants with a sidewalk in their street, 54 % reported the sidewalk to be very (12 %) or slightly uneven (42 %). The most prevalent street configuration was a street without a cycling path and the sidewalk being separated from traffic by a curb (59 %).
Environmental preference for transportation walking in the total sample
In the total sample, sidewalk evenness was the most im-portant street feature for transportation walking (56.2 %; 95 % CI = 55.0, 57.4), followed by traffic volume (9.1 %; 95 % CI = 8.6, 9.6) and overall upkeep (7.7 %; 95 % CI = 7.5, 7.9) (see Fig. 3). These were followed by speed limit (5.9 %; 95 % CI = 5.6, 6.3) and separation from traffic (5.7 %; 95 % CI = 5.4, 6.0) for which the importances did not significantly differ from each other. The importance of vegetation (5.2 %; 95 % CI = 4.9, 5.5) was significantly lower than speed limit, but not than separation from traffic. Consecutively, importances decreased significantly for the presence of a bench (4.5 %; 95 % CI = 4.2, 4.8), an obstacle on the sidewalk (3.3 %; 95 % CI = 3.2, 3.4) and traffic calming (2.3 %; 95 % CI = 2.2, 2.5).
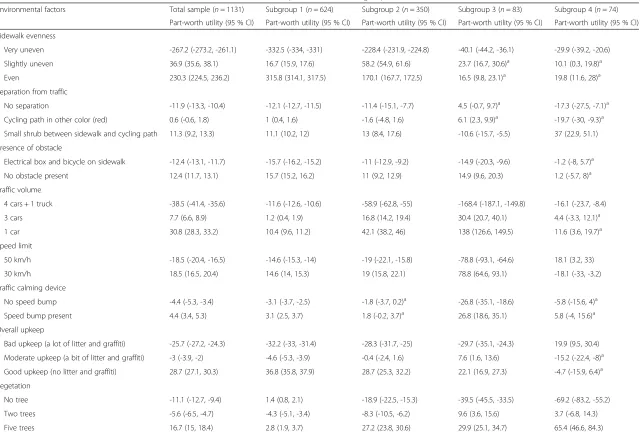
Within each environmental attribute part-worth util-ities significantly increased in the expected direction (see
Table 4, first column). For example, within sidewalk evenness, a very uneven sidewalk had a significantly lower part-worth utility (-267.2; 95 % CI = -273.2, -261.1) than a slightly uneven sidewalk (36.9; 95 % CI = 35.6, 38.1) which again had a significantly lower part-worth utility than an even sidewalk (230.3; 95 % CI = 224.5, 236.2). This implies that an even sidewalk was preferred over a slightly uneven sidewalk which in turn was pre-ferred over a very uneven sidewalk.
Table 2descriptive characteristics of the sample (n= 1131)
Age (M ± SD) 71.9 ± 6.2
Gender (% women) 47.5
Country of birth (% born in Belgium) 95.6
Educational level (% with tertiary education) 36.3
Former main occupation (%)
Household 9.5
Blue collar 22.8
White collar 67.7
Marital state
Married/co-habiting 66.6
Widowed 20.7
Divorced 7.6
Single and never been married 5.1
Area of residence (% rural) 59.1
Residential situation (% in service flat) 12.0
BMI (kg/mb, M ± SD) 26.5 ± 4.0
Physical functioning (/100, M ± SD)a 83.3 ± 21.4
Use of walking aid (%) 12.6
Fear of falling (/4, M ± SD)b 1.3 ± 0.5
Transport preference (%)
By foot 42.1
Bicycling 34.2
Motorized transportc 23.6
Habit (/4, M ± SD) 2.9 ± 1.4
Self-efficacy (/5, M ± SD) 3.5 ± 1.5
Social support (/5, M ± SD) 2.7 ± 1.5
Perceived benefits (/5, M ± SD) 4.3 ± 1.0
Perceived barriers (/5, M ± SD) 2.5 ± 1.3
Intention (/5, M ± SD) 3.8 ± 1.3
Walking for transport (min/week, M ± SD) 125.7 ± 156.5
Walking for recreation (min/week, M ± SD) 145.2 ± 204.6
Mmean,SDstandard deviation
a
scale with 0 = minimum physical functioning and 100 = maximum physical functioning
b
scale with 1 = minimum fear from falling and 100 = maximum fear from falling
c
Subgroups differing in environmental preferences for transportation walking
Latent class analyses revealed four subgroups differing in environmental preferences for transportation walking. The importances of the environmental attributes within the four subgroups are presented in Fig. 4 and the corre-sponding part worth utilities are presented in Table 4.
Subgroup 1 was the largest representing 624 partici-pants (55.2 % of the total sample). For this subgroup, with an importance of 72.0 % (95 % CI = 71.7, 72.4), sidewalk evenness was by far the most important environmental at-tribute influencing preference for transportation walking.
Importances of the other environmental attributes were much lower. For example, the second most important at-tribute, overall upkeep, had an importance of only 7.7 % (95 % CI = 7.5, 7.9). The importances of the presence of an obstacle on the sidewalk (3.5 %; 95 % CI = 3.4, 3.6), presence of a bench (3.5 %; 95 % CI = 3.3, 3.6), and speed limit (3.3 %; 95 % CI = 3.2, 3.5) were significantly lower than overall upkeep, but did not differ significantly from each other. The importance of traffic volume (3.1 %; 95 % CI = 3.0, 3.3) was significantly lower than the importance of the presence of an obstacle and bench, but not than the importance of speed limit. The importance of separation from traffic (3.1 %; 95 % CI = 3.0, 3.2) was significantly lower than the importance of the presence of an obstacle, bench, and speed limit, but not than the importance of traffic volume. The importances further significantly de-creased for vegetation (2.4 %; 95 % CI = 2.2, 2.5) and traffic calming (1.3 %; 95 % CI = 1.3, 1.4). Similar to our findings in the total sample, part-worth utilities significantly in-creased in the expected direction within each environ-mental attribute (see Table 4).
Subgroup 2 included 350 participants (30.9 % of the total sample) for which, similar to subgroup 1 although less pronounced, sidewalk evenness was the most im-portant environmental attribute (44.3 %; 95 % CI = 43.7, 44.8). The second most important attribute was traffic volume (12.9 %; 95 % CI = 12.2, 13.5). Separation from traffic (8.5 %; 95 % CI = 8.0, 9.1), overall upkeep (8.3 %; 95 % CI = 7.8, 9.1) and vegetation (8.0 %; 95 % CI = 7.6, 8.5) had a significantly lower importance than traffic vol-ume, but their importances did not significantly differ from each other. Speed limit had a significantly lower importance (6.5 %; 95 % CI = 6.0, 7.0) than separation from traffic, overall upkeep and vegetation, but had a significantly higher importance than presence of a bench (4.5 %; 95 % CI = 4.1, 4.8). Presence of a bench had a significantly higher importance than presence of an obstacle (3.7 %; 95 % CI = 3.4, 4.0) and traffic calming (3.3 %; 95 % CI = 3.0, 3.6). The importances of these two latter attributes did not differ significantly. For sub-group 2, within each environmental attribute part-worth utilities significantly increased in the expected direction, except for traffic calming device (see Table 4). No signifi-cant difference in preference for absence or presence of a traffic calming device was observed.
In subgroup 3, which included 83 participants (7.3 % of the total sample), the highest importance was observed for traffic volume (34.2 %; 95 % CI = 30.9, 37.4), followed by speed limit (18.3 %; 95 % CI = 15.4, 21.3), sidewalk evenness (9.5 %; 95 % CI = 8.7, 10.3), vegetation (9.2 %; 95 % CI = 8.3, 10.2), overall upkeep (8.0 %; 95 % CI = 7.3, 8.8), and traffic calming (7.8 %; 95 % CI = 6.3, 9.3). The importances of the four latter attributes did not differ sig-nificantly from each other. Importances further decreased
Table 3Participants’environmental perceptions of their own street
Sidewalk presence (%) 74.1
Sidewalk evenness (%)a
Very uneven 12.1
Slightly uneven 42.1
Even 45.8
Separation from traffic (%)a
No cycling path, separation from traffic by a curb 59.1
No cycling path, real separation from traffic (parked cars, shrub…)
13.5
Sidewalk separated from cycling path by a curb 10.0
Sidewalk separated from cycling path by color 10.4
Sidewalk separated from cycling path by real separation (parked cars, shrub…)
7.0
Obstacle (% without obstacle on the sidewalk)a 55.8 Traffic volume (%)
Heavy traffic 25.6
Medium traffic 37.7
Light traffic 36.7
Speed limit (%)
90 km/h 0.9
70 km/h 8.7
50 km/h 62.0
30 km/h 28.5
Presence of traffic calming (% with traffic calming) 30.9
Overall upkeep (%)
Not clean at all 7.5
Moderately clean 29.6
Very clean 62.9
Vegetation (%)
No vegetation 18.7
Some vegetation 32.7
A lot of vegetation 48.6
Presence of bench (% with bench) 17.5
a
for separation from traffic (5.3 %; 95 % CI = 4.7, 5.9) and presence of an obstacle on the sidewalk (4.9 %; 95 % CI = 4.0, 5.8). The importances of these two attributes did not significantly differ from each other. Presence of a bench had the lowest importance (2.7 %; 95 % CI = 2.2, 3.1). Within each environmental attribute for subgroup 3, part-worth utilities significantly increased in the expected dir-ection, except for sidewalk evenness and separation from traffic (see Table 4).
In subgroup 4, which included 74 participants (6.5 % of the total sample), differences in importances between the environmental attributes were less pronounced. The highest importances were found for vegetation (18.9 %; 95 % CI = 16.2, 21.6) and presence of a bench (16.2 %; 95 % CI = 13.1, 19.4), which did not differ significantly from each other. Separation from traffic (12.9 %; 95 % CI = 11.3, 14.5) had a significantly lower importance than vegetation but not than presence of a bench. Sidewalk evenness (10.7 %; 95 % CI = 9.7, 11.8) and traffic calming (10.5 %; 95 % CI = 8.0, 12.9) had significantly lower im-portances than vegetation and presence of a bench but not than separation from traffic. Overall upkeep (9.8 %; 95 % CI = 8.4, 11.3) had a significantly lower importance than separation from traffic but not than sidewalk evenness and traffic calming. Importances for traffic volume (8.4 %; 95 % CI = 7.4, 9.3) and traffic calming device (7.4 %; 95 % CI = 5.9, 8.8) were not sig-nificantly lower than traffic calming device and overall upkeep. Presence of an obstacle (5.2 %; 95 % CI = 4.3, 6.2) had the lowest importance but did not differ sig-nificantly from traffic calming device. In subgroup 4, only two attributes followed the expected direction in terms of increases in part-worth utilities; vegetation and presence of a bench. The part-worth utilities of the remaining seven attributes did not follow the antic-ipated direction (see Table 4).
Differences between the subgroups in socio-demographic, functional, psychosocial, walking and environmental variables
Table 5 presents the differences in socio-demographic, functional, psychosocial, walking and environmental variables between the four subgroups. Subgroup 1 con-tained a high percentage of women (51.9 %), and a low percentage of participants residing in a service flat (11.1 %), walking aid use (11.4 %) and presence of traffic calming in their own street (27.6 %) compared to the other subgroups. Participants in subgroup 1 also reported more perceived barriers compared to participants in subgroup 2 (p = 0.03).
Subgroup 2 contained a low percentage of service flat residents (11.1 %) and walking aid users (11.1), but a high percentage of participants with heavy traffic (29.7) and traffic calming devices in their street (35.7 %). Participants in subgroup 2 had a significantly higher level of functional fitness (p = 0.04) and a lower level of fear of falling (p = 0.02) compared to participants in subgroup 4.
Subgroup 3 included the lowest percentage of women, rural participants and participants reporting heavy traffic in their street. Subgroup 4 included the highest percent-age of rural participants, service flat residents, users of walking aids and participants reporting light traffic in their street. It also included the highest percentage of participants reporting the presence of a bench in their street. Furthermore, participants in subgroup 4 were less functionally fit and more fearful of falling than participants in subgroup 2.
Sidewalk evenness
Very uneven -267.2 (-273.2, -261.1) -332.5 (-334, -331) -228.4 (-231.9, -224.8) -40.1 (-44.2, -36.1) -29.9 (-39.2, -20.6)
Slightly uneven 36.9 (35.6, 38.1) 16.7 (15.9, 17.6) 58.2 (54.9, 61.6) 23.7 (16.7, 30.6)a 10.1 (0.3, 19.8)a
Even 230.3 (224.5, 236.2) 315.8 (314.1, 317.5) 170.1 (167.7, 172.5) 16.5 (9.8, 23.1)a 19.8 (11.6, 28)a
Separation from traffic
No separation -11.9 (-13.3, -10.4) -12.1 (-12.7, -11.5) -11.4 (-15.1, -7.7) 4.5 (-0.7, 9.7)a -17.3 (-27.5, -7.1)a
Cycling path in other color (red) 0.6 (-0.6, 1.8) 1 (0.4, 1.6) -1.6 (-4.8, 1.6) 6.1 (2.3, 9.9)a -19.7 (-30, -9.3)a
Small shrub between sidewalk and cycling path 11.3 (9.2, 13.3) 11.1 (10.2, 12) 13 (8.4, 17.6) -10.6 (-15.7, -5.5) 37 (22.9, 51.1)
Presence of obstacle
Electrical box and bicycle on sidewalk -12.4 (-13.1, -11.7) -15.7 (-16.2, -15.2) -11 (-12.9, -9.2) -14.9 (-20.3, -9.6) -1.2 (-8, 5.7)a
No obstacle present 12.4 (11.7, 13.1) 15.7 (15.2, 16.2) 11 (9.2, 12.9) 14.9 (9.6, 20.3) 1.2 (-5.7, 8)a
Traffic volume
4 cars + 1 truck -38.5 (-41.4, -35.6) -11.6 (-12.6, -10.6) -58.9 (-62.8, -55) -168.4 (-187.1, -149.8) -16.1 (-23.7, -8.4)
3 cars 7.7 (6.6, 8.9) 1.2 (0.4, 1.9) 16.8 (14.2, 19.4) 30.4 (20.7, 40.1) 4.4 (-3.3, 12.1)a
1 car 30.8 (28.3, 33.2) 10.4 (9.6, 11.2) 42.1 (38.2, 46) 138 (126.6, 149.5) 11.6 (3.6, 19.7)a
Speed limit
50 km/h -18.5 (-20.4, -16.5) -14.6 (-15.3, -14) -19 (-22.1, -15.8) -78.8 (-93.1, -64.6) 18.1 (3.2, 33)
30 km/h 18.5 (16.5, 20.4) 14.6 (14, 15.3) 19 (15.8, 22.1) 78.8 (64.6, 93.1) -18.1 (-33, -3.2)
Traffic calming device
No speed bump -4.4 (-5.3, -3.4) -3.1 (-3.7, -2.5) -1.8 (-3.7, 0.2)a -26.8 (-35.1, -18.6) -5.8 (-15.6, 4)a
Speed bump present 4.4 (3.4, 5.3) 3.1 (2.5, 3.7) 1.8 (-0.2, 3.7)a 26.8 (18.6, 35.1) 5.8 (-4, 15.6)a
Overall upkeep
Bad upkeep (a lot of litter and graffiti) -25.7 (-27.2, -24.3) -32.2 (-33, -31.4) -28.3 (-31.7, -25) -29.7 (-35.1, -24.3) 19.9 (9.5, 30.4)
Moderate upkeep (a bit of litter and graffiti) -3 (-3.9, -2) -4.6 (-5.3, -3.9) -0.4 (-2.4, 1.6) 7.6 (1.6, 13.6) -15.2 (-22.4, -8)a
Good upkeep (no litter and graffiti) 28.7 (27.1, 30.3) 36.8 (35.8, 37.9) 28.7 (25.3, 32.2) 22.1 (16.9, 27.3) -4.7 (-15.9, 6.4)a
Vegetation
No tree -11.1 (-12.7, -9.4) 1.4 (0.8, 2.1) -18.9 (-22.5, -15.3) -39.5 (-45.5, -33.5) -69.2 (-83.2, -55.2)
Two trees -5.6 (-6.5, -4.7) -4.3 (-5.1, -3.4) -8.3 (-10.5, -6.2) 9.6 (3.6, 15.6) 3.7 (-6.8, 14.3)
Five trees 16.7 (15, 18.4) 2.8 (1.9, 3.7) 27.2 (23.8, 30.6) 29.9 (25.1, 34.7) 65.4 (46.6, 84.3)
rg
et
al.
Internat
ional
Journal
of
Behavioral
Nutrition
and
Physical
Activity
(2016) 13:6
Page
11
of
Bench present 15.5 (14, 17) 14.7 (13.9, 15.4) 11.4 (9, 13.7) 6.1 (3, 9.2) 68.2 (52.6, 83.8)
RLH 0.92 0.98 0.88 0.93 0.86
Agreement model prediction - fixed task 1 (%)b 82.2 93.8 58.3 79.5 75.7
Agreement model prediction - fixed task 2 (%)b 97.5 100.0 99.1 91.6 78.4
Part-worth utilities should be compared within one environmental factor and one subgroup (not across factors and subgroups)
a
Within one environmental factor and one subgroup, levels with an“a”do not differ significantly
b
This represents for how many participants the choice predicted by the model corresponds to the actual choice of the participants
CIconfidence interval,RLHroot likelihood
rg
et
al.
Internat
ional
Journal
of
Behavioral
Nutrition
and
Physical
Activity
(2016) 13:6
Page
12
of
Discussion
The current study aimed to examine the effects of hypo-thetical changes in micro-scale environmental factors on a street’s appeal for transportation walking among older adults. Our manipulation of sidewalk evenness was given by far the greatest rating of importance of a street’s ap-peal for transportation walking in the total sample. Fur-thermore, it was the most important factor in the two largest subgroups representing 86 % of our sample. This is in line with findings from previous qualitative studies in which sidewalk quality emerged as a critical factor influencing walking for transport among older adults [17–20]. In a previous pilot study using manipulated panoramic photographs among Flemish older adults,
sidewalk evenness also appeared as the most important environmental factor influencing a street’s appeal for transportation walking [30]. In that pilot study, qualita-tive data showed that the older participants were afraid of falling and being injured when walking on uneven sidewalks.
Previous quantitative studies have mostly focused on sidewalk availability or used overall measures such as‘ in-frastructure and safety for walking’including items such as ‘presence of sidewalks’, ‘maintenance of sidewalks’,
‘separation from motorized traffic’and‘presence of street lighting’[56]. These studies yielded inconsistent relation-ships with transportation walking [57–60]. This may be explained by the presence of a sidewalk not stimulating
Table 5Differences in socio-demographic, functional, psychosocial, walking and environmental variables between the subgroups
Subgroup 1 (n= 624)
Subgroup 2 (n= 350)
Subgroup 3 (n= 83)
Subgroup 4 (n= 74)
Chi2(p-value) Wilks’lambda F (p-value)d
Gender (% women) 51.9 42.0 37.3 47.3 12.6 (0.01)
Area of residence (% rural) 57.9 60.6 48.2 74.3 11.9 (0.01)
Residential situation (% in service flat) 11.1 11.1 13.3 23.0 9.3 (0.03)
Physical functioning (/100, M ± SD)1 83.5 ± 20.4a,b 85.2 ± 20.2a 81.8 ± 24.4a,b 75.5 ± 28.7b 4.3 (0.01)
Use of walking aid (%) 11.4 11.1 14.5 28.4 18.5 (<0.001)
Fear of falling (/4, M ± SD)2 1.3 ± 0.5a,b 1.3 ± 0.4a 1.4 ± 0.5a,b 1.6 ± 0.7b 5.9 (0.001)
Perceived barriers (/5, M ± SD) 2.6 ± 1.3a 2.4 ± 1.2b,c 2.2 ± 1.2a,c 2.6 ± 1.3a,b,c 3.9 (0.01)
Traffic volume in own street (%)
Heavy traffic 24.4 29.7 19.3 24.3 12.2 (0.06)
Medium traffic 40.7 32.3 33.7 41.9
Light traffic 34.9 38.0 47.0 33.8
Traffic calming in own street (% with traffic calming) 27.6 35.7 31.3 35.1 7.7 (0.05)
Presence of bench in own street (% with bench) 16.7 16.6 15.7 31.1 10.2 (0.02)
a,b,c
Means with different superscripts differ significantly from each other
d
The multivariate Wilks’lambda F = 1.5 with p = 0.02
transportation walking when the sidewalk is (very) uneven. Furthermore, while it is possible for observational studies to capture the overall quality of sidewalk infrastructure, they may also obscure the relationship of one environ-mental factor that strongly relates to transportation walk-ing. For example, a neighborhood may have sidewalks that are well-lit and separated from traffic and, therefore, score relatively high on ‘infrastructure and safety for walking’, but this may not relate to transportation walking if the sidewalks are uneven. Our findings suggest that sidewalk evenness may be a key factor influencing older adults’ preferences for transportation walking. However, it has to be acknowledged that importances obtained from conjoint analysis are a function of the difference between the least and most favorable level of the environmental attribute. It could be argued that our least favorable level of sidewalk evenness was rather extreme. However, 12 % of partici-pants who reported having a sidewalk in their street per-ceived it to be very uneven. This assessment of perper-ceived sidewalk evenness in their own street was illustrated with the same manipulated photograph of a very uneven side-walk as used in the choice-based conjoint exercise. Hence, for the vast majority of our sample, sidewalk evenness was the most important environmental attribute and, 12 and 42 % of participants reported their own sidewalk to be very or slightly uneven respectively. Therefore, the provision of even sidewalks can be considered a priority when design-ing or modifydesign-ing environments to promote transportation walking among older adults.
A second aim of our study was to examine whether there subgroups exist that differ in their environmental preferences for transportation walking and whether these subgroups can be characterized based on their socio-demographic, functional and psychosocial characteristics, current level of walking and environmental perceptions of their own street. Four subgroups emerged from our analysis. Two subgroups, including 55 and 31 % of all participants, had a clear preference for streets with an even sidewalk. A third and smaller subgroup, including 7 % of the sample, based their choices predominantly on traffic volume (34 %) and speed limit (18 %). This subgroup had the highest percentage of men, urban partic-ipants and particpartic-ipants residing in streets with light traffic. Possibly, these participants have a general preference for traffic-calm streets, self-selected themselves to live in streets with light traffic and also prefer streets with light traffic to walk for transport. This implies that in order to avoid discouraging older adults who live in streets with light traffic from walking for transportation, traffic volumes in their streets should not increase (e.g. by limiting cut-through traffic). Traffic volume and speed limit may influence traffic safety. Perceived traffic-related safety has been found to be unrelated to walking for trans-port among US [60] and Hong Kong older adults [57]. In
a sample of Flemish older adults feelings of traffic safety were even negatively associated to the odds of transporta-tion walking [12]. In a study among Dutch older adults, higher levels of objectively measured traffic volume were related to higher use of a street for transportation walking [61]. These previous and current findings seem to suggest that while older adults may prefer to walk in streets with little traffic, they may be forced to walk in streets with heavy traffic to reach their daily destinations. Furthermore, our current findings suggest that traffic volume and speed limit may only be a key factor influencing transportation walking for a limited proportion of older adults (and espe-cially among urban men living in streets with light traffic).
Compared to the other subgroups, the importances of the different environmental attributes in subgroup four, including 7 % of our sample, were more similar. Partici-pants in subgroup four paid most attention to the pres-ence of vegetation (19 %) and a bench (16 %). The importance of the presence of vegetation is somewhat surprising since vegetation and other aesthetic environ-mental qualities are typically considered to be related to recreational rather than transportation walking [9]. One possible explanation for the importance of vegetation is that subgroup 4 included the highest percentage of ser-vice flat residents. In the current sample, serser-vice flat residents reported being less functionally fit and walked less for recreation and transportation than participants not residing in service flats (data not shown). Therefore, they can be expected to spend a large amount of their time indoors, which may increase their need for contact with nature and, hence, increase their preference for vege-tation in streets [62]. In a sample of Australian retirement village residents, perceived aesthetics (including the item
‘lots of greenery’) of the village environment was related to recreational walking, but not to transportation walking [63]. The‘greening’of streets is a relatively low cost feas-ible environmental modification that local councils could implement to promote walking for transport among those similar to participants in subgroup 4.
The importance of the presence of a bench may be explained by the participants in subgroup 4 being the most functionally limited, reporting higher levels of fear of falling, and being more likely to use a walking aid. These participants in particular may need a place to sit and rest while walking. This finding provides some sup-port for the hypothesis raised by press-competence models that sensitivity to environmental factors is greater among more functionally limited persons [33]. Following this logic, one would expect older adults with functional limitations and fear of falling also to pay more attention to sidewalk evenness and the presence of obstacles, but this was not confirmed by our findings.
walking and environmental perceptions between the sub-groups were observed. Furthermore, the observed differ-ences were small and suggest that environmental changes targeting improvements in sidewalk evenness will increase the appeal of streets for transportation walking among al-most all Flemish older adults. One exception is that the presence of vegetation and benches may be particularly relevant for functionally limited older adults and service flat residents.
A key strength of the current study was the use of ma-nipulated photographs which allowed us to examine the effects of manipulations in micro-scale environmental attributes on a street’s appeal for transportation walking under very controlled conditions. For example, distance to a destination has been shown to be strongly related to transportation walking. During the choice-task we con-trolled for this by instructing that distance to the friend’s home was similar across the two streets. Furthermore, the use of photographs enabled us to control the variations within an environmental attribute and the co-variations between environmental attributes. A further strength was the focus on identifying subgroups with different environ-mental preferences for transportation walking; this is important for modifying environments to the needs of different subgroups.
Besides these strengths, some limitations should be acknowledged. First, we examined the effects of environ-mental modifications on older adults’preferences for trans-portation walking and not on actual transtrans-portation walking behavior. At this stage it is unclear whether modifying a street into a street with preferable environmental attributes (e.g. even sidewalks) will actually lead to more walking for transport. Therefore, our findings should be interpreted and used accordingly. Current study should not be consid-ered an endpoint, but our findings provide valuable infor-mation for future studies that aim to examine effects of real environmental modifications on real transportation walking. Second, our sample was highly educated in com-parison to the population of Flemish older adults; 36.3 % of participants had received tertiary education, while the population prevalence is 16.1 % [64]. This is not surprising since we recruited the majority of our sample online. How-ever, there is currently no evidence that educational level (or other individual socio-economic characteristics) mod-erates the relationships between micro-scale environmental factors and transportation walking among older adults [21]. Furthermore, in the current study the four subgroups with different environmental preferences did not differ in educational level. Third, two of the identified subgroups in-cluded less than 90 participants while our sample size cal-culations had shown that a minimum of 90 participants were required. This may explain why fewer significant dif-ferences between importances and utilities were observed in subgroups three and four. Fourth, since traffic speed
cannot be accurately depicted in a photograph, we used speed limit as a proxy for traffic speed. Speed limit may not correspond to actual traffic speed and the noise and exhausts generated by heavy traffic and fast-driving cars cannot be captured in a photograph. This might explain the limited importance observed for speed limit, traffic vol-ume and traffic calming. Future research could use video material to better represent these attributes involving kin-etic and auditory aspects.
Conclusions
To conclude, our findings based on manipulated photo-graphs can inform potential modifications of real-life settings regarding which environmental factors should be prioritized. Although we identified four subgroups with different environmental preferences, our results clearly show that the provision of even sidewalks should be con-sidered a priority when developing such natural experi-ments aiming to stimulate older adults’ transportation walking. Our findings also indicate that special attention should be devoted to the presence of vegetation and benches in the surroundings of service flats. Natural ex-periments are needed to confirm whether the observed effects of manipulating photographed environmental at-tributes on a street’s appeal for transportation walking can be translated to real environments and actual trans-portation walking behavior.
Additional file
Additional file 1:Assessment of environmental perceptions.
(PDF 772 kb)
Competing interests
The authors declare that they have no competing interests.
Authors’contributions
All authors were involved in the design of the study. JVC led the data collection, performed the data analyses and drafted the manuscript. All other authors critically reviewed and revised versions of the manuscript. All authors read and approved the final manuscript.
Acknowledgements
JVC is supported by a Ph.D. Fellowship of the Research Foundation Flanders (FWO, 11N0313N). JS is supported by a Principal Research Fellowship from the National Health and Medical Research Council, Australia (APP1026216). The authors acknowledge Daphne Reinehr for the manipulation of the panoramic photographs and the master thesis students who helped with data collection.
Author details
Australia.7Department of Experimental–Clinical and Health Psychology, Faculty of Psychology and Educational Sciences, Ghent University, Henry Dunantlaan 2, B-9000 Ghent, Belgium.
Received: 20 May 2015 Accepted: 12 January 2016
References
1. Eurobarometer (2010). Sport and physical activity. Accessed on 14/08/2013. http://ec.europa.eu/COMMFrontOffice/PublicOpinion/index.cfm/Survey/ getSurveyDetail/instruments/SPECIAL/surveyKy/776/p/3
2. Centers for Disease Control and Prevention (2013). U.S. physical activity statistics. Accessed on 14/08/2013. http://205.207.175.93/HDI/TableViewer/ tableView.aspx?ReportId=111
3. Chodzko-Zajko WJ, Proctor DN, Singh MAF, Minson CT, Nigg CR, Salem GJ, et al. Exercise and physical activity for older adults. Med Sci Sports Exerc. 2009;41:1510–30.
4. Chipperfield JG. Everyday physical activity as a predictor of late-life mortality. Gerontologist. 2008;48:349–57.
5. WHO: Global recommendations on physical activity for health. World Health Organization 2010, Geneva (Switzerland). http://whqlibdoc.who.int/ publications/2010/9789241599979_eng.pdf
6. De Fré B, De Martelaer K, Philippaerts R, Scheerder J, Lefevre J. Sportparticipatie en fysieke (in)activiteit van de Vlaamse bevolking: huidige situatie en seculaire trend (2003–2009). In: Participatie in Vlaanderen 2 eerste analyse van de participatiesurvey. Leuven/Den Haag: Acco; 2009.
7. Manson JE, Greenland P, LaCroix AZ, Stefanick ML, Mouton CP, Oberman A, et al. Walking compared with vigorous exercise for the prevention of cardiovascular events in women. N Engl J Med. 2002;347:716–25. 8. Murtagh EM, Murphy MH, Boone-Heinonen J. Walking: the first steps in
cardiovascular disease prevention. Curr Opin Cardiol. 2010;25:490–6. 9. Sallis JE, Cervero RB, Ascher W, Henderson KA, Kraft MK, Kerr J. An ecological
approach to creating active living communities. Annu Rev Public Health. 2006;27:297–322.
10. Stokols D. Translating social ecological theory into guidelines for community health promotion. Am J Health Promot. 1996;10:282–98.
11. King AC, Sallis JF, Frank LD, Saelens BE, Cain K, Conway TL, et al. Aging in neighborhoods differing in walkability and income: Associations with physical activity and obesity in older adults. Soc Sci Med. 2011;73:1525–33. 12. Van Cauwenberg J, Clarys P, De Bourdeaudhuij I, Van Holle V, Verte D, De
Witte N, et al. Physical environmental factors related to walking and cycling in older adults: the Belgian aging studies. BMC Public Health. 2012;12:142. 13. Salvador EP, Reis RS, Florindo AA. Practice of walking and its association
with perceived environment among elderly Brazilians living in a region of low socioeconomic level. Int J Behav Nutr Phys Act. 2010;7:67.
14. Frank L, Kerr J, Rosenberg D, King A. Healthy aging and where you live: community design relationships with physical activity and body weight in older Americans. J Phys Act Health. 2010;7:S82–90.
15. Van Holle V, Van Cauwenberg J, Van Dyck D, Deforche B, Van de Weghe N, De Bourdeaudhuij I. Relationship between neighborhood walkability and older adults’physical activity: results from the Belgian Environmental Physical Activity Study in Seniors (BEPAS Seniors). Int J Behav Nutr Phys Act. 2014;11:110.
16. Swinburn B, Egger G, Raza F. Dissecting obesogenic environments: The development and application of a framework for identifying and prioritizing environmental interventions for obesity. Prev Med. 1999;29:563–70. 17. Van Cauwenberg J, Van Holle V, Simons D, Deridder R, Clarys P, Goubert L,
et al. Environmental factors influencing older adults’walking for transportation: a study using walk-along interviews. Int J Behav Nutr Phys Act. 2012;9:85. 18. Strath S, Isaacs R, Greenwald MJ. Operationalizing environmental indicators
for physical activity in older adults. J Aging Phys Act. 2007;15:412–24. 19. Gallagher NA, Gretebeck KA, Robinson JC, Torres ER, Murphy SL, Martyn KK.
Neighborhood factors relevant for walking in older, urban, African American adults. J Aging Phys Act. 2010;18:99–115.
20. Mahmood A, Chaudhury H, Michael YL, Campo M, Hay K, Sarte A. A photovoice documentation of the role of neighborhood physical and social environments in older adults’physical activity in two metropolitan areas in North America. Soc Sci Med. 2012;74:1180–92.
21. Van Cauwenberg J, De Bourdeaudhuij I, De Meester F, Van Dyck D, Salmon J, Clarys P, et al. Relationship between the physical environment and physical activity in older adults: A systematic review. Health Place. 2011;17:458–69.
22. Thompson CW. Activity, exercise and the planning and design of outdoor spaces. J Environ Psychol. 2013;34:79–96.
23. Brownson RC, Hoehner CM, Day K, Forsyth A, Sallis JF. Measuring the built environment for physical activity state of the science. Am J Prev Med. 2009;36:S99–S123.
24. Spittaels H, Foster C, Oppert J-M, Rutter H, Oja P, Sjostrom M, et al. Assessment of environmental correlates of physical activity: development of a European questionnaire. Int J Behav Nutr Phys Act. 2009;6:39.
25. Carpiano RM. Come take a walk with me: The“Go-Along”interview as a novel method for studying the implications of place for health and well-being. Health Place. 2009;15:263–72.
26. De Vries S. Nearby nature and human health: looking at mechanisms and their implications. In: Ward Thompson C, Aspinall P, Bell S, editors. Innovative approaches to researching landscape and health Open space: people space 2. New York: Routledge; 2010.
27. Wells NM, Ashdown SP, Davies EHS, Cowett FD, Yang Y. Environment, design and obesity - Opportunities for interdisciplinary collaborative research. Environ Behav. 2007;39:6–33.
28. Ferdinand A, Sen B, Rahurkar S, Engler S, Menachemi N. The relationship between built environments and physical activity: a systematic review. Am J Public Health. 2012;102:7–13.
29. McCormack GR, Shiell A. In search of causality: a systematic review of the relationship between the built environment and physical activity among adults. Int J Behav Nutr Phys Act. 2011;8:125.
30. Van Cauwenberg J, Van Holle V, De Bourdeaudhuij I, Clarys P, Nasar J, Salmon J, et al. Using manipulated photographs to identify features of streetscapes that may encourage older adults to walk for transport. PLoS ONE. 2014;9:e112107.
31. Orme B. Getting Started with Conjoint Analysis: Strategies for Product Design and Pricing Research. Madison: Resarch publishers; 2009. 32. Kremers S, de Bruijn G-J, Visscher T, van Mechelen W, de Vries N, Brug J.
Environmental influences on energy balance-related behaviors: A dual-process view. Int J Behav Nutr Phys Act. 2006;3:9.
33. Wahl H-W, Lang FR. Aging in context across the adult life course: integrating physical and social environmental research perspectives. In: Werner SK, editor. Annual review of gerontology and geriatrics: focus on aging in context: socio-physical environments. Volume 23. New York: Springer Publishing Company; 2003. p. 1–33.
34. Forsyth A, Oakes JM, Lee B, Schmitz KH. The built environment, walking, and physical activity: Is the environment more important to some people than others? Transport Res D-Tr E. 2009;14:42–9.
35. Rantakokko M, Iwarsson S, Hirvensalo M, Leinonen R, Heikkinen E, Rantanen T. Unmet physical activity need in old age. J Am Geriatr Soc. 2010;58:707–12. 36. Rantakokko M, Manty M, Iwarsson S, Tormakangas T, Leinonen R, Heikkinen E,
et al. Fear of moving outdoors and development of outdoor walking difficulty in older people. J Am Geriatr Soc. 2009;57:634–40.
37. Orme B: Sawtooth Software: Latent Class v4.5: Software for Latent Class Estimation for CBC Data; 2012. http://www.sawtoothsoftware.com/ downloadPDF.php?file=lclass_manual.pdf
38. FOD Economie KMO, Middenstand en Energie: Enquête ICT-gebruik bij de gezinnen. Belgian Federal Government; 2013. http://statbel.fgov.be/nl/ statistieken/cijfers/arbeid_leven/ict/index.jsp
39. Van Cauwenberg J, Van Holle V, De Bourdeaudhuij I, Clarys P, Nasar J, Salmon J, et al. Physical environmental factors that invite older adults to walk for transportation. J Environ Psychol. 2014;38:94–103.
40. Haywood KL, Garratt AM, Fitzpatrick R. Quality of life in older people: A structured review of generic self-assessed health instruments. Qual Life Res. 2005;14:1651–68.
41. Ware J, Kosinski M, Keller S. SF-36 Physical and mental health summary scales: a user manual and interpretation guide. Boston: The Health Institute, New England Medical Center; 1994.
42. Kempen G, Todd CJ, Van Haastregt JCM, Zijlstra GAR, Beyer N, Freiberger E, et al. Cross-cultural validation of the Falls Efficacy Scale International (FES-I) in older people: Results from Germany, the Netherlands and the UK were satisfactory. Disabil Rehabil. 2007;29:155–62.
43. Yardley L, Beyer N, Hauer K, Kempen G, Piot-Ziegler C, Todd C. Development and initial validation of the Falls Efficacy Scale-International (FES-I). Age Ageing. 2005;34:614–9.
45. De Bourdeaudhuij I, Sallis J. Relative contribution of psychosocial variables to the explanation of physical activity in three population-based adult samples. Prev Med. 2002;34:279–88.
46. Hurtig-Wennlof A, Hagstromer M, Olsson LA. The International Physical Activity Questionnaire modified for the elderly: aspects of validity and feasibility. Public Health Nutr. 2010;13:1847–54.
47. Landis J, Koch G. The measurement of observer agreement for categorical data. Biometrics. 1977;33:159–74.
48. Aspinall P, Thompson CW, Alves S, Sugiyama T, Brice R, Vickers A. Preference and relative importance for environmental attributes of neighbourhood open space in older people. Environ Plann B Plann Des. 2010;37:1022–39. 49. Brown DS, Finkelstein EA, Brown DR, Buchner DM, Johnson FR. Estimating
older adults’preferences for walking programs via conjoint analysis. Am J Prev Med. 2009;36:201–7.
50. Nasar JL. Assessing perceptions of environments for active living. Am J Prev Med. 2008;34:357–63.
51. Stamps A. Demographic effects in environmental preferences: a meta-analysis. J Plan Lit. 1999;14:155–75.
52. Orme B: Sawtooth Software: SSIWeb v8.3 Manual; 2014. http://www. sawtoothsoftware.com/support/manuals/ssi-web-help
53. Aspinall P. On environmental preference: applying conjoint analysis to visiting parks and buying houses. In: Ward Thompson C, Aspinall P, Bell S, editors. Innovative approaches to researching landscape and health Open space: people space2. New York: Routledge; 2010.
54. Orme B. Sawtooth Software: CBC/HB v5: Software for Hierarchical Bayes Estimation for CBC Data. 2013. http://www.sawtoothsoftware.com/support/ manuals/cbc-hb-help.
55. Field A. Discovering Statistics Using SPSS. London - Thousand Oaks - New Delhi: SAGE Publications; 2005.
56. Cerin E, Conway TL, Saelens BE, Frank LD, Sallis JF. Cross-validation of the factorial structure of the Neighborhood Environment Walkability Scale (NEWS) and its abbreviated form (NEWS-A). Int J Behav Nutr Phys Act. 2009;6:32. 57. Cerin E, Sit CHP, Barnett A, Johnston JM, Cheung MC, Chan WM. Ageing in
an ultra- dense metropolis: perceived neighbourhood characteristics and utilitarian walking in Hong Kong elders. Public Health Nutr. 2014;17:225–32. 58. Saito Y, Oguma Y, Inoue S, Tanaka A, Kobori Y. Environmental and individual
correlates of various types of physical activity among community-dwelling middle-aged and elderly Japanese. Int J Environ Res Publ Health. 2013;10:2028–42.
59. Inoue S, Ohya Y, Odagiri Y, Takamiya T, Ishii K, Kitabayashi M, et al. Association between perceived neighborhood environment and walking among adults in 4 cities in Japan. J Epidemiol. 2010;20:277–86.
60. Shigematsu R, Sallis JF, Conway TL, Saelens BE, Frank LD, Cain KL, et al. Age differences in the relation of perceived neighborhood environment to walking. Med Sci Sports Exerc. 2009;41:314–21.
61. Borst HC, de Vries SI, Graham JMA, van Dongen JEF, Bakker I, Miedema HME. Influence of environmental street characteristics on walking route choice of elderly people. J Environ Psychol. 2009;29:477–84.
62. Sugiyama T, Thompson CW. Outdoor environments, activity and the well-being of older people: conceptualising environmental support. Environ Plan A. 2007;39:1943–60.
63. Nathan A, Wood L, Giles-Corti B. Perceptions of the built environment and associations with walking among retirement village residents. Environ Behav. 2014;46:46–69.
64. Belgian Federal Government: Enquête naar de arbeidskrachten (EAK). Algemene Directie Statistiek - België; 2013. http://statbel.fgov.be/nl/statistieken/ cijfers/arbeid_leven/werk/index.jsp
• We accept pre-submission inquiries
• Our selector tool helps you to find the most relevant journal
• We provide round the clock customer support
• Convenient online submission
• Thorough peer review
• Inclusion in PubMed and all major indexing services
• Maximum visibility for your research
Submit your manuscript at www.biomedcentral.com/submit