ORIGINAL ARTICLE
Evaluation of macular and peripapillary
vessel flow density in eyes with no known
pathology using optical coherence tomography
angiography
Muhammad Hassan
1, Mohammad Ali Sadiq
1, Muhammad Sohail Halim
1, Rubbia Afridi
1, Mohamed K. Soliman
2,
Salman Sarwar
2, Aniruddha Agarwal
3, Diana V. Do
1,2, Quan Dong Nguyen
1,2and Yasir Jamal Sepah
1,2*Abstract
Purpose: To assess normal vessel flow density (VFD) in macular and peripapillary regions of eyes with no known
ocular pathology using optical coherence tomography angiography (OCTA).
Methods: AngioVue (Optovue, Fremont, CA, USA) was used to capture OCTA images. A 3 × 3 mm grid and a
4.5 × 4.5 mm grid was used to scan parafoveal and peripapillary regions, respectively. ReVue software was utilized to measure VFD in five sectors within the inner two circles of ETDRS grid in macular region and correlated to retinal thickness of same sectors. At optic disc, VFD was calculated in six sectors based on Garway-Heath map. Area and mor-phology of foveal avascular zone (FAZ) was correlated with VFD in central 1 mm. The influence of myopia on mean VFD was also assessed.
Results: Twenty-four eyes (mean age: 30 years) were analyzed. Mean VFD in macular sectors was 43.5 (±4.5) and
45.8 (±5.0) % in superficial and deep retinal plexuses, respectively. Mean VFD was significantly higher in deep retinal plexus compared to superficial retinal plexus in all sectors except central 1 mm (p < 0.05). Mean VFD in central 1 mm increases with an increase in central retinal thickness in both superficial and deep retinal plexuses (p < 0.001). Mean parafoveal VFD at level of both superficial and deep retinal plexuses decrease with an increase in spherical equivalent in myopics (p < 0.05). Mean VFD in myopics was found to be significantly lower in parafoveal region of deep retinal plexus (p < 0.05). Mean area of FAZ was 0.33 (±0.15) and 0.47 mm2 (±0.15) in superficial and deep retinal plexuses, respectively. Area of FAZ decreases with an increase in central 1 mm thickness and foveal VFD (p < 0.001).
Conclusions: OCTA may be used to measure VFD in macular and peripapillary regions. Vessels in the parafoveal
region are more densely packed in the deep retinal plexus leading to higher VFD compared to superficial plexus. Thicker retina in fovea translates into higher foveal VFD due to more compact arrangement of retinal layers and continuity of inner nuclear layer (INL). Myopia is associated with lower VFD in parafoveal region at level of deep retinal plexuses which may explain thinning of INL in myopics.
© The Author(s) 2017. This article is distributed under the terms of the Creative Commons Attribution 4.0 International License (http://creativecommons.org/licenses/by/4.0/), which permits unrestricted use, distribution, and reproduction in any medium, provided you give appropriate credit to the original author(s) and the source, provide a link to the Creative Commons license, and indicate if changes were made. The Creative Commons Public Domain Dedication waiver (http://creativecommons.org/ publicdomain/zero/1.0/) applies to the data made available in this article, unless otherwise stated.
Background
The per gram oxygen demand of the retina has been described as being more than that of the brain, especially
in the macular region [1, 2]. Therefore, to maintain this
high oxygen demand, a healthy and well-regulated cir-culation is of vital importance. Retinal microvasculature is the target of a variety of retinal diseases ranging from inflammatory to occlusive processes. Therefore, imaging of the retinal microvasculature is an important compo-nent of ophthalmic examination.
Histologically, there are four layers of vascular network
in the retina [3, 4]. These include superficial retinal plexus
Open Access
*Correspondence: yjs@stanford.edu
1 Department of Ophthalmology, Byers Eye Institute, Stanford University, Palo Alto, CA 94303, USA
Page 2 of 10 Hassan et al. Int J Retin Vitr (2017) 3:27
(SRP), intermediate retinal plexus (IRP), deep retinal plexus (DRP) and radial peripapillary capillaries (RPC). These reti-nal plexuses are mainly responsible for providing nutrients to the inner half of the retina and have no role in nutrition
of the outer retina including the photoreceptors [5]. The
location of the SRP is at the level of ganglion cell layer. The IRP and DRP are located just above and below the level of the inner nuclear layers. In the macular region, there is a specialized area devoid of vessels called the foveal avascu-lar zone (FAZ), present both at the levels of SRP and DRP
[6]. The FAZ is surrounded by a ring of capillaries sharply
demarcating the avascular area. In the peripapillary region, RPC occupy the retinal nerve fiber layer (RNFL).
Fluorescein angiography involves the injection of a fluorescent dye into the circulatory system of the patient and has been reported to only effectively image the SRP
[7, 8]. It is not very effective in providing details of the
deeper retinal plexuses and the RPC.
Optical Coherence Tomography Angiography (OCTA) is a novel technique for imaging blood vessels without the need for intravenous contrast administration. It relies upon intrinsic motion contrast present in the vascular network and hence precludes the need for an artificial dye. Additionally, OCTA allows adequate visualization of the vascular abnormalities in various retinal diseases which would not be possible to visualize using the tradi-tional angiography due to leakage, pooling or staining of
the dye [9]. Furthermore, it can image of all the retinal
plexuses. Majority of the studies using OCTA have been qualitative and have described various abnormalities in the microvasculature including disruption of the vascu-lature in retinal plexuses secondary to diabetic retinopa-thy, age-related macular degeneration, vascular occlusive
disorders and uveitis [10–14]. Additionally some
stud-ies have quantified the vessel flow density (VFD) in the
retinal plexuses [15–17]. In our study, we utilized the
standardized Early Treatment of Diabetic Retinopathy (ETDRS) grid to report the VFDs in superficial and deep retinal plexuses in the macular region and in six sectors based on the Garway-Heath map centered on the optic disc. Therefore, our study aims to evaluate this quantita-tive method of measuring VFD in the standard macular and peripapillary regions of normal subjects. This would provide basis for use of as a standard method to assess the extent of vessel loss in various ocular disorders in future. Hence, VFD can be utilized as a standard out-come measure to monitor these diseases and assess the effect of various therapies used for their management.
Methods
The local Institutional Review Board approved the research on healthy volunteers. The study was conducted in compliance with the declaration of Helsinki, US Code
of Federal Regulations Title-21, and the Harmonized Tripartite Guidelines for Good Clinical Practice (1996). A written informed consent was obtained from all par-ticipants of the study. 24 eyes of 12 normal subjects were included in the study. Inclusion criteria for the study con-sisted of healthy volunteers with no known systemic or ocular diseases, except refractive error.
Optical coherence tomography angiography (OCTA)
AngioVue (Optovue, Fremont, CA, USA), was used to capture the OCTA images. Two OCTA volume scans (one horizontal and one vertical) were acquired to decrease motion artifacts and fixation changes. Split-spectrum amplitude-decorrelation angiography was used to detect flow and produce OCTA images and en face
sections. A 3 × 3 mm grid centered on the fovea was
chosen to scan the parafoveal region. A 4.5 × 4.5 mm
grid centered on the optic disc was used to scan the peri-papillary region.
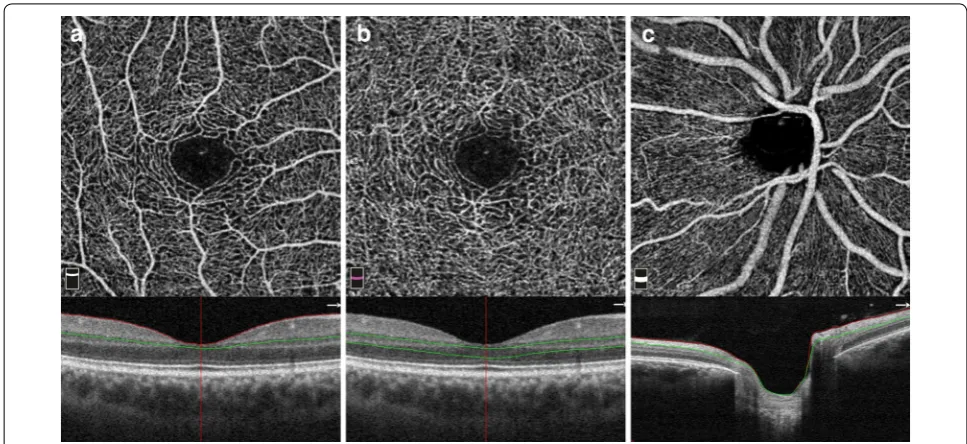
ReVue software (Version: 2015.1.0.71) was used to segments the OCT scans and measure the VFD in the
regions of interest (ROI). Each 3 × 3 mm parafoveal scan
was automatically segmented with the following bound-aries: the SRP was segmented with an inner boundary at 3 µm beneath the internal limiting membrane (ILM) and an outer boundary set at 15 µm beneath the inner
plexiform layer (IPL) (Fig. 1a). The DRP was segmented
with an inner boundary 15 µm beneath the IPL and an
outer boundary at 70 µm beneath the IPL (Fig. 1b). In the
peripapillary region the scan was segmented at the level
of RPC layer (Fig. 1c). RPC layer is defined as the layer
between the outer limit of retinal RNFL and the ILM. All scans were reviewed independently by two graders (MH and AS) to assess image quality and were repeated if the quality was found to be inadequate.
Vessel flow density and area of foveal avascular zone
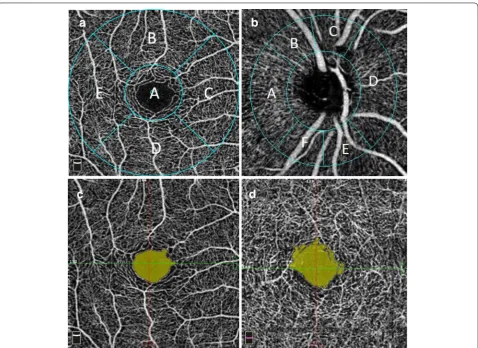
Vessel flow density (VFD) was measured by using the automated density measurement tool in the Revue soft-ware. In the macular region of interest (ROI), VFD was measured in five sectors within the inner 2 circles of the Early Treatment Diabetic Retinopathy Study (ETDRS)
grid centered on the fovea (Fig. 2a). The diameter of the
inner circle was 1 mm and the outer circle was 3.0 mm. The location of grid was manually corrected to center on the fovea if the default position calculated by the software was incorrect. The location of the foveal center was con-firmed by cross referencing with the OCT scans associ-ated with the OCTA image. The VFD measurements were noted at the level of both SRP and DRP.
At the optic disc, VFD was reported in six sectors based on the Garway-Heath map centered on the optic
fitting an ellipse to the disc margin shown on the OCT en face image. This was manually corrected in case the auto-mated positing failed to do so. The ring width between the inner and outer elliptical contour was 0.75 mm in
4.5 mm × 4.5 mm scans.
The area of the FAZ was measured by using the non-flow measurement tool in the software. The area of the FAZ was identified on the angioflow image as area void
of any vasculature. Figure 2c, d shows a sample of
demar-cated FAZ area in SRP and DRP.
Optical coherence tomography
AngioVue (Optovue, Fremont, CA, USA), was used to capture standard cross sectional scans. The machine cap-tures 1024 A-scans per B scans and 70,000 A-scans per second. The scan depth is up to 3-mm and the tissue axial resolution is 5 µm. Retinal map analysis protocol was used to obtain mean full retinal thickness measurements for each of the five sectors within the inner 2 circles of the ETDRS grid corresponding to sectors used in VFD meas-urement. Central retinal thickness (CRT) was defined as the average thickness of the central 1 mm diameter of the ETDRS grid.
Spherical equivalent
Eyes having any degree of spherical and cylindrical error were classified as myopics. Mean spherical equivalent were calculated using the spherical diopter plus half of the cylindrical diopter power and utilized in this study for analysis. Hyperopic eyes were excluded from the analysis.
Outcome measures
Mean VFDs in SRP and DRP were correlated with the retinal thicknesses in corresponding sectors on the grid in the macular region. The effect of demographic char-acteristics (age, gender and race) on mean VFD was also reported. Furthermore, the influence of myopia on the mean VFD was also assessed. The mean VFD in SRP and DRP was correlated with the spherical equivalents of the subjects. Mean VFD among myopics was also compared to the normal subjects. Area of FAZ was correlated with VFD in the central 1 mm and with the CRT.
Statistical analysis
Stata V14.1 (Stata Corp, TX) was used to all statistical analysis. Mean and standard deviations in VFDs, were reported for all the sectors in the SRP and DRP in the
macular region. Paired sample t test was used to compare
mean VFD in SRP and DRP to account for eyes from the same patient. Multivariate linear regression analysis was performed to control for age, gender and race and docu-ment the correlation between VFD and the retinal
thick-nesses in the corresponding regions. p value of <0.05 was
deemed significant.
Results
Page 4 of 10 Hassan et al. Int J Retin Vitr (2017) 3:27
were Asian (75%). Other races included Caucasians (16.7%) and Africans (8.3%). All participants had best corrected visual acuity of 20/20. The average CRT
was 252.8 ± 26.2 µm. Five subjects (10 eyes) in the
study were myopics with mean spherical equivalent of
−4.97 ± 1.97 D. None of the subjects in the study were
hyperopic.
In the macular region, VFD was measured at both SRP and DRP. The SRP consists of large arterioles branching form the major vascular arcades and further divide into smaller arterioles which give rise to the superficial capil-lary network. DRP was noted to be a homogenous net-work of capillaries.
The mean VFD in the 5 macular sectors at the level of
the SRP was 43.5% (±4.5%), whereas the mean VFD at
the level of the DRP was 45.8% (±5.0%). Figure 3 shows
a comparison of mean VFD in the SRP and DRP in the five sectors of the grid. The mean difference in the mean VFDs between SRP and DRP was statistically significant in all sectors (p < 0.001). The mean VFDs in the DRP
were significantly higher in all sectors except the foveal region where it was significantly lower.
A significant negative correlation of age with
parafo-veal VFD was seen at both the SRP and DRP [R = −0.26
(p = 0.006) and −0.182 (p = 0.008) respectively].
How-ever, there was no correlation of age with foveal VFD.
Table 1 outlines the results of regression analysis to
correlate mean VFDs with mean retinal thicknesses in the macular sectors when controlled for age, gender and race. The mean VFD in the central 1 mm was strongly
correlated with the CRT in both SRP and DRP [R = 0.29
(p < 0.001) and 0.29 (p < 0.001) respectively]. Figure 4a,
b shows scatter plots showing correlation between CRT and VFD in the central 1 mm after controlling for age, race and gender.
VFD of subjects with myopia (6 subjects) was cor-related with the spherical equivalents of the subjects. A negative correlation was found between spherical equiv-alents and the mean VFD in the parafoveal region at
both the SRP and DRP [R = −1.14 (p < 0.05) and −0.67
Fig. 2 a Macular sectors for VFD analysis: a fovea, b superior, c nasal, d inferior, e temporal. b Peripapillary sectors for VFD analysis: a temporal, b
(p < 0.05) respectively] (Fig. 4c, d). There was no correla-tion found between spherical equivalent and VFD in the foveal region. Mean VFD in myopics was also compared to emmetropic subjects. Mean VFD in myopics was found to be significantly lower in the parafoveal region of
the DRP (Table 2). This was more significant in the
para-foveal nasal and temporal region (Table 2).
The area of FAZ was measured at the level of both SRP and DRP. In all the eyes the shape of FAZ was slightly irregular with considerable variation is the area between different individuals. Within subjects the mean size of FAZ was significantly larger and less well defined in DRP
compared to the SRP [0.33 mm2 (±0.15) and 0.47 mm2
(±0.15) respectively, p < 0.05]. The area of FAZ
con-trolled for age, gender and race, was negatively correlated
with foveal VFD in SRP (regression coefficient = −45.8,
p < 0.001). Similarly, negative correlation was also found between foveal VFD and area of FAZ controlled for age,
gender and race in DRP (regression coefficient = −50.9,
p < 0.001). The area of FAZ controlled for age, gender and race, in SRP and DRP was also negatively correlated
with CRT [R = −96.5 (p < 0.001) and −117.2 (p < 0.001)
respectively]. There was no statistically significant dif-ference in area of FAZ between myopics and emme-tropics. Additionally, linear regression demonstrated no
significant correlation between area of FAZ and spherical equivalent in eyes with myopia.
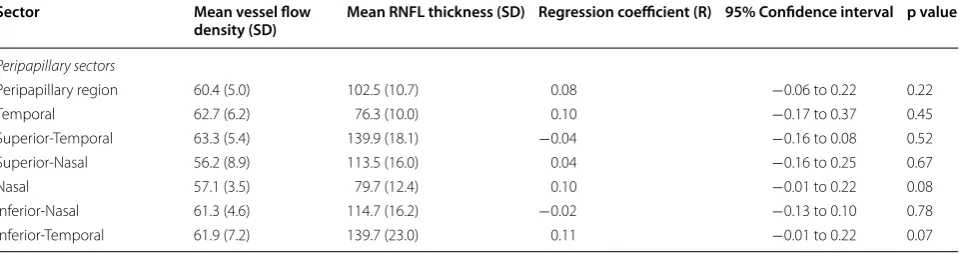
The mean VFD in the peripapillary region was 60.4%
(±5.0%). Table 3 shows mean values of peripapillary
VFD in the six sectors based on the Garway-Heath map. Mean RNFL thickness in the peripapillary region was
102.5 µm (±10.7 µm). No significant correlation was
found between the mean VFD in all the six sectors and the mean RNFL thickness in the corresponding areas.
Discussion
Retinal microvasculature is the target of a variety of reti-nal diseases ranging from inflammatory to occlusive in
nature [18]. OCTA allows capturing of high-resolution
images of the retinal microvasculature without the use of contrast.
In this study, we qualitatively and quantitatively assessed OCTA scans of healthy eyes in the macular and peripapillary regions. There was a significant correlation between retinal thickness and VFD in the foveal region. Spherical error in subjects with myopia was found to be negatively correlated to vessel flow density in the para-foveal region. In the peripapillary region, VFD was not found to correlate with RNFL thickness in sectors based
on Garway-Heath map. Savastano et al. [8] effectively
Page 6 of 10 Hassan et al. Int J Retin Vitr (2017) 3:27
Table 1 C orr ela tion of cen tr al r etinal thick ness ( CRT ) with sup er ficial r etinal ple xus
VFD or deep r
etinal ple
xus
VFD in
the macular sec
tors when con tr olled for age , gender , and r ac e
p-value is sig
nifican
t (p < 0.05)
Sec tors Super ficial r etinal ple xus Deep r etinal ple xus M ean r etinal thick ness µm (SD ) M ean v essel flo w densit y % (SD ) Reg ression coefficien t (R) 95% C onfidenc e in ter val p v alue M ean r etinal thick ness µm (SD ) M ean v essel flo w densit y % (SD Reg ression coefficien t (R) 95% C onfidenc e in ter val p v alue
Macular sectors Fove
described in detail the retinal vascular morphology in healthy eyes as assessed by the OCTA. Similar to our study they were able to differentiate and describe mor-phology of two separate vascular plexuses.
With the advent of the ability to image the retinal vas-culature at different levels, it was important to find a way to quantify the presence of the vessels. Shahlaee
et al. [16] utilized automated thresholding of the Image
J software version 1.49 (National Institutes of Health, Bethesda, Maryland, USA) to assess the VFD in the foveal and parafoveal region. In this study, mean VFD reported in the parafoveal region was slightly lower than our study both at the level of SRP and DRP (45.96 and 51.57% respectively) compared to our study. This differ-ence may be attributed to a slightly different algorithm used in our study. The thresholding algorithm converts the images of the vascular network into binary images and defines vessels as pixels above a certain threshold level. Thus, smaller capillaries which might fall below the threshold are not counted in the density
measure-ment. Gadde et al. [15] utilized an automated local
Fig. 4 a, bScatter plots depicting correlation between VFD and CRT in both superficial and deep retinal plexuses in the foveal region. c, dScatter plots depicting correlation between VFD and spherical equivalent of subjects with myopia in both superficial and deep retinal plexuses in the para-foveal region. The graphs depict scatter of actual values around a predicted line plot showing strength of the prediction model
Table 2 Comparison of VFD between myopics and emme-tropics at the level of superficial and deep retinal plexuses
p-value is significant (p < 0.05)
Sectors Emmotropics
(n: 14) Myopics(n: 10) p value
Mean SD Mean SD
Superficial retinal plexus density
Fovea 28.99 2.68 32.70 0.83 0.27 Parafoveal-Superior 57.32 0.72 57.86 0.96 0.65 Parafoveal-Nasal 55.82 0.94 54.23 1.11 0.29 Parafoveal-Inferior 57.94 1.03 56.46 1.41 0.39 Parafoveal-Temporal 56.60 0.57 54.53 1.62 0.19 Parafovea (combined) 56.92 0.71 55.77 1.17 0.38
Deep retinal plexus density
Page 8 of 10 Hassan et al. Int J Retin Vitr (2017) 3:27
fraction dimension method to quantify VFD in OCTA. Similar to our findings, they found significant difference in VFD between SRP and DRP. In contrast to our study they reported that mean VFD in the peripapillary area was not affected by age. In another study swept source OCT optical microangiography was used to report the
VFD in the macular region [17]. In this study the VFD at
the level of SRP was reported to be higher (67.3%) com-pared to the DRP (34.5%). This result is in contrast to our study where the mean VFD is significantly higher in DRP (63.6%) compared to SRP (56%). The difference can be accounted for by the use of the semiautomatic color selection tool of GNU Image Manipulation Program for vessel selection by Kuehlewein et al. Since vessels in the DRP are more densely packed, the image manipulation software was unable to resolve between closely packed networks of capillaries. Both of these studies utilize the margin of FAZ to define the central circle, which is then subsequently excluded from the density calculations. In contrast the grid used in our study has a standard 1 mm central circle. We noted that the VFD in this central 1 mm was significantly correlated with CRT. As the CRT increases, the inner retinal layers are more compactly arranged and there is continuity of the INL, which there-fore corresponds to a higher VFD in the central 1 mm in these eyes. Similarly, when the thickness decreases, the inner retinal layers are less compact and there is discon-tinuity of the INL, which corresponds to a lower VFD
(Fig. 5).
In our study, there was a negative correlation between spherical error and VFD in the parafoveal region of eyes with myopia. Furthermore, compared to normal sub-jects the VFD was significantly lower in the parafoveal region of DRP of subjects with myopia. Similar to our study, Wang et al., did not find any significant difference between VFD in the SRP between myopics and
emme-tropics [19]. In another study, retinal layers of the
macu-lar region of subjects with myopia were segmented and
compared to emmetropic subjects [20]. The results of
the study demonstrated thinning of INL in patients with myopia and thickening of the Henle fiber layer and outer nuclear layer, myeloid and ellipsoid zone and outer seg-ment of photoreceptors. This can explain the significant decrease in VFD we noted at the level of DRP, which is located at level of INL. We speculate that the decrease in retinal VFD at level of DRP can be one of the factors for retinal thinning of this region. However, we were unable to detect any difference in retinal thickness in subjects with myopia compared to normal. This can be because there is concomitant thickening and thinning of different retinal layers in myopics. Therefore, overall the change in total retinal thickness is small which was not detectable because of our small sample size.
The morphology and size of FAZ has been an area of
interest in multiple studies. Samara et al. [21] extensively
described the morphology of FAZ imaged using OCTA. Similar to what was noted in our study, shape of the FAZ was slightly irregular in all the eyes and the size of FAZ was larger and more irregular in the DRP compared to the SRP. They used ImageJ software to manually demar-cate and measure the area of FAZ. This can be the rea-son that the mean area of FAZ noted in their study was
slightly smaller in the superficial plexus (0.26 mm2)
com-pared to our results (0.33 mm2). The size of the FAZ at
level of DRP noted in their study was 0.46 mm2 which
was very similar to what we noted (0.47 mm2). They also
demonstrated an inverse correlation between area of FAZ and CRT. In our study we compared the area of FAZ and VFD in the central 1 mm and they were found to be inversely related. Both of the findings can be explained by the fact that as the CRT increases, the inner retinal layers are more compactly arranged and there is continuity of
the INL in the foveal region (Fig. 5). Gade et all, in their
algorithm demarcated FAZ with a continuous circle. [15]
This means their FAZ measurements included some mar-ginal vessels which would fall within that defined circle. Table 3 Correlation of RNFL thickness with VFD at level of superficial or deep retinal plexuses of retina in the peripapil-lary sectors when controlled for age, gender, and race
Sector Mean vessel flow
density (SD) Mean RNFL thickness (SD) Regression coefficient (R) 95% Confidence interval p value
Peripapillary sectors
Peripapillary region 60.4 (5.0) 102.5 (10.7) 0.08 −0.06 to 0.22 0.22
Temporal 62.7 (6.2) 76.3 (10.0) 0.10 −0.17 to 0.37 0.45
Superior-Temporal 63.3 (5.4) 139.9 (18.1) −0.04 −0.16 to 0.08 0.52 Superior-Nasal 56.2 (8.9) 113.5 (16.0) 0.04 −0.16 to 0.25 0.67
Nasal 57.1 (3.5) 79.7 (12.4) 0.10 −0.01 to 0.22 0.08
Hence expectedly the mean FAZ area noted by them
was marginally larger in both SRP (0.35 mm2) and DRP
(0.49 mm2) compared to our study (0.33 and 0.47 mm2
respectively).
OCTA provides an effective way to visualize the vessels in the peripapillary region. This allows us to comment on their changes in morphology and VFD in various
condi-tions. Liu et al. [22] demonstrated that peripapillary VFD
is significantly decreased in glaucomatous eyes compared
to the normal subjects (p < 0.001). Hollo et al. [23]
meas-ured VFD in superotemporal, temporal and inferotempo-ral peripapillary sectors and found a significant decrease in VFD in superotemporal and inferotemporal areas
in glaucomatous eyes. Wang et al. [19] demonstrated a
negative correlation between peripapillary vessel density and the grade of myopia. All of these studies underscore the value of measuring the VFD in peripapillary region. However, none of these studies reported VFD in the all the six sectors of the Garway-Heath map as reported in our study. Utilizing such a map would effectively allow us to measure changes in VFD in disease affecting the peri-papillary region in each of sector and correlate the find-ings to the changes in RNFL thicknesses in each sector. In our study, the mean VFD in the peripapillary region
was 60.4% (±5.0%). We did not any significant correlation
between the VFD and RNFL thickness in normal popula-tion which can be secondary to our small sample size.
Even though we utilized standardized sector maps to measure VFDs via automated tools, potential limitations of our study included a small sample size. In addition, the measurement tool does not allow us to manually correct the measurements of FAZ, this may lead to errors in detec-tion of FAZ boundaries in cases where images of low qual-ity are analyzed. Our VFD measurements were limited to the SRP and DRP as we utilized the automated VFD meas-uring tool of the software which doesn’t automatically seg-ment the intermediate capillary plexus of the retina.
Conclusion
In conclusion, OCTA is an emerging noninvasive tool for imaging and quantifying retinal vasculature at the level both SRP and DRP and areas of non-perfusion such as FAZ. Utilizing standard sectors to measure VFD in macular and peripapillary region allows application of a uniform method to measure VFD in multiple conditions. Hence, VFD can be utilized as a standard outcome meas-ure to monitor macular diseases and assess the effect of various therapies used for their management. In normal subjects, we found that the VFD in DRP is significantly higher than the superficial retinal plexuses, and VFD in the foveal region strongly correlates with central reti-nal thickness. Retireti-nal thinning at level of INL in myopia may also be explained by a decrease in retinal VFD in the region.
Fig. 5 Correlation between greater CRT and greater VFD in central 1 mm and smaller area of FAZ in 3 healthy subjects. a– c OCTA of the macula (above) with the corresponding OCTA scans at level of superficial retinal plexuses (below). a CRT of 298 mm with high VFD of 45.2% and small FAZ area of 0.105 mm2. b CRT of 234 mm with lower VFD of 34.3% and larger FAZ area of 0.304 mm2. c CRT of 207 mm with lowest VFD of 16.6% and
largest FAZ area of 0.629 mm2. In the thickest fovea (a), there is continuity of inner nuclear layer and ganglion cell layer over the foveolar center. In
Page 10 of 10 Hassan et al. Int J Retin Vitr (2017) 3:27
Abbreviations
CRT: central retinal thickness; DRP: deep retinal plexus; ETDRS: Early Treatment of Diabetic Retinopathy Severity; FAZ: foveal avascular zone; ILM: internal limiting membrane; IPL: inner plexiform layer; IRP: intermediate retinal plexus; OCTA: optical coherence tomography angiography; RPC: radial peripapillary capillaries; SRP: superficial retinal plexus; VFD: vessel flow density.
Authors’ contributions
MH: Study concept and design, acquisition of data, analysis and interpretation, manuscript drafting and revising. MAS: Analysis and interpretation, manuscript critical review and revision. MSH: Analysis and interpretation, manuscript writing and revision. RA: Acquisition of data, manuscript writing. MKS: Study Design, data interpretation. SS: Study Design, acquisition of data. AA: Study concept, manuscript review and revision. QDN: Study Concept and Design, Interpretation, approval to publish. DD: Study concept, Interpretation of data. YJS: Study Concept and Design, manuscript revision, final approval to publish. All authors read and approved the final manuscript.
Author details
1 Department of Ophthalmology, Byers Eye Institute, Stanford University, Palo Alto, CA 94303, USA. 2 Ocular Imaging Research and Reading Center, Menlo Park, CA, USA. 3 Post Graduate Institute of Medical Education and Research, Chandigarh, India.
Acknowledgements None.
Competing interests/funding
QDN is a recipient of a Physician Scientist Award from Research to Prevent Blindness, New York, NY. QDN is a consultant for Santen, and has received research support from Genentech, Santen, Ophthotech, and Regeneron, and has institutional consulting agreement with AbbVie, and honorarium from Bayer and XOMA. QDN also chairs the Steering Committee for the RISE and RIDE Study, and is on the Steering Committee for the VISTA Study, and other studies sponsored by Genentech and Regeneron. DVD is a consultant for Genentech, Regeneron, Santen and Allergan and she has received research support from Genentech and Regeneron, and Santen. DVD also chairs the Steering Committee for the VISTA Study. YJS is a consultant for Genentech and Astellas, and he has received research support from Genentech and Optovue. No other authors have received any financial funding or support.
Availability of data and materials
The datasets used during the current study are available from the correspond-ing author on request.
Ethics approval and consent to participate
The local Institutional Review Board approved the research on healthy volun-teers. The study was conducted in compliance with the declaration of Helsinki, US Code of Federal Regulations Title-21, and the Harmonized Tripartite Guidelines for Good Clinical Practice (1996). A written informed consent was obtained from all participants of the study.
Publisher’s Note
Springer Nature remains neutral with regard to jurisdictional claims in pub-lished maps and institutional affiliations.
Received: 13 March 2017 Accepted: 8 May 2017
References
1. Yu DY, Cringle SJ. Oxygen distribution and consumption within the retina in vascularised and avascular retinas and in animal models of retinal disease. Prog Retin Eye Res. 2001;20:175–208.
2. Yu DY, Cringle SJ, Su EN. Intraretinal oxygen distribution in the monkey retina and the response to systemic hyperoxia. Invest Ophthalmol Vis Sci. 2005;46:4728–33.
3. Snodderly DM, Weinhaus RS, Choi JC. Neural-vascular relationships in central retina of macaque monkeys (Macaca fascicularis). J Neurosci. 1992;12:1169–93.
4. Chan G, Balaratnasingam C, Yu PK, Morgan WH, McAllister IL, Cringle SJ, Yu DY. Quantitative morphometry of perifoveal capillary networks in the human retina. Invest Ophthalmol Vis Sci. 2012;53:5502–14.
5. Pournaras CJ, Rungger-Brandle E, Riva CE, Hardarson SH, Stefansson E. Regulation of retinal blood flow in health and disease. Prog Retin Eye Res. 2008;27:284–330.
6. Tick S, Rossant F, Ghorbel I, Gaudric A, Sahel JA, Chaumet-Riffaud P, Paques M. Foveal shape and structure in a normal population. Invest Ophthalmol Vis Sci. 2011;52:5105–10.
7. Marmor MF, Ravin JG. Fluorescein angiography: insight and serendipity a half century ago. Arch Ophthalmol. 2011;129:943–8.
8. Savastano MC, Lumbroso B, Rispoli M. In vivo characterization of retinal vascularization morphology using optical coherence tomography angi-ography. Retina. 2015;35:2196–203.
9. Jia Y, Tan O, Tokayer J, Potsaid B, Wang Y, Liu JJ, Kraus MF, Subhash H, Fujimoto JG, Hornegger J, Huang D. Split-spectrum amplitude-decor-relation angiography with optical coherence tomography. Opt Express. 2012;20:4710–25.
10. Rispoli M, Savastano MC, Lumbroso B. Capillary network anomalies in branch retinal vein occlusion on optical coherence tomography angiog-raphy. Retina. 2015;35:2332–8.
11. Kuehlewein L, Dansingani KK, de Carlo TE, Bonini Filho MA, Iafe NA, Lenis TL, Freund KB, Waheed NK, Duker JS, Sadda SR, Sarraf D. Optical coher-ence tomography angiography of type 3 neovascularization secondary to age-related macular degeneration. Retina. 2015;35:2229–35. 12. Agemy SA, Scripsema NK, Shah CM, Chui T, Garcia PM, Lee JG, Gentile RC,
Hsiao YS, Zhou Q, Ko T, Rosen RB. Retinal vascular perfusion density map-ping using optical coherence tomography angiography in normals and diabetic retinopathy patients. Retina. 2015;35:2353–63.
13. Miwa Y, Murakami T, Suzuma K, Uji A, Yoshitake S, Fujimoto M, Yoshitake T, Tamura Y, Yoshimura N. Relationship between functional and structural changes in diabetic vessels in optical coherence tomography angiogra-phy. Sci Rep. 2016;6:29064.
14. Cheng L, Chen X, Weng S, Mao L, Gong Y, Yu S, Xu X. Spectral-domain optical coherence tomography angiography findings in multifocal cho-roiditis with active lesions. Am J Ophthalmol. 2016;169:145–61. 15. Gadde SG, Anegondi N, Bhanushali D, Chidambara L, Yadav NK, Khurana
A, Sinha Roy A. Quantification of vessel density in retinal optical coher-ence tomography angiography images using local fractal dimension. Invest Ophthalmol Vis Sci. 2016;57:246–52.
16. Shahlaee A, Samara WA, Hsu J, Say EA, Khan MA, Sridhar J, Hong BK, Shields CL, Ho AC. In vivo assessment of macular vascular density in healthy human eyes using optical coherence tomography angiography. Am J Ophthalmol. 2016;165:39–46.
17. Kuehlewein L, Tepelus TC, An L, Durbin MK, Srinivas S, Sadda SR. Noninva-sive visualization and analysis of the human parafoveal capillary network using swept source OCT optical microangiography. Invest Ophthalmol Vis Sci. 2015;56:3984–8.
18. Chakravarthy U, Gardiner TA. Endothelium-derived agents in pericyte function/dysfunction. Prog Retin Eye Res. 1999;18:511–27.
19. Wang X, Kong X, Jiang C, Li M, Yu J, Sun X. Is the peripapillary retinal perfusion related to myopia in healthy eyes? A prospective comparative study. BMJ Open. 2016;6:e010791.
20. Liu X, Shen M, Yuan Y, Huang S, Zhu D, Ma Q, Ye X, Lu F. Macular thickness profiles of intraretinal layers in myopia evaluated by ultrahigh-resolution optical coherence tomography. Am J Ophthalmol. 2015;160(53–61):e52. 21. Samara WA, Say EA, Khoo CT, Higgins TP, Magrath G, Ferenczy S, Shields
CL. Correlation of foveal avascular zone size with foveal morphology in normal eyes using optical coherence tomography angiography. Retina. 2015;35:2188–95.
22. Liu L, Jia Y, Takusagawa HL, Pechauer AD, Edmunds B, Lombardi L, Davis E, Morrison JC, Huang D. Optical coherence tomography angiog-raphy of the peripapillary retina in glaucoma. JAMA Ophthalmol. 2015;133:1045–52.