RESEARCH ARTICLE
Hygro-mechanical response of oak wood
cabinet door panels under relative humidity
fluctuations
R. A. Luimes
1, A. S. J. Suiker
1*, A. J. M. Jorissen
1, P. H. J. C. van Duin
2and H. L. Schellen
1Abstract
Indoor climate fluctuations are regarded as one of the major risks for the emergence of damage in historical works of art. For a safe preservation of their art objects museums try to minimize this risk, which is typically done by impos-ing strict limitations on the indoor temperature and humidity conditions. The high energy demand resultimpos-ing from this approach, however, undermines the aim of preeminent museums to execute a sustainable preservation strategy of their collections. A rational improvement of this aspect asks for detailed information on the history of museum objects, complemented by a thorough comprehension of the failure and deformation behaviour of museum objects under indoor climate fluctuations. Accordingly, in this paper the hygro-mechanical response of mock-ups of historical Dutch cabinet door panels made of oak wood is examined under several relative humidity variations. In specific, the mock-ups were subjected to (i) an instantaneous decrease of 40% relative humidity, (ii) eight successive, instantane-ous drops of 5% relative humidity, and (iii) a varying relative humidity profile ranging between 35 and 71%. The shrink-age characteristics of mock-ups are translated to their damshrink-age susceptibility using an analytical hygro-mechanical bi-layer model. This model shows that restrained hygral shrinkage may originate from: (i) a difference in moisture content across the thickness direction of the panel, or (ii) a directional difference in the coefficient of hygroscopic expansions of structural components forming a coherent connection. The first type of shrinkage occurs in the outer regions of the panel thickness, while the second type of shrinkage takes place at the cleated ends. Further, by accounting for the age-dependency of the fracture strength of oak wood, a clear distinction can be made between the damage susceptibility of new door panels and historical door panels present in museum cabinets. The six main conclusions of the experimental study—conveniently summarized at the end of this paper—provide a scientific basis for the understanding of shrinkage cracks and dimensional changes observed on decorated oak wooden panels in historical Dutch cabinets, and thus may assist in advising museums on future sustainable preservation strategies and rational guidelines for indoor climate specifications.
Keywords: Historical museum objects, Mock-ups, Restrained hygral shrinkage, Damage resistance, Sustainable preservation
© The Author(s) 2018. This article is distributed under the terms of the Creative Commons Attribution 4.0 International License (http://creat iveco mmons .org/licen ses/by/4.0/), which permits unrestricted use, distribution, and reproduction in any medium, provided you give appropriate credit to the original author(s) and the source, provide a link to the Creative Commons license, and indicate if changes were made. The Creative Commons Public Domain Dedication waiver (http://creat iveco mmons .org/ publi cdoma in/zero/1.0/) applies to the data made available in this article, unless otherwise stated.
Open Access
*Correspondence: [email protected]
1 Department of the Built Environment, Eindhoven University
Introduction
The protection and preservation of works of art is important, as these objects constitute a significant part of our cultural heritage. Museums are responsible for safely preserving works of art and making their collec-tions accessible to the public. This task is challenging: Indoor climate fluctuations, often caused by the enter-ing public, may induce undesirable deformations and damage in the displayed objects, and therefore form a major concern to conservators and curators. Since the late nineteenth century the environmental control of museums has developed substantially, which, from the 1970s until the end of the twentieth century, has led to the formulation of specific conditions for indoor tem-perature and relative humidity fluctuations [1, 2]. In order to prevent climate-induced damage of susceptible art objects, these environmental guidelines prescribe strict limitations on indoor climate conditions. This results in a low risk preservation of susceptible collec-tions, at the expense of high energy demands and costs. Only since the beginning of the twenty-first century museums tend to strive for a more sustainable collec-tion management, by exploring whether strict indoor climate conditions can be relaxed without introducing an unacceptable risk of damage. Within the conserva-tion community, this approach has been intensively debated [3–8], whereby three distinct positions are taken [1], based on (i) precautionary safety, (ii) proven safety and (iii) pragmatic risk management. To support the debate and find consensus among the distinct posi-tions on sustainable collection management, additional
scientific research on the origin of climate-induced damage of museum objects is of utmost importance [1,
9].
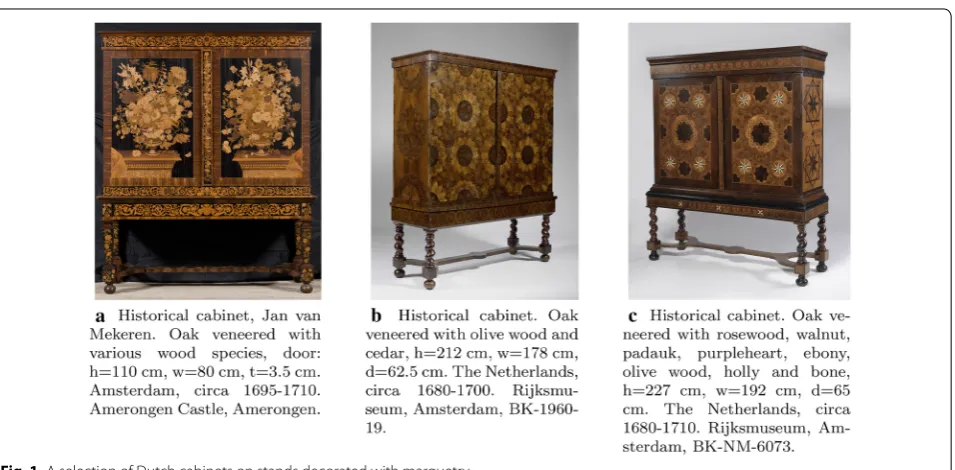
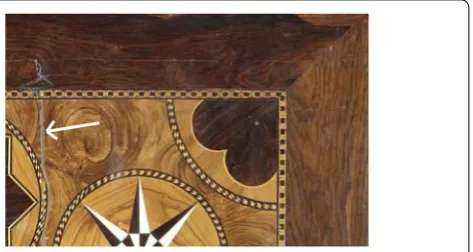
Recently, various research efforts aimed at understand-ing and improvunderstand-ing preservation procedures for historical works of art. For example, the Furniture Conservation Department of the Rijksmuseum has carried out sev-eral challenging conservation treatments on cabinets on stands decorated with marquetry [10, 11]. During the late seventeenth century these cabinets were very popular in the Netherlands, because of the magnifi-cent, decorative surface layers applied on the large flat doors, see Fig. 1. In 2010, the Rijksmuseum organized a masterclass in which 17 pairs of Dutch seventeenth-cen-tury cabinet doors were studied extensively [10]. Despite the variety in substrate structures and construction methods used, all doors showed shrinkage cracks, see Fig. 2, and some doors were slightly warped. Inspired by these observations, a combined experimental–numeri-cal study was initiated regarding the influence of histori-cal and current indoor climate variations within a castle on the risk of damage to historical wooden door panels, see [12]. From similar grounds, the behaviour of two historical wooden pianofortes under mechanical and hygral loading was analysed numerically in [13], provid-ing detailed insight into the damage observed on these objects. The mechanical interactions between the pop-lar substrate and the frame of the Mona Lisa, painted by Leonardo da Vinci, were experimentally investigated in [14]. The hygro-mechanical performance of the paint-ing was determined, from which an estimation could be
made of the appropriateness of the climate conditions applied in the exhibition room. The research reported in [15] focused on monitoring the dimensional response of an altarpiece located in a church in Italy, which made it possible to advise on the specific settings of the heating system used in the church. In [16–18], experimental tests were combined with numerical modelling to characterize the fatigue behaviour of mock-ups of single board panel paintings under sinusoidal, relative humidity fluctua-tions. In [19] mock-ups of panel paintings were subjected to step variations of the ambient relative humidity, in order to obtain detailed insight into their hygro-mechan-ical response.
In addition to research performed on specific objects, the ongoing debate within the conservation community regarding appropriate sustainable museum environ-ments also revealed the need to provide the preservation of large museum collections with a firm, scientific basis [9, 20]. For this purpose, several long-term, multidisci-plinary research projects were initiated, like the Man-aging Collection Environments Initiative by the Getty
Conservation Institute [21], and the Climate4Wood
project by the Eindhoven University of Technology, Delft University of Technology, Rijksmuseum and Cul-tural Heritage Agency of the Netherlands [22, 23]. The first project addresses compelling research questions related to the control and management of museum envi-ronments suitable for susceptible collections [21]. The response of hygroscopic materials and objects has been studied under climate fluctuations, and epidemiology [24] has been applied to susceptible objects in order to identify how the object condition or the adverse effect of the environment appears within large museum col-lections. In the second project the material properties,
indoor climate conditions, and type of construction of decorated oak wood panels present in the Rijksmuseum collection are investigated by combining an extensive museum study with advanced numerical modelling and dedicated laboratory and in-situ experiments [23]. From the museum study a large amount of data was collected in a systematic fashion; these data has been used (i) as input for experimental, numerical and in-situ studies on oak wood panels, and (ii) for constructing a reference case that can be employed for determining the condition of similar collections present in other museums. In addi-tion, the possibility of a causal connection between the panel characteristics and the climate history of objects has been explored.
B” and the “Experimental results mock-ups C, D, E and F” sections treat the experimental results for the differ-ent mock-ups, analysing the time evolution of the panel deformations, the origin of restrained hygral shrinkage, and the risk of damage. Also, the development of the moisture profiles in the mock-ups is analysed. The six main conclusions of the experimental study are outlined in the “Conclusions” section.
Experimental program
The damage observed on door panels of historical Dutch cabinets is illustrated in Fig. 2, and, as reported in [10,
25], may be induced by indoor climate fluctuations.
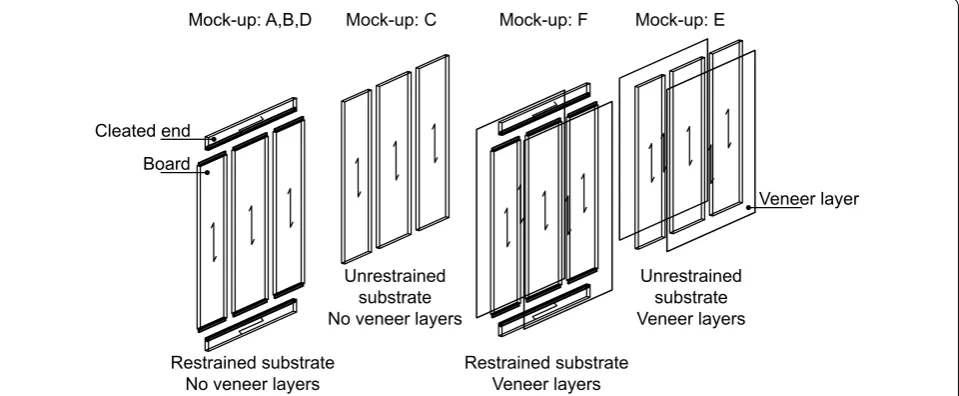
The present work aims at gaining more insight into this aspect, by performing an experimental program in which the deformation response and damage resistance of mock-ups of cabinet door panels under relative humidity fluctuations is analysed. Two mock-ups—referred to as mock-ups A and B—were subjected to a single decrease and multiple stepwise decreases in relative humidity, respectively, and four ups—referred to as mock-ups C to F—were exposed to a varying relative humid-ity profile ranging between 35 and 71%. Mock-ups C to F also consider the influence of the presence of cleated ends and veneer layers on the panel response, as illus-trated in Fig. 3.
Mock‑ups
Historical Dutch cabinet doors typically consist of an oak wood substrate that is covered by veneer layers, mould-ings and/or a surface coating, see Fig. 1. The substrate comprises several quarter-sawn oak boards, which are
connected to form a flat structure. The veneer layers are applied plain or as marquetry, and consist of specific wood species, possibly combined with other materials, such as bone, turtle shell and ivory. The characteristics of the historical Dutch cabinet doors were systematically documented in the Rijksmuseum study [23]. This pro-vided a useful source of information for the geometrical design of mock-ups A to F, see Fig. 3, and for the wood species, type of joints and type of veneer layers used. One practical limitation that had to be overcome related to the dimensions of the mock-up, which were restricted by the size of the climate chamber and by the limited thick-ness of the oak boards provided. Since this reduction in dimension was only small, the mock-up dimensions may be nevertheless considered as representative of door pan-els commonly present in historical cabinets.
Mock-ups A, B and D were composed of an oak sub-strate restrained by cleated ends, which does not have veneer layers attached to the front and back sides, see Fig. 3. The substrate was composed of five boards, where three boards were placed side by side with parallel grain directions. Two smaller boards, i.e., the cleated ends, were placed at the top and bottom sides of these three boards. The grain direction of the cleated ends was ori-ented perpendicular to the grain direction of the three boards. The three parallel boards were connected by a butt joint with animal glue, while the cleated ends were connected to the three boards by a tongue-and-grove joint with animal glue.
For mock-ups C to F the substrate was constructed in a similar fashion as described above. The effect by the cleated ends on the panel behaviour was considered by
Restrained substrate No veneer layers
Unrestrained substrate No veneer layers Cleated end
Board
Veneer layer
Mock-up: A,B,D Mock-up: C Mock-up: F Mock-up: E
Restrained substrate Veneer layers
Unrestrained substrate Veneer layers
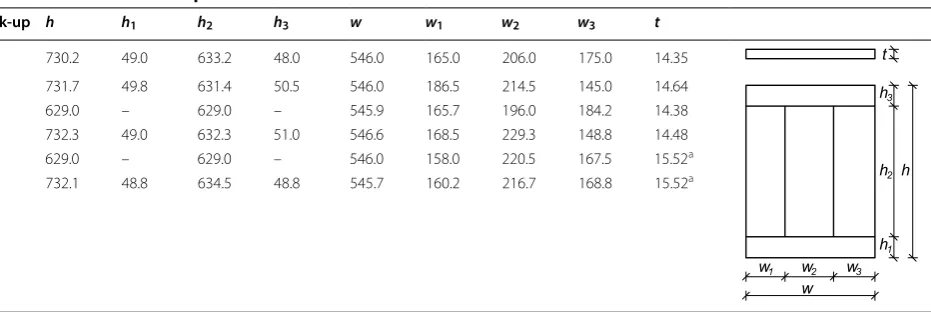
selecting restrained (i.e., cleated ends present) and unre-strained (i.e., cleated ends absent) oak substrates, see Fig. 3, and comparing the responses of mock-ups C and D, and mock-ups E and F. This selection was motivated from the museum study reported in [25], where for the historical door panels analysed these two types of sub-strates typically showed to have the most and least dam-age, respectively. In addition, the influence of plain teak veneer layers on the panel response was studied by con-sidering two cases: (i) a mock-up with an unrestrained (C) or a restrained (D) substrate, but without veneer layers and (ii) a mock-up with an unrestrained (E) or a restrained (F) substrate with veneer layers at both the front and back sides. The grain directions of the veneer layers coincided with those of the three oak wooden boards below. The dimensions of mock-ups A to F are listed in Table 1.
Preparation mock‑ups
The mock-ups were composed of oak boards provided by the University of Amsterdam, Faculty of Humanities, Department of Arts & Culture. The boards were stored for at least 10 years in the Ateliergebouw of the Rijks-museum, Amsterdam at a temperature of 20◦C±2◦C and a relative humidity of 50%±5% in the winter and 55%±5% in the summer. The boards were quarter-sawn,
had a relatively small annual ring width between 2 and 7 mm, and almost had no imperfections, thereby accurately mimicking the high-quality characteristics of historical cabinet doors. The animal glue used for the joints and the attachment of the veneer layers to the oak substrate was composed of a solution of bone and hide glue in a ratio one to one. The water to glue ratio of the solution was two to one.
The mock-ups were made by a senior furniture conser-vator at the Department of Conservation and Scientific Research of the Rijksmuseum, Amsterdam. After con-struction, the mock-ups were kept in the Ateliergebouw of the Rijksmuseum, Amsterdam in a stable indoor cli-mate (temperature of 20◦C±2◦C and relative humidity of 50%±5% in the winter and 55%±5% in the summer).
For the performance of the experimental tests, the mock-ups were transported to the climate chamber of the Structures Laboratory of the Eindhoven University of Technology, where they were kept at a temperature of 20◦C±2◦C and a relative humidity of 60%±5% for about three months. Prior to testing, the measurement devices where attached to the mock-ups, after which the mock-ups were included in the test set-up.
Test set‑up
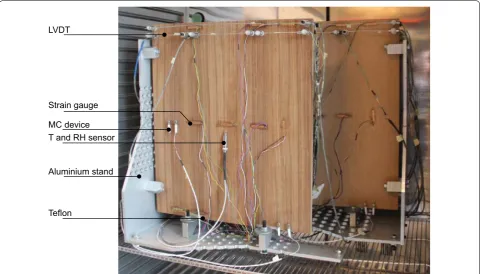
The experimental tests were performed in a Memmert ICH750 climate chamber at the Building Physics Labo-ratory of the Eindhoven University of Technology. The dimensions of the climate chamber are such that a homo-geneous indoor climate could be ensured during testing. The mock-ups were placed in a custom-made stand in the middle of the climate chamber, whereby all surfaces were freely exposed to the surrounding air, see Fig. 4. Two lay-ers of Teflon were placed between the mock-ups and the stand to minimize the contact friction. The wires of the measurement devices were conducted through a hole located at the backside of the climate chamber. Behind the climate chamber, the wires were connected to a data acquisition system that transmitted the measured data to a computer. The measurement time interval was set to 120 s, in order to follow the response of the mock-ups Table 1 Dimensions mock-ups
All measures are in millimetres. Note that the values not provided for h1 and h3 are due to the absence of cleated ends for the unrestrained mock-ups C and E
a The thickness of the veneer layers is equal to 0.5 mm
Mock‑up h h1 h2 h3 w w1 w2 w3 t
A 730.2 49.0 633.2 48.0 546.0 165.0 206.0 175.0 14.35 B 731.7 49.8 631.4 50.5 546.0 186.5 214.5 145.0 14.64
C 629.0 – 629.0 – 545.9 165.7 196.0 184.2 14.38
D 732.3 49.0 632.3 51.0 546.6 168.5 229.3 148.8 14.48 E 629.0 – 629.0 – 546.0 158.0 220.5 167.5 15.52a
F 732.1 48.8 634.5 48.8 545.7 160.2 216.7 168.8 15.52a h
h3
h2
h1 t
w w2
accurately while keeping the processing of the measure-ment data feasible.
Measurements
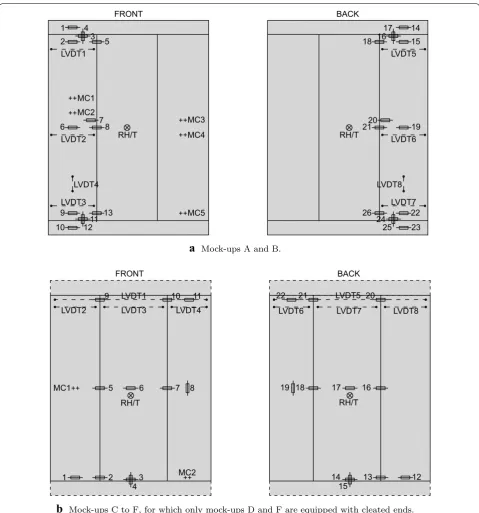
Various measurement devices were used in order to accurately capture the hygro-mechanical response of the mock-ups. The displacement, strain, moisture con-tent, temperature and relative humidity were monitored at a number of locations, see Fig. 5. Solartron SM3 lin-ear variable displacement transformers (LVDTs) were glued to the mock-up surfaces to measure local dis-placements. A calibration was performed to check the linearity of the LVDTs, which resulted in an accuracy of ±0.0075 mm . Tokyo Sokki Kenkyujo PFLW-30-11
strain gauges were selected to measure local strains. These special purpose strain gauges are designed for long-term measurements on wood exposed to humid conditions. A two-component hygroscopic PS polyes-ter adhesive was used to glue the strain gauges to the mock-up surfaces. The measuring of the moisture con-tent, which complies with EN 16682 [26], occurred at the half-depth of the mock-ups with a Brookhuis MCM Sensor (serial number 0302128), whereby the response was obtained from an indirect method based on the electrical resistance of the wood. Sorption experiments
were performed in order to calibrate the moisture con-tent sensor. The temperature and relative humidity in the climate room were determined by using Humit-ter 50U/50Y(X) sensors. The sensor accuracy obtained after calibration is ±0.6◦C and ±3% relative humidity.
The measurement devices for mock-ups A and B were located such that the response of the left board and the response at the glue joints with the adjacent board and cleated ends were captured in detail, whereby the main purpose was to gain more insight into local dimensional changes at connections and their relation to the loca-tion of possible shrinkage cracks, see Fig. 5a. Six LVDTs were placed in horizontal direction to measure the dis-placement in the radial material direction of the oak wood substrate (LVDT 1, 2 and 3 on the front surface and LVDT 5, 6 and 7 on the back surface). The LVDTs were located at the middle of the board and close to the cleated ends to analyse the restraining effect of the cleated ends on the deformation response of the panel. Two vertical LVDTs were used to measure the response in longitu-dinal material direction of the substrate (LVDT 4 and 8 on the front and back sides, respectively). In addition, a total of 26 strain gauges was used; 13 on the front side of the mock-up and 13 on the back side. The locations of the strain gauges were selected such that the following LVDT
MC device T and RH sensor
Aluminium stand
Teflon Strain gauge
aspects could be captured: The effect of the cleated ends on the deformation behaviour of the substrate, possible out-of-plane displacements of the substrate (warping), the orthotropic material behaviour of the oak wood sub-strate and the response at the glue joints. In addition,
four moisture content sensors were located at the centre of the left and right boards (MC 1 to 4), and one sensor was located at the right board, close to the cleated end (MC 5). Two temperature and relative humidity sensors (RH/T) were applied to measure the ambient climate
1 4
5
2 3
LVDT1
MC1
8
6 7
RH/T MC2
MC5 LVDT2
LVDT3 LVDT4
10 12
13 9
11
MC3 MC4
17 14
15 18 16
LVDT5
19 2120
RH/T LVDT6
LVDT7 LVDT8
25 23
22 26
24 K C A B T
N O R F
a
Mock-ups A and B.9
RH/T MC1
LVDT1 10 11
5 6 7 8
1 2 3
4
MC2
LVDT2 LVDT3 LVDT4
22
RH/T LVDT5
21 20
19 18 17 16
12 13
14 15
LVDT6 LVDT7 LVDT8
K C A B T
N O R F
b
Mock-ups C to F, for which only mock-ups D and F are equipped with cleated ends.conditions at the centre of the front and back surfaces of the mock-ups. Two additional temperature and relative humidity sensors were located halfway in between the mock-up surfaces and the front and back sides of the cli-mate chamber, in order to confirm that the clicli-mate estab-lished inside the climate chamber was homogeneous; this indeed appeared to be the case.
Compared to mock-ups A and B, the locations of the measurement devices for mock-ups C to F were chosen more uniformly across the panel, such that variations of the response across the specimen could be clearly identi-fied, see Fig. 5b. The mock-ups were equipped with eight horizontal LVDTs to measure the displacement in radial material direction (LVDT 1, 2, 3 and 4 on the front sur-face and LVDT 5, 6, 7 and 8 on the back sursur-face). The LVDTs were located close to the upper cleated end, one on each of the three vertical boards and one covering the total width of the mock-ups. Mock-ups C and E were equipped with 18 strain gauges (SG 1, 2, 5–11 on the front surface and SG 12, 13, 16–22 on the back surface) and mock-ups D and F were equipped with 22 strain gauges (SG 1–11 on the front surface and SG 12–22 on the back surface). The strain gauges were positioned on the boards and across the glue joints. Two moisture con-tent sensors (MC 1 and MC 2) were applied, one at the centre of the left board and one at the bottom of the right board. In addition, two temperature and relative humid-ity sensors (RH/T) were placed at the centre of the mock-ups, close to the front and back surfaces.
Time‑averaged strain
From the strain profile measured the time average is determined in order to facilitate the comparison of strain responses at different measurement locations and between different mock-ups. This measure gives a good indication of how a deformation on average has evolved in time. The time average of the strain ǫa is characterized
by the area under the strain-time curve, divided by the total time:
where ǫ = ˆǫ(t) is the total strain and t is the time.
Boundary conditions
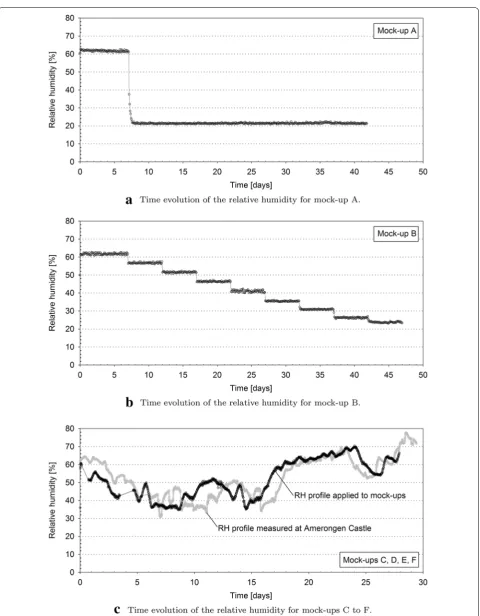
The relative humidity profiles applied to the mock-ups are depicted in Fig. 6. Mock-ups A and B were subjected to single and multiple stepwise decreasing relative humid-ity profiles, respectively, as depicted in Fig. 6a and b. The temperature was kept constant at 20◦C . For both pro-files the total drop in relative humidity is from 60 to 20%, with the total duration of the humidity profiles being
(1)
ǫa = 1 t
t
0
ˆ ǫ(t)dt,
comparable. These humidity changes obviously are larger than those currently defined as acceptable for indoor museum conditions; nonetheless, they are assumed to be representative of the more extreme, uncontrolled varia-tions experienced during manufacturing and the early history of the museum object. Mock-ups C to F were subjected to a continuously varying relative humidity profile (at a constant temperature of 20◦C ) illustrated in Fig. 6c. This humidity profile is based on measurement data obtained from the Grand Salon of the Amerongen Castle, located in Amerongen, The Netherlands. The measurement data were provided by the Chair of Build-ing Physics of the Eindhoven University of Technology, and were obtained by measuring the indoor climate in the Grand Salon from 2010 until 2014 [12]. During this 4-year period, the largest fluctuations in relative humidity were measured in the winter of 2012, from 26 January to 24 February, which were used as a basis for the humidity profile applied in the experiments. Note from Fig. 6c that the experimental relative humidity profile varies between 35 and 71%, and slightly differs from the measured profile in the Amerongen Castle; however, since the differences are small, the experimental profile may be assumed to be representative of the measured climate conditions. Con-sidering that cabinet door panels in museums typically are exposed to climate conditions that are much more strict, this humidity profile can be regarded as a serious test case for the damage resistance of door panels.
Experimental results mock-ups A and B Deformation response
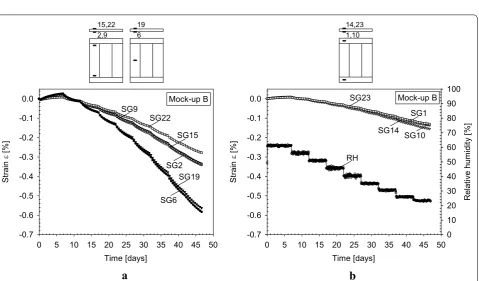
The time evolutions of horizontal strains measured in mock-ups A and B are, respectively, depicted in Figs. 7
2,9 15,22
6 19
1,10 14,23
a
b
Fig. 8 Time evolution of horizontal strains in mock-up B for a selection of strain gauges. a Group of strain gauges 6,19 attached to a board at the half-length of the panel, and group 2,9,15,22 attached to a board near a cleated end. b Group of strain gauges 1,10,14,23 attached to a cleated end, together with the corresponding relative humidity profile imposed, taken from Fig. 6b
2,9 15,22
6 19
1,10 14,23
a
b
During the first 7 days the relative humidity was kept fixed at 60%, whereby the strain profiles shown in Figs. 7
and 8 for mock-ups A and B remained approximately
constant. After 7 days the relative humidity was lowered to 20% in a single step for mock-up A, and in eight sepa-rate steps of 5% for mock-up B. It can be observed that the slopes of the strain profiles measured for mock-up A initially are high, but gradually decrease to relatively small values observed at the end of the hygral loading process, indicating that the final response of mock-up A is close to the time-independent steady-state limit. Mock-up B experiences incremental changes in defor-mation each time the relative humidity is lowered by 5%, which causes the overall trend of the strain curves to be different from that for mock-up A. The final strain values of the two mock-ups are comparable, and are the largest for strain gauge group 6,19 attached to one of the three boards at the half-length of the panel, followed by strain gauge group 2,9,15,22 attached to one of the boards near a cleated end, and finally the group 1,10,14,23 attached to a cleated end. This clearly indicates that the restrain-ing effect by the cleated end on the local deformation response of the substrate decreases with increasing dis-tance from the cleated end. The relatively small horizon-tal deformations measured on the cleated ends are mainly due to the coefficient of hygroscopic expansion in the
longitudinal material direction of the oak wooden cleated ends being more than 10 times smaller than that in the radial material direction of the oak wooden boards [27]. Note finally that the strain measurements within a strain gauge group show some spread in value, which may be mainly ascribed to the spatial heterogeneity of the oak wood microstructure.
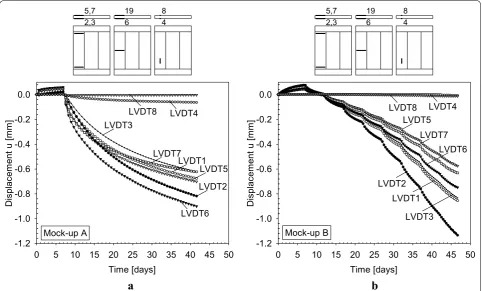
The time evolutions of the local panel displacements measured by the LVDTs are depicted in Fig. 9a and b for mock-ups A and B, respectively. From a comparison with Figs. 7 and 8, it can be confirmed that the horizontal displacements (recorded by LVDT 2, 6) follow a similar trend as that recorded by the horizontal strain gauges. The final displacements measured across an individual oak wooden board (as obtained by LVDT 2, 6) are com-parable to those following from multiplying the local values measured by strain gauges at similar locations (i.e., SG 6, 19) with the corresponding nominal LVDT width. The relative differences between these global and local deformation measures for the two mock-ups fall in between 3 and 35%, and indicate that the deforma-tion across a board is not ideally uniform, due to the het-erogeneity of the oak wood microstructure. It is further noted that for mock-up B the horizontal displacements measured at the back side of the panel (LVDT 5, 6 and 7) are up to 34% lower compared to the corresponding
2,3 5,7
6 19
4 8
2,3 5,7
6 19
4 8
a
b
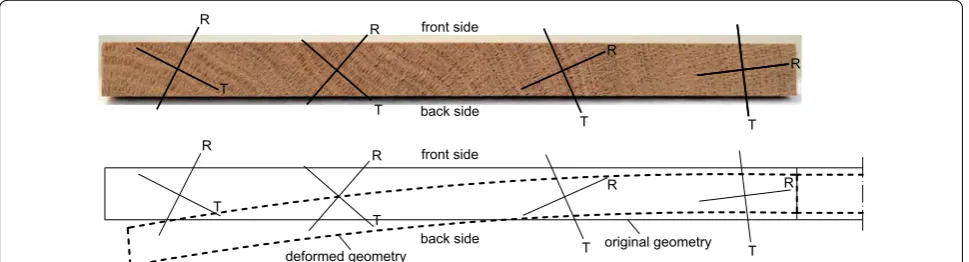
displacements at the front side of the panel (LVDT 1, 2 and 3), see Fig. 9b. This difference may be ascribed to the fact that the left board of mock-up B is not ideally quarter-sawn, as a result of which the material orienta-tion rotates counter clockwise going from the right side to the left side of the board, see Fig. 10. Consequently, the board is subjected to some warping, induced by a lower shrinkage at the back side than at the front side. Finally, it shows that the vertical displacements of the oak wooden
board measured by LVDT 4 and 8 are negligible, which results from the fact that the coefficient of hygroscopic expansion in the longitudinal material direction of the oak wooden board (= vertical panel direction) is more than 10 times smaller than in its radial material direction (= horizontal panel direction).
The time-averages of all strain measurements shown in the overview in Fig. 5a are calculated in accordance with Eq. (1), and depicted in Fig. 11 by means of the average
front side
back side
T R
T R
T R
T R
original geometry
deformed geometry T
R
T R
T R
T
R front side
back side
Fig. 10 Spatial variation in the orientation of R–T material axes in the not perfectly quarter-sawn left board of mock-up B, together with a schematic representation of the resulting warping under a drop in relative humidity. The warped shape of the board has been validated by means of a finite element simulation not presented here for brevity
2,9 15,22
5,13 18,26
6 19
7 20
8 21
1,10 14,23 3,11
16,24
4,12 17,25
per strain gauge group. As already explained, a strain gauge group is composed of strain gauges positioned at similar measurement locations. It can be observed that the time-averaged strains recorded for mock-up A are always substantially larger than those for mock-up B, see Fig. 11. This clearly results from the less abrupt decrease in relative humidity for mock-up B, whereby the defor-mation generated develops in a more gradual fashion, see also Figs. 7 and 8, leading to a lower value for the time-averaged strain ǫa . Note that all time-averaged strain values are negative, generally reflecting a shrink-age behaviour of the panel. The strain values observed at the half-length of the panel, i.e., the values measured by strain gauge groups 6,19, 7,20 and 8,21 are similar, which illustrates that it is insignificant whether the strain gauge is located on a single board, or on two adjacent boards thereby crossing a glue connection. Accordingly, it may be concluded that the glue does not fail, and that the elas-tic stiffness of the glue connection is much larger than of the oak wood itself (so that it does not influence the deformation behaviour of the panel). The same conclu-sion may be drawn after comparing the horizontal strains of the strain gauge groups 2,9,15,22, 3,11,16,24 and
5,13,18,26 located on boards near a cleated end. Also, the vertical strain gauges across the glue joint between the cleated end and the boards, i.e., strain gauge group 4,12,17,25, did not give an indication of failure of the glue connection; the strain values measured by this strain gauge group almost completely result from the deforma-tion of the cleated end in the radial material direcdeforma-tion.
In addition to the computation of the mean value of the time-averaged strains over a strain gauge group, the mean value of the final strain (i.e., the strain value at the end of the hygral loading process) has been derived from the strain measurements, see Fig. 12. The final shrinkage strain obviously has a larger value than the time-averaged shrinkage strain plotted in Fig. 11. Fur-ther, moderate to small differences appear in the values recorded for mock-ups A and B; this indicates that the final deformations of the mock-up only slightly depend on how the overall drop in 40% relative humidity is applied in time. The largest value of the final shrink-age strain occurs at the half-length of the panel, i.e., at the strain gauge groups 6,19, 7,20 and 8,21, at which location the restraining effect by the cleated end is expected to be negligible (which will be confirmed in
2,9 15,22
5,13 18,26
6 19
7 20
8 21
1,10 14,23 3,11
16,24
4,12 17,25
the “Experimental results mock-ups C, D, E and F” sec-tion). The values measured by these strain gauge groups lie between −0.43 and −0.67% , which, in accordance with a panel width of 546 mm, relates to a horizontal shortage of the panel between 2.3 and 3.7 mm. Near the cleated ends, i.e., at the strain gauge groups 2,9,15,22, 3,11,16,24 and 5,13,18,26, the final shrinkage strains in the substrate are almost a factor of two lower, in between −0.23 and −0.41% . The final shrinkage strain
measured on the cleated ends, i.e., at the strain gauge group 1,10,14,23, is the lowest, and varies between
−0.13 and −0.18% , which is mainly due to the relatively
small hygroscopic expansion coefficient in the longi-tudinal material direction of the cleated end. A more detailed interpretation of the local shrinkage strains and their relation to the occurrence of damage in the panel is provided in the next section.
Restrained shrinkage and risk of damage
The spatial variety in the shrinkage strains measured across the panel may have different origins. Consider, for example, the strain responses plotted in Fig. 7a and b for strain gauges SG6 and SG10 attached to mock-up A and oriented in the radial and longitudinal material direc-tions of the oak wood, respectively (see Fig. 5a), or the displacement responses illustrated in Fig. 9a, measured by LVDT 3 and 4 in the radial and longitudinal material directions, respectively. The reason that the deformation in the radial material direction here is larger than in the longitudinal material direction can be mainly ascribed to the considerable difference of a factor of 10 in the cor-responding hygroscopic expansion coefficients of ortho-tropic oak wood [27]. Other aspects that can be seen as a cause for the difference in the amount of shrinkage observed on the panel surfaces are the mock-up com-position, the local wood density (a large annual ring width results in more shrinkage than a small annual ring width), a variation in moisture content across the thick-ness of the panel, and the appearance of spatial changes in the orthotropic material directions (e.g., not perfectly quarter-sawn boards and the presence of conical or spiral grain directions).
In order to explore how local differences in shrinkage behaviour may influence the susceptibility of the panel to
damage, it is useful to consider the in-plane response of the hygro-elastic bi-layer illustrated in Fig. 13. The two layers constructing the bi-layer are orthotropic, initially stress-free, and are connected by a coherent (= fully stick-ing) interface. The in-plane hygro-mechanical behaviour of the orthotropic bi-layer is characterized by the elastic-ity parameters E(i)x , Ez(i) and νzx(i) , the hygroscopic expansion
coefficients βx(i) and βz(i) , and the layer heights h(i) , with the
indices i=1, 2 designating the individual layers. Driven by
a change in moisture content ∆m(i) (defined as the mass
of moisture per unit volume divided by the mass of dry material per unit volume), layer-wise uniform stresses are generated. The normal stresses σxx(i) can be computed
by starting from static equilibrium of the bi-layer in x-direction:
In addition, the total axial strain ǫxx(i) experienced by each
layer may be decomposed into an elastic part ǫxxe,(i) and a
hygroscopic part ǫxxm,(i):
where the superindex m used for the hygroscopic strain refers to “moisture”. Under plane-stress conditions (i.e.,
σzz=0 ), the elastic and hygroscopic strains in each layer can be derived from the general constitutive expressions for an orthotropic hygro-elastic continuum as
while under plane-strain conditions (i.e., ǫzz=0 ) these two strains follow as
The first expression in Eq. (5) has been obtained by mak-ing use of the symmetry condition νxzEz=νzxEx of the
orthotropic elastic tensor. Inserting either Eq. (5) or Eq. (4) for each of the two layers into Eq. (3), followed by
(2) σxx(1)h(1)+σxx(2)h(2) = 0 .
(3)
ǫxx(i)=ǫxxe,(i)+ǫxxm,(i) with i=1, 2,
(4) ǫxxe,(i)= σ
(i) xx
Ex(i)
and ǫxxm,(i)=βx(i)∆m(i),
(5) ǫxxe,(i)= σ
(i)
xx
Ex(i)
1−(ν(zxi))2E (i)
x
Ez(i)
+ νzx(i)βz(i)∆m(i) and
ǫxxm,(i)=βx(i)∆m(i).
E , E , ν , β , β
E , E , ν , β , β
x z zx x z h h (1) (2) x y z(1) (1) (1) (1) (1)
(2)
x
(2)
z zx(2)
(2)
x
(2)
z
equating the two resulting expressions and invoking Eq. (2), allows for computing the stresses σxx(i) in each layer as
where under plane-stress conditions the effective stiffness ¯
Ex(i) and the effective hygroscopic expansion coefficient ¯
βx(i) of a layer are given by
while under plane-strain conditions these parameters are
Equation (6) shows that the two layers develop stresses under the following two basic types of conditions: Type 1, where the change in moisture content in each layer is different, ∆m(1)�=∆m(2) , but their effective coefficients of hygroscopic expansion are equal, β¯(1)
x = ¯β(
2)
x , and Type 2, where the change in moisture content in both layers is equal, ∆m(1)=∆m(2) , but the effective hygroscopic expansion coefficients are different, β¯(1)
x �= ¯β(
2)
x . Trivially, combinations of these two basic cases, i.e., mutual differ-ences in both the moisture content and the effective coef-ficient of hygroscopic expansion, will also lead to stresses in the layers, in accordance with the general condition
¯
βx(1)∆m(1)�= ¯β(
2)
x ∆m(2) . It can be further observed from Eq. (6) that the stresses in the two layers have an opposite sign, i.e., if one layer is subjected to compression (charac-terized by a negative sign of the stress), the other layer is subjected to tension (characterized by a positive sign of the stress).
The result given by Eq. (6) can be used for identifying the origin of locally restrained hygral shrinkage in the panel, and its effect upon crack formation. For mock-ups A and B, restrained hygral shrinkage may originate from: (i) a difference in moisture content across the thickness direction of the boards, i.e., Type 1 shrinkage, or (ii) a directional difference in the coefficients of hygroscopic expansion of structural components forming a coher-ent connection, i.e., Type 2 shrinkage. Type 1 shrinkage occurs in the outer regions of the board thickness; these
(6)
σxx(1)= (β¯
(2)
x ∆m(2)− ¯β( 1)
x ∆m(1))h(2)E¯( 1)
x E¯( 2)
x
h(1)E¯(1)
x +h(2)E¯(x2)
,
σxx(2)= −σxx(1)h (1)
h(2),
(7)
¯
Ex(i)=Ex(i) and β¯x(i)=βx(i),
(8) ¯
Ex(i)= E
(i) x
1−νzx(i) 2E(i)x
E(i)z
and
¯ βx(i)=
1+νzx(i)β (i) z
βx(i)
βx(i).
regions initially experience a relatively fast decrease in moisture content upon a decreasing relative humidity at the front and back sides of the board, while the inner core of the board has not (yet) experienced a notice-able change in moisture concentration. When consider-ing one of these outer regions as layer 1 and half of the core of the boards as layer 2 (thereby making use of the symmetry across the thickness direction), in accordance with Eq. (6) this results into a tensile stress in the outer regions of the board thickness and a compressive stress at the core, see also the qualitative sketch in Fig. 14. Con-versely, Type 2 shrinkage occurs at the cleated ends of a panel, where the longitudinal (grain) direction of the oak wood representing the cleated end is oriented perpen-dicular to that of the connecting boards composing the substrate. The coefficient of hygroscopic expansion in the radial material direction of the boards is larger than in the longitudinal material direction of the cleated end. When interpreting the cleated end as layer 1 and the upper region of the boards adjacent to the cleated end as layer 2, in accordance with Eq. (6) the boards will be subjected to tension and the cleated end will be loaded in compression, see also the qualitative sketch in Fig. 15.
tension
tension compression
R T
Fig. 14 Restrained hygral shrinkage originating from a difference in moisture content across the thickness direction of a board, i.e., Type 1 shrinkage. The solid lines indicate the original dimension of the board, whereas the dotted lines represent the dimensional change upon drying. The radial and tangential material directions are indicated by the letters R and T respectively
tension compression
Free shrinkage Restrained shrinkage
Correspondingly, the glued tongue-and-grove joints between the boards and cleated ends will be loaded in shear and the glued butt joints between the boards will be loaded in tension.
In order to compute the tensile stresses in the mock-ups for both types of restrained hygral shrinkage, the material parameters for oak wood as listed in Table 2 are used. Here, the elastic moduli are adopted from [28] and the hygroscopic expansion coefficients are taken from [27]. Starting with the analysis of Type 1 shrinkage across the thickness of the oak wooden boards, it is assumed that the oak wood at the half-length of the boards is sub-jected to plane-strain conditions in the length (= verti-cal) direction of the panel, in correspondence with the negligible deformations measured by LVDT 4 and 8 in the length direction of mock-ups A and B, see Fig. 9. The x- and z-directions of the bi-layer thus correspond to the radial and longitudinal material directions of the oak wooden boards, respectively. Consider now a drop in relative humidity from 60 to 20%, which relates to a maximal drop in moisture content in the oak wood from 0.089 to 0.051, in accordance with the values at points A and B in Fig. 16 (these values will be further discussed in the “Moisture content development” section). Under the assumption that the maximal drop in moisture content takes place in the outer quarter regions across the board thickness h, i.e., ∆m(1)=0.059−0.089= −0.038 for
h(1)=h/4 , and the moisture content of the inner core of the boards does not change, i.e., ∆m(2)=0 for h(2)=h/4 (representing half of the symmetrical inner core), Eq. (6) provides a tensile stress in the outer quarter region of
σxx(1)=6.0 N/mm2 . This tensile stress lies below the val-ues for the tensile strength (measured perpendicular to the grain direction) of new oak wood ( ≈21 N/mm2 ) and seventeenth century oak wood ( ≈12 N/mm2 ) reported in [28]. Note hereby that the latter strength value is sub-stantially lower, which is the result of aging effects. From these strength data it may be concluded that under the current Type 1 shrinkage conditions cracking indeed does not occur, also not if the panel tested would have been made of (weaker) seventeenth century oak wood. The horizontal shrinkage strain under the above Type 1
conditions can be computed from Eqs. (3) and (5), and for both layers equals ǫxx= −0.37% . Obviously, this shrinkage strain lies below the range of final horizontal shrinkage strains of −0.6% to −0.7% that was measured for mock-up A at strain gauge groups 6,19, 7,20 and 8,21, see Fig. 12. The reason for this is that the measured final shrinkage strain is expected to agree closely to the steady-state situation, whereby the board has under-gone sufficient time to accommodate for the maximal drop in moisture content across its complete thickness, i.e., ∆m(1)=∆m(2)= −0.038 . Indeed, with a uniform coefficient of hygroscopic expansion across the board thickness, Eq. (6) confirms that the stresses relax to zero,
σxx(1)=σxx(2)=0 , which, with Eqs. (3) and (5), leads to a
maximal final horizontal shrinkage strain of the layers of ǫxx= −0.74%(= ¯βx∆m = ¯βx(mB−mA)) . This value for
the final shrinkage strain is only slightly larger than the measured values plotted in Fig. 12.
For a Type 2 shrinkage analysis at the cleated ends, a plane-stress assumption is taken, in agreement with the limited thickness of the cleated ends and the boards in the out-of-plane direction. Hence, in the bi-layer model the stress response only depends on the material charac-teristics in the x-direction, see Eqs. (6) and (7). The elas-tic moduli and the hygroscopic expansion coefficients are again taken from Table 2, whereby the x-direction of the bi-layer is represented by the longitudinal direction of the oak wooden cleated end (= layer (1)), and by the radial
direction of the oak wooden boards (= layer (2)). The
effective height h(2) across which the oak wooden board
substantially contributes to the local hygral-mechanical Table 2 Elasticity parameters (taken from [28])
and hygroscopic expansion coefficients (taken from [27]) in the longitudinal (L) and radial (R) material directions of oak wood
Elasticity parameters EL[N/mm2
] 12,800
ER[N/mm2
] 1600
νLR [–] 0.35 Hygroscopic expansion coefficients βL [-] 0.016
βR [–] 0.19
equilibrium near the cleated end is assumed to be equal to the height h(1) of the cleated end. Under a maximal
drop in moisture content of ∆m(1)=∆m(2)= −0.038 , Eq. (6) provides a tensile stress in the oak wooden board of σxx(2)=9.4 N/mm2 . With this result, the total hori-zontal shrinkage strain in the layers from Eq. (3) is cal-culated as ǫxx= −0.13% , which is indeed comparable to the total final shrinkage strain measured for mock-up A on the cleated end, see Fig. 12 for the strain gauge group 1,10,14,23. This agreement confirms that the above assumption for the effective height h(2) of the oak wooden
board is realistic. Note that the above tensile stress does not exceed the tensile strength of new oak wood of
21 N/mm2 (measured perpendicular to the grain
direc-tion), as reported in [28]; however, the stress has a mag-nitude relatively close to the reported tensile strength of 12 N/mm2 for seventeenth century oak wood, which, con-sidering a realistic spread in the material properties for oak wood, thus potentially may lead to crack formation comparable to that observed near cleated ends of seven-teenth century historical cabinets displayed in museums, see Fig. 2. Alternatively, this value for the tensile stress may reach the strength of the glue connecting the oak wooden boards, thereby leading to failure of a glue joint.
As illustrated by the experimental deformations depicted in Fig. 9, the hygral shrinkage of the door panels tested appeared to occur predominantly in the horizontal
direction. This supports the in-situ observation of Type 2 shrinkage cracks emerging mainly along the vertical direction of historical cabinet doors, see Fig. 2, i.e., per-pendicular to the horizontal direction in which restrained hygral shrinkage leads to the development of significant tensile stresses in the panel substrate.
It must be emphasized that the basic bi-layer model sketched in Fig. 13 considers the stresses to be uniform in each layer, which provides an adequate estimate of the risk of climate-induced damage in a door panel if the spatial variations of stress within a layer are moderate too small. Essentially, the predictions following from Eq. (6) are use-ful for obtaining a first estimate of the risk of damage; a more detailed insight into this aspect requires the per-formance of advanced finite element analyses, in which climate-induced damage in oak wood panels is simulated by means of a coupled thermal–hygral–mechanical model that accounts for nucleation and propagation of discrete cracks. This type of analysis, however, falls beyond the scope of the present work, and is subject of future work.
Moisture content development
The time evolutions of the moisture content, measured at five different locations at the core of the boards of mock-ups A and B, are depicted in Fig. 17a and b, respectively. During the first 7 days of testing the relative humidity
1 3
2 4
5 1,2 3,4,5
a
1 3
2 4
5 1,2 3,4,5
b
was kept constant, during which the moisture content only slightly varies in value, and for the five sensors lies in between 8.0 and 8.8%. Since it was confirmed that the relative humidity in the climate room was homogeneous, this spread in values is likely to be caused by spatial hetero-geneities of the oak wood microstructure. After the initial stage, the relative humidity is lowered in an instantaneous (mock-up A) and stepwise (mock-up B) manner from 60 to 20%, as a result of which the moisture content in the panels decreases towards values between 6.9 and 7.7%.
The recorded decrease in moisture content can be com-pared to the values represented by the points A and B on the steady-state boundary curves depicted in Fig. 16. Sorption experiments were performed for the construc-tion of these boundary curves and for the calibraconstruc-tion of the depicted desorption scanning curve. The adsorption boundary curve provides an equilibrium moisture con-tent of 8.9% at a relative humidity of 60%, see point A in Fig. 16, which lies somewhat above the range of initial moisture contents measured in the panels, see Fig. 17. Upon lowering the relative humidity towards 20%, the moisture content in Fig. 16 smoothly decreases along the desorption scanning curve towards an equilibrium mois-ture content of 5.1% on the desorption boundary curve, as indicated by point B in Fig. 16. It can be observed that this value lies approximately a factor of 1.5 below the range of final moisture contents recorded in the pan-els, see Fig. 17. The almost horizontal slopes observed at the end of the curves in Fig. 17 nevertheless suggest that these final moisture contents closely correspond to a steady state of hygroscopic equilibrium. The difference of a factor of 1.5 in equilibrium moisture content may be due to the reliability of the moisture sensors: unfor-tunately some inaccuracies caused by signal interference, signal instability and the influence of the electric current on the measured moisture content did appear during the testing procedure.
Experimental results mock-ups C, D, E and F Deformation response
Mock-ups C to F were exposed to a relative humidity profile ranging between 35 and 71%, see Fig. 6c. Here, the configuration of mock-up D and F are the same as that of mock-ups A and B, while mock-ups C and E do not have cleated ends, and mock-ups E and F are constructed with veneer layers at the front and back sides of the sub-strate, see Fig. 3. The horizontal strain response meas-ured at the half-length of the central board of mock-up D, as monitored by strain gauges SG6 and SG17, see Fig. 5b, is illustrated in Fig. 18, together with the relative humid-ity profile applied. It is observed that the signals recorded by the two strain gauges are virtually equal, and roughly follow the same trend as that of the relative humidity
profile applied. The maximal shrinkage strain at the half-length of the board is −0.16% , which is 3 to 4 times lower
than the maximum shrinkage strain of mock-up A under an instantaneous drop in relative humidity of 40%, see Fig. 7a.
In Fig. 19a–d the time evolution of the horizontal dis-placements recorded by the LVDTs sketched in the over-view of Fig. 5b are depicted for mock-ups C, D, E and F, respectively. Clearly, the displacements develop along a similar trend as the strains depicted in Fig. 18. For mock-ups D and F the displacements of LVDT 1 and 5, measured near a cleated end across almost the complete width of the oak wood substrate, have a maximal value close to 0.6 mm, while for the mock-ups C and E without cleated ends this displacement approaches 1.2 mm. In other words, the presence of cleated ends locally reduces the horizontal deformation of the adjacent substrate by a factor of two. Further, the displacements recorded across an individual board (i.e., LVDT 2, 3, 4, 6, 7, 8) are one third to one half of the displacements recorded across the whole substrate (i.e., LVDT 1, 5), which is in correspond-ence with the substrate being constructed of three boards with some variation in width, see Table 1.
The time responses measured by the strain gauges other than SG6 and SG17 appear to follow a similar trend as those depicted in Fig. 18, and are not illustrated here for brevity. Instead, the time-averaged strains of the strain gauges ǫa , averaged per strain gauge group, are
depicted in Fig. 20. For reasons of comparison, this is
6 17
1 5 2
6 7 8 3 4
a
1 5 2
6 7 8 3 4
b
1 5 2
6 7 8 3 4
c
1 5 2
6 7 8 3 4
d
done for all four mock-ups C, D, E and F. In accordance with the measurement scheme depicted in Fig. 5b, there are five strain gauge groups monitoring horizontal strains and two groups monitoring vertical strains.
Consistent with the results obtained for mock-ups A and B, for mock-ups D and F the horizontal shrink-age strain at the half-length of the panel (i.e., at strain gauge groups 6,17 and 5,7,16,18) is substantially larger— approximately a factor of two—than the horizontal shrinkage strain close to the cleated ends (i.e., at strain gauge groups 1,11,12,22, 2,9,10,13,20,21 and 3,14). In contrast, for mock-ups C and E without the cleated ends these strains are approximately equal, which again illus-trates the restraining effect by the cleated end on local deformations in the panel. In addition, the horizontal shrinkage strains recorded at the centre of the panel are similar for the mock-ups with and without cleated ends, which confirms the earlier hypothesis that at the half-length of the panel the restraining effect by the cleated end on the deformation behaviour is negligible. It can be further noticed that the spread in strain values measured on mock-ups E and F with veneer layers is considerably larger than for mock-ups C and D without veneer lay-ers. Hence, the addition of veneer layers increases the variability in the local deformation behaviour of a panel. On average, the horizontal shrinkage strains for the pan-els with veneer layers are slightly larger than those for
panels without veneer layers; this is caused by the fact that the hygroscopic expansion coefficient of the teak veneer layers in the tangential material direction (=
horizontal panel direction) is larger than that of the oak substrate in the radial material direction (= horizontal
panel direction). In accordance with the bi-layer model in Fig. 13 and Eq. (6), at the half-length of the panel this Type 2 shrinkage mechanism will induce a horizontal tensile stress in the veneer layer and a (small) horizontal compressive stress in the oak wood. This horizontal ten-sile stress indeed stimulates the development of vertical cracks in veneer layers, as regularly observed for histori-cal cabinets [10]. These vertical cracks may subsequently deflect into delaminating cracks between the veneer layer and the substrate, with the chance of local spallation (i.e., flaking off) of the veneer layer. This failure mechanism is amplified by bending effects (warping) in the panel, see [30] for more details.
Since the spreads in strain values for the panels with and without veneer layers generally overlap, the influ-ence by the veneer layers on the shrinkage behaviour of the substrate may be considered insignificant. This minor influence can be ascribed to the limited thickness of the veneer layers of 0.5 mm, see Table 1, which only represents 6% of the total panel thickness of 15.52 mm. It can be further seen that the strain values measured on an individual board are comparable to those measured 1
12
2,9 13,20
6 17
5 16 11
22
10 21
7 18
8 19 3
14
4 15
across the glue connection between two adjacent boards. This again confirms that the glue connections do not noticeably influence the local deformations of the oak wooden board. Finally, as also observed for mock-ups A and B, the recorded vertical strain values (i.e., at strain gauge groups 4,15 and 8,19) typically are smaller than the horizontal strain values, with the strain value measured at the centre of the panel being close to zero.
For brevity reasons, the final strain ǫf per strain gauge
group, as depicted in Fig. 12 for mock-ups A and B, will not be shown for mock-ups C to F; this informa-tion appears to be comparable to that of the time-aver-aged strain depicted in Fig. 20, which may be ascribed to the smooth variations in the relative humidity profile imposed, see Fig. 6c.
Moisture content development
The development of the moisture content with time is illustrated in Fig. 21 at two different locations in mock-up D, together with the relative humidity profile imposed. The moisture sensors MC 1 and MC 2 are attached to a board at the half-length of the panel and near a cleated end, respectively, see Fig. 5b. Note that both moisture profiles start at a value relatively close to the equilibrium moisture content of 8.9%, as following from the adsorp-tion boundary curve depicted in Fig. 16. The trends meas-ured by the sensors clearly are comparable, and roughly follow the trend of the relative humidity profile applied. Note that the shortest fluctuations in relative humidity do not affect the moisture content profiles, which is due
to the characteristic minimal time it takes for the mois-ture to diffuse from the surface to the core of the board (which is where the sensors measure the signal). Since the moisture profiles for mock-ups C, E and F are similar to the profile of mock-up D, these are not illustrated here. Nonetheless, from this similarity it can be concluded that the presence of cleated ends and veneer layers does not significantly influence the moisture content development in the substrate.
Conclusions
The experimental study reported in this communica-tion has led to several important insights and conclu-sions on the hygro-mechanical response of cabinet door panels under relative humidity fluctuations, which are summarized below. These conclusions provide a scien-tific basis for the understanding of shrinkage cracks and dimensional changes observed on decorated oak wooden panels in historical Dutch cabinets, and thus may assist in advising museums on future sustainable preserva-tion strategies and rapreserva-tional guidelines for indoor climate specifications.
1. Restrained hygral shrinkage observed in cabinet door panels can be a source of damage formation. As demon-strated by means of a hygro-mechanical bi-layer model, this shrinkage may originate from: (i) a difference in moisture content across the thickness direction of the panel, referred to as Type 1 shrinkage, or (ii) a directional difference in the coefficients of hygroscopic expansion of structural components forming a coherent connection, referred to as Type 2 shrinkage. Type 1 shrinkage occurs in the outer regions of the panel thickness, whereas Type 2 shrinkage takes place at the cleated ends of a panel.
2. Under a maximally applied decrease in relative humidity of 40%, the panels tested did not show any shrinkage cracking in the oak wood or the glue connec-tions, no matter whether this decrease in relative humid-ity was applied abruptly or in a more gradual, step-wise fashion. By means of a basic analytical bi-layer model it has been demonstrated that the local tensile stresses developing in the panels under restrained hygral shrink-age indeed were lower than the tensile strength of new oak wood perpendicular to the grain direction, as reported recently in [28]. Nonetheless, the tensile stress generated near the cleated end—as a result of Type 2 shrinkage—is comparable to the tensile strength of sev-enteenth century oak wood reported in [28], which possi-bly explains the crack formation regularly observed near cleated ends in seventeenth century historical cabinets, see Fig. 2. Alternatively, these cracks may result from the local tensile stress reaching the fracture strength of the (aging) historic glue connecting the oak wooden boards, leading to failure of a glue joint.
1 2
3. The presence of cleated ends locally reduces the hori-zontal (Type 2) shrinkage of the substrate by approxi-mately a factor of two, regardless of the features of the humidity profile applied. Together with the above con-clusions (1) and (2), this experimental result supports the observation from the museum study reported in [25] that historical door panels with and without cleated ends respectively show the most and least damage.
4. The presence of teak veneer layers induces a Type 2 shrinkage mechanism via its connection to the oak wood substrate below. At the half-length of the panel this leads to a horizontal tensile stress developing in the veneer layer and a (small) horizontal compressive stress evolv-ing in the oak wood. This horizontal tensile stress indeed stimulates the development of vertical cracks in veneer layers, as regularly observed for historical cabinets [10].
5. The hygral shrinkage of the mock-ups tested predom-inantly occurred in the horizontal direction. This supports the in-situ observation of Type 2 shrinkage cracks emerg-ing mainly in the vertical direction of historical cabinet doors, see Fig. 2, i.e., perpendicular to the horizontal direction in which restrained hygral shrinkage may induce significant tensile stresses in the panel substrate.
6. A few mock-ups experienced some warping under the relative humidity variations applied. This is caused by the fact that the boards composing the panel substrate were not always ideally quarter-sawn, which resulted in different amounts of shrinkage at the back and front sides of the board. This may explain the warping observed in door panels of seventeenth century cabinets displayed in museums [10].
As a final note, it is mentioned that a detailed study of the damage generated by restrained hygral shrink-age in oak wooden panels requires the performance of advanced finite element analyses, in which a coupled thermal–hygral–mechanical modelling approach is used that accounts for the nucleation and propagation of dis-crete cracks. This type of analysis, however, falls beyond the scope of the present work, and will be presented in a forthcoming publication.
Authors’ contributions
RAL set up the experimental program, executed the experiments and drafted the manuscript. ASJS assisted in setting up the experimental program, derived the analytical bi-layer model on restrained hygral shrinkage, and drafted the manuscript. AJMJ assisted in setting up the experimental program and reviewed the manuscript. PHJCD assisted in setting up up the experimental program and reviewed the manuscript. HLS assisted in setting up the experi-mental program and reviewed the manuscript. All authors read and approved the final manuscript.
Author details
1 Department of the Built Environment, Eindhoven University of Technology,
P.O. Box 513, 5600 MB Eindhoven, The Netherlands. 2 Department of
Conser-vation and Scientific Research, Rijksmuseum Amsterdam, Hobbemastraat 22, 1071 ZC Amsterdam, The Netherlands.
Acknowledgements
This work is part of the research programme Science4Arts, Climate4Wood pro-ject, which is financed by the Netherlands Organisation for Scientific Research (NWO). The Climate4Wood project is a collaboration between Eindhoven University of Technology, Rijksmuseum Amsterdam, Cultural Heritage Agency of the Netherlands and Delft University of Technology. The authors acknowl-edge the helpful discussions with S.E. Ekelund of the Eindhoven University of Technology/Rijksmuseum Amsterdam, H.A. Ankersmit of the Cultural Heritage Agency of the Netherlands, and R.M. Groves of the Delft University of Technol-ogy on topics related to the fields of conservation, cultural heritage and exper-imental mechanics, respectively. The collaboration with S.E. Ekelund during the design and preparation of the experimental tests is appreciated. The effort of I. Breebaart of the Rijksmuseum Amsterdam in making the mock-ups was essential. The technical assistance of H.L.M. Wijen of the Structures Laboratory of the Eindhoven University of Technology and W.J.M. van Bommel and M.A.P. van Aarle of the Building Physics Laboratory of the Eindhoven University of Technology on the experiments is highly appreciated. The authors are grateful for the supply of oak boards by The University of Amsterdam and teak veneer by the Rijksmuseum Amsterdam.
Competing interests
The authors declare that they have no competing interests.
Publisher’s Note
Springer Nature remains neutral with regard to jurisdictional claims in pub-lished maps and institutional affiliations.
Received: 21 September 2018 Accepted: 20 November 2018
References
1. Boersma F, Dardes K, Druzik J. Precaution, proof, and pragmatism. Evolv-ing perspectives on the museum environment. In: Conservation perspec-tives. The GCI newsletter. Collection Environments. The Getty Conserva-tion Institute; 2014. p. 4–9.
2. Luciani A. Historical climates and conservation environments. Historical perspectives on climate control strategies within museums and heritage buildings [Dissertation]. Politechnico di Milano; 2013.
3. Bickersteth J. Environmental conditions for the safeguarding of collec-tions: what should our set points be? Stud Conserv. 2014;59(4):218–24. 4. Bickersteth J. IIC and ICOM-CC 2014 declaration on environmental
guide-lines. Stud Conserv. 2016;61(sup1):12–7.
5. Kirby Atkinson J. Environmental conditions for the safeguarding of col-lections: a background to the current debate on the control of relative humidity and temperature. Stud Conserv. 2014;59(4):205–12. 6. Staniforth S. Environmental conditions for the safeguarding of
collec-tions: future trends. Stud Conserv. 2014;59(4):213–7.
7. Michalski S. The ideal climate, risk management, the ASHRAE chapter, proofed fluctuations, and toward a full risk analysis model. In: Boersma F, editor. Contribution to the experts roundtable on sustainable climate management strategies. Tenerife: The Getty Conservation Institute; 2007. p. 1–19.
8. Erhardt D, Tumosa CS, Mecklenburg MF. Applying science to the question of museum climate. In: Padfield T, Borchersen K, editors. Museum micro-climates. Copenhagen: The National Museum of Denmark; 2007. p. 11–8. 9. van Duin P. Climate effects on museum objects. The need for monitoring and analysis. In: Conservation perspectives. The GCI newsletter. Collection Environments. The Getty Conservation Institute; 2014. p. 13–15. 10. van Duin PHJC. The construction of flat decorated doors of Dutch
seventeenth-century cabinets, report of a master class. In: Vasques Dias M, editor. Restoring joints, conserving structures. Amsterdam: Stichting Ebenist; 2010. p. 121–43.
11. van Gerven G, Ankersmit B, van Duin PHJC, Jorissen AJM, Schellen HL. A controlled method to flatten warped wooden panels. Stud Conserv. 2016;61(3):125–35.
historical indoor climate conditions on mechanical degradation of a wooden cabinet. J Cult Herit. 2015;16:419–27.
13. Saft S, Kaliske M. Computational approach towards structural investiga-tions for the restoration of historical keyboard instruments. J Cult Herit. 2012;13S(3):S165–74.
14. Goli G, Dionisi-Vici P, Uzielli L. Locating contact areas and estimating contact forces between the “Mona Lisa” wooden panel and its frame. J Cult Herit. 2014;15:391–402.
15. Bratasz L, Kozlowski R, Camuffo D, Pagan E. Impact of indoor heating on painted wood—monitoring the altarpiece in the church of Santa Maria Maddalena in Rocca Pietore, Italy. Stud Conserv. 2007;52(3):199–210. 16. Rachwal B, Bratasz L, Krzemień M, Lukomski M, Kozlowski R. Fatigue
dam-age of the gesso layer in panel paintings subjected to changing climate conditions. Strain. 2012;48:474–81.
17. Rachwal B, Bratasz L, Lukomski M, Kozlowski R. Response of wood sup-ports in panel paintings subjected to changing climate conditions. Strain. 2012;48:366–74.
18. Lukomski M. Painted wood. What makes the paint crack? J Cult Herit. 2012;13S:S90–3.
19. Dionisi-Vici P, Mazzanti P, Uzielli L. Mechanical response of wooden boards subjected to humidity step variations: climate chamber measure-ments and fitted mathematical models. J Cult Herit. 2006;7:37–48. 20. van Grevenstein A, New B, Young C, Seymour K, Groves R, Horie V. The
conservation of panel paintings and related objects. In: van Duin P, editor. Research agenda 2014–2020. The Hague: The Netherlands Organisation for Scientific Research in association with Rijksmuseum Amsterdam; 2014. 21. The Getty Conservation Institute. Managing Collection Environments
Initiative; 2018. http://www.getty .edu/conse rvati on/our_proje cts/educa tion/manag ing/index .html. Accessed Sept 2018.
22. Schellen HL, van Duin PHJC, Ekelund SE, Luimes RA, Gauvin CAF, Jorissen AJM, et al. Climate4Wood: climate effects on decorated wooden panels. In: NWO Science4Arts Symposium. Amsterdam, The Netherlands: Nether-lands Organisation for Scientific Research; 2016. p. 13–17.
23. Ekelund S, van Duin P, Jorissen A, Ankersmit B, Groves RM. A method for studying climate-related changes in the condition of decorated wooden panels. Stud Conserv. 2018;63(2):62–71.
24. Druzik J. Epidemiology applied to museum collections. In: Druzik J, Boersma F, editors. Epidemiology: basic ideas applied to museum collec-tions. Log Angeles: The Getty Conservation Institute; 2015. p. 5–25. 25. Ekelund SE, Jorissen AJM. The Museum Study of the Climate4Wood
research project. In: Jorissen AJM, Leijten AJM, editors. Proceedings of Research symposium: Structural Design with Timber. ISBN 978-90-386-3562-0. Eindhoven: Eindhoven University of Technology; 2014. p. 93–109. 26. CEN. EN 16682: Conservation of cultural heritage—methods of
measure-ment of moisture content, or water content, in materials constituting immovable cultural heritage; 2017.
27. Saft S, Kaliske M. A hybrid interface-element for the simulation of moisture-induced cracks in wood. Eng Fract Mech. 2013;102:32–50. 28. Luimes RA, Suiker ASJ, Verhoosel CV, Jorissen AJM, Schellen HL.
Fracture behaviour of historic and new oak wood. Wood Sci Technol. 2018;52:1243–69.
29. Frandsen HL, Svensson S, Damkilde L. A hysteresis model suitable for numerical simulation of moisture content in wood. Holzforschung. 2007;61(2):175–81.