PhD Dissertation
International Doctorate School in Information and Communication Technologies
DISI - University of Trento
M
USIC SIGNAL PROCESSING
FOR AUTOMATIC EXTRACTION OF HARMONIC AND RHYTHMIC
INFORMATION
Maksim Khadkevich
Advisor:
Prof. Maurizio Omologo
Università degli Studi di Trento
Abstract
This thesis is concerned with the problem of automatic extraction of harmonic and rhythmic information from music audio signals using statistical framework and advanced signal process-ing methods.
Among different research directions, automatic extraction of chords and key has always been of a great interest to Music Information Retrieval (MIR) community. Chord progressions and key information can serve as a robust mid-level representation for a variety of MIR tasks. We propose statistical approaches to automatic extraction of chord progressions using Hidden Markov Models (HMM) based framework. General ideas we rely on have already proved to be effective in speech recognition. We propose novel probabilistic approaches that include acoustic modeling layer and language modeling layer. We investigate the usage of standard N-grams and Factored Language Models (FLM) for automatic chord recognition. Another central topic of this work is the feature extraction techniques. We develop a set of new features that belong to chroma family. A set of novel chroma features that is based on the application of Pseudo-Quadrature Mirror Filter (PQMF) bank is introduced. We show the advantage of using Time-Frequency Reassignment (TFR) technique to derive better acoustic features.
Tempo estimation and beat structure extraction are amongst the most challenging tasks in MIR community. We develop a novel method for beat/downbeat estimation from audio. It is based on the same statistical approach that consists of two hierarchical levels: acoustic modeling and beat sequence modeling. We propose the definition of a very specific beat duration model that exploits an HMM structure without self-transitions. A new feature set that utilizes the advantages of harmonic-impulsive component separation technique is introduced.
Acknowlegements
I would like to give special thanks to a number of people for the completion of this disser-tation. First and foremost, extreme gratitude to my advisor, Prof. Maurizio Omologo. He has taught me every step of the way how research activities are performed. Without him this would have never been completed. I would like to say thanks to my SHINE colleagues for the valuable discussions and friendly atmosphere.
I was lucky enough to have the opportunity to visit Audio, Acoustics and Waves Group at Télécom ParisTech, Signal and Image Processing Department. The group has been a source of good advice and collaboration. During the three months in Paris, I was given the chance to learn much thanks to discussion and help from Prof. Richard and Dr. Thomas Fillon.
Contents
1 Introduction 1
1.1 Content-based music information retrieval . . . 1
1.1.1 High-level music descriptors . . . 3
1.1.2 MIR applications . . . 5
1.1.3 Music Information Retrieval Evaluation eXchange . . . 8
1.2 Motivation . . . 10
1.3 Goals . . . 11
1.4 Contributions . . . 12
I Chord recognition 13 2 Background 15 2.1 Feature extraction for chord recognition . . . 15
2.1.1 Feature selection . . . 15
2.1.2 Beat-synchronous features . . . 17
2.1.3 Tuning . . . 17
2.2 Template-matching techniques . . . 18
2.3 Machine learning techniques . . . 19
3 Feature extraction 23 3.1 Introduction to chroma features . . . 23
3.2 Tuning . . . 24
3.3 PQMF-based chroma features . . . 26
3.3.1 PQMF filter bank . . . 27
3.3.2 PQMF-based chroma . . . 28
3.3.3 From cross-correlogram to chroma representation . . . 32
3.4 Time-frequency reassigned chroma features . . . 34
3.5.1 Tonal centroid . . . 37
3.5.2 Application of Inverse Discrete Cosine Transform . . . 38
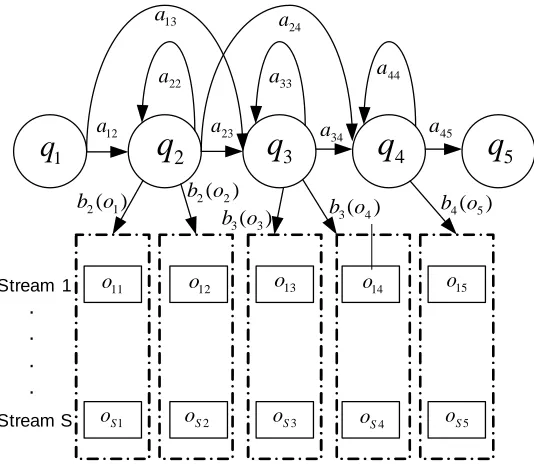
4 System architecture 39 4.1 Acoustic modeling using multi-stream HMMs . . . 39
4.2 Language Modeling . . . 41
4.2.1 Factored language models . . . 42
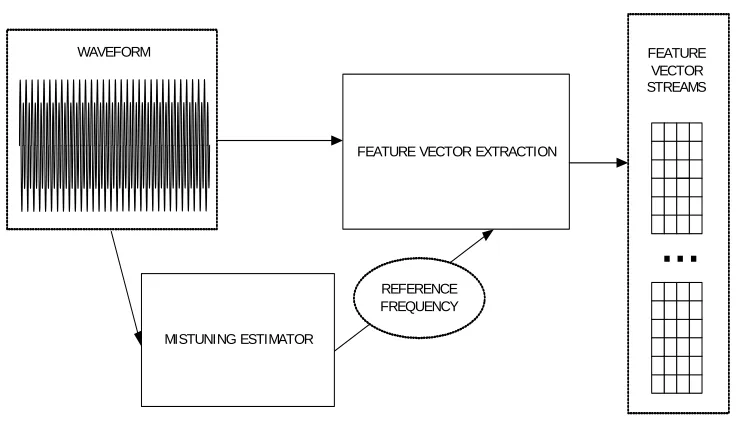
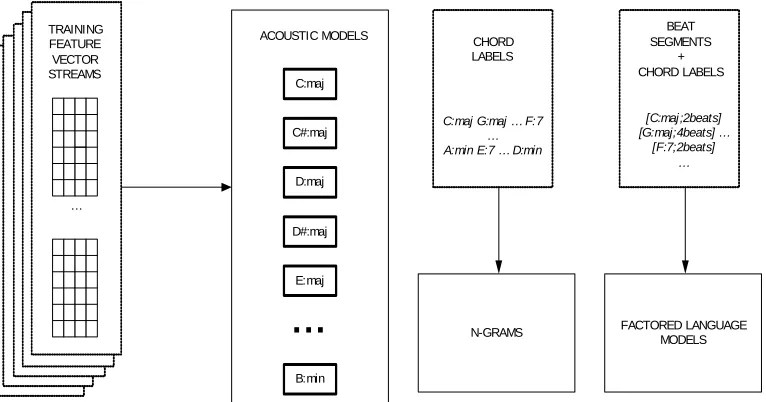
4.3 System overview . . . 44
4.3.1 Mistuning estimation . . . 44
4.3.2 Model training . . . 45
4.3.3 Decoding step . . . 46
5 Experimental results 49 5.1 Description of the dataset and evaluation metrics . . . 49
5.1.1 Evaluation metrics . . . 49
5.1.2 Datasets . . . 50
5.2 Baseline configuration: impact of tuning . . . 51
5.2.1 Results . . . 51
5.2.2 Conclusion . . . 53
5.3 Factored language models . . . 54
5.3.1 Results . . . 54
5.3.2 Conclusions . . . 55
5.4 PQMF-based chroma features . . . 55
5.4.1 Results . . . 56
5.4.2 Conclusions . . . 56
5.5 Time-frequency reassigned chroma features . . . 58
5.5.1 Chroma quality evaluation . . . 58
5.5.2 Chord recognition system evaluation . . . 59
5.6 Chroma features with reduced dimensionality . . . 69
5.7 MIREX evaluations . . . 70
5.7.1 MIREX 2008 . . . 70
5.7.2 MIREX 2009 . . . 73
5.7.3 MIREX 2010 . . . 74
5.7.4 MIREX 2011 . . . 77
6 Conclusions 81 6.1 Summary of the contributions . . . 81
II Beat structure extraction 83
7 Background 87
8 Feature extraction 89
8.1 Onset detection function . . . 89
8.2 Chroma variation function . . . 91
9 System architecture 95 9.1 Acoustic modeling . . . 95
9.1.1 Word-based acoustic modeling . . . 96
9.1.2 Unit-based acoustic modeling . . . 98
9.2 Language modeling . . . 99
9.3 Beat/downbeat detection . . . 101
9.4 Reference system . . . 102
10 Experimental results 103 10.1 Datasets and evaluation metrics . . . 103
10.1.1 Datasets . . . 103
10.1.2 Evaluation metrics . . . 104
10.2 Beat/downbeat extraction . . . 104
10.2.1 Onset detection function . . . 105
10.2.2 Chroma variation function . . . 106
10.3 MIREX 2011 . . . 110
10.4 Tempo estimation based on beat extraction . . . 111
11 Conclusions 113 11.1 Summary of the contributions . . . 113
11.2 Future work and perspectives . . . 114
Bibliography 115
List of Tables
1.1 MIREX 2011 tasks. . . 8
3.1 Filter bank configuration . . . 29
5.1 System performance obtained with different windowing configurations on the first fold. . . 52
5.2 Recognition rate obtained using the tuning procedure. . . 53
5.3 Recognition rates and fragmentation rates on the reduced and on the complete test data set. . . 53
5.4 Recognition rates for "No-LM", "LM", and "FLM" configurations. . . 55
5.5 Evaluation result summary. Best recognition rates for different frame lengths and feature extraction methods. . . 56
5.6 Semitone change distribution . . . 59
5.7 A subset of evaluation results with time-frequency reassignment constraints. . . 62
5.8 Performance of STD and RC feature with different window types. . . 62
5.9 Influence of tuning on STD and RC feature performance . . . 64
5.10 Recognition rates as a function of Gaussian number for different number of states in HMM . . . 67
5.11 Experimental results using feature dimensionality reduction . . . 70
5.12 Team legend for MIREX 2008 pretrained subtask. . . 71
5.13 Team legend for MIREX 2008 train-test subtask. . . 71
5.14 Team legend for MIREX 2009 pretrained subtask. . . 73
5.15 Team legend for MIREX 2009 train-test subtask. . . 73
5.16 Team legend for MIREX 2010 audio chord detection contest. . . 76
5.17 MIREX 2010 results in Audio Chord Detection. . . 76
5.18 Team legend for MIREX 2011 audio chord detection contest. . . 78
5.19 MIREX 2011 results in Audio Chord Detection. . . 78
9.1 Dictionary for the beat/downbeat tracking task . . . 100
10.1 Feature vector configurations. . . 104
10.2 MIREX-based evaluation results for ODF and MSP features on the Quaero dataset. . . 105
10.3 MIREX-based evaluation results for 2dim, 3dim and Davies systems on the Quaero dataset. . . 106
10.4 MIREX-based evaluation results for 3dim and Davies systems on the Hainsworth dataset. . . 107
10.5 Experimental results for 3dim and Davies systems on the "Beatles" dataset. . . 107
10.6 F-measure using 10% adaptive precision window for 3dim and Davies systems on the "Beatles" dataset. . . 107
10.7 F-measure using 10% adaptive precision window for 3dim and Davies systems on the "Hainsworth" dataset. . . 108
10.8 Team legend for MIREX 2011 audio beat tracking contest. . . 110
10.9 MIREX 2011 Results in audio beat tracking contest for MCK dataset. . . 110
10.10MIREX 2011 Results in audio beat tracking contest for MAZ dataset. . . 111
10.11Tempo detection results. . . 112
A.1 Beatles dataset. . . 125
A.2 Song list of Queen, Zweieck, and Carol King. . . 125
List of Figures
1.1 An example of hierarchical rhythmic structure for the beginning of George
Michael’s "Careless Wisper" . . . 4
3.1 Block diagram of precise frequency estimates. . . 25
3.2 Magnitude and Phase-change spectrum. . . 26
3.3 Comparison of DFT chroma and PQMF-based chroma features. . . 27
3.4 Impulse response of the PQMF prototype filterh[n]. . . 28
3.5 Magnitude response of the first 14 PQMF filters. . . 29
3.6 Example of left and right contexts of different lengths at the time instantn0. . . 31
3.7 Crosscorrelogram for one of the filterbank channels. . . 32
3.8 Unwrapped chroma vectors extracted from a short note passage by means of different approaches. . . 33
3.9 Time-Frequency representation of an excerpt from "Girl", the Beatles. All spec-trograms are computed using Hanning window of 192 ms with 90% overlapping. 36 4.1 Structure of multi-stream HMM with three hidden emitting states . . . 40
4.2 Connection scheme of trained models for decoding. . . 41
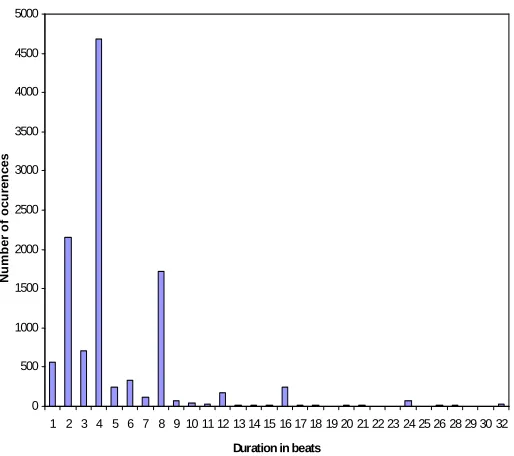
4.3 Chord Duration Histogram. . . 42
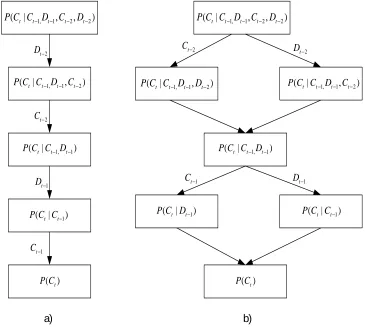
4.4 Standard back-off (a) and parallel back-off (b) graphs for tri-gram LM. . . 43
4.5 Feature extraction block diagram . . . 44
4.6 Training phase block diagram. Baum-Welch algorithm for HMM training and n-gram model parameter estimation using ground-truth labels. . . 45
4.7 Test phase block diagram. . . 47
4.8 An example of a lattice. . . 47
4.9 Test phase block diagram using FLMs. . . 48
5.1 Recognition rate as a function of insertion penalty using Hanning window of different lengths. . . 52
5.3 Recognition rates for different system configurations as a function of insertion
penalty. . . 57
5.4 Chroma quality estimates. . . 58
5.5 Semitone change distribution . . . 59
5.6 Schema of time-frequency reassignment window constraints . . . 60
5.7 Evaluation results with time-frequency reassignment constraints as a function of∆f. Different∆tare represented by different curves. . . 61
5.8 Tukey’s HSD test. . . 61
5.9 Recognition rates using the RC features for different window lengths and Gaus-sian numbers . . . 63
5.10 Recognition rate for RC feature as a function ofδ. . . 63
5.11 Recognition rate for HRC as a function of the tolerance factor . . . 64
5.12 Recognition rate as a function of the number of Gaussians . . . 65
5.13 Recognition rate (%) as a function of different weights for chroma and bass-chroma observable streams . . . 66
5.14 Self-test recognition rate (%) as a function of different weights for chroma and bass-chroma observable streams . . . 67
5.15 Chord confusion statistics. . . 68
5.16 MIREX 2008 results in audio chord detection. . . 72
5.17 Tukey-Kramer HSD test for MIREX 2008 results. . . 72
5.18 MIREX 2009 results in audio chord detection. . . 74
5.19 Tukey-Kramer HSD test for MIREX 2009 results. . . 75
5.20 Tukey-Kramer HSD test for MIREX 2010 results. . . 77
5.21 Tukey-Kramer HSD test for MIREX 2011 results. . . 79
8.1 Onset-time vector in the approach of Goto and Muraoka. . . 90
8.2 Onset detection function of an accending note passage. . . 91
8.3 Different feature components extracted from George Michael’s "Careless Wisper". 93 9.1 Description levels for a speech sentence and a beat sequence. . . 96
9.2 Word-level acoustic modeling. . . 97
9.3 Block diagram of beat transcription system. . . 97
9.4 An example of the transcription output of George Michael’s "Careless Wisper". 98 9.5 Unit-level acoustic modeling. . . 99
9.6 Block diagram of the modified beat transcription system. . . 101
10.1 Evaluation of MSP and ODF features on the Quaero dataset. . . 105
Chapter 1
Introduction
This thesis deals with automatic extraction of harmonic and rhythmic information from raw audio. This chapter makes an introduction to MIR, formulates the motivation, sets goals and describes the contributions.
1.1
Content-based music information retrieval
Recent advances in digital media have allowed for extensive wide-spread growth of musical collections. Existing storage capacities allow for having huge collections of media on portable media devices. There is a continuous transformation of the way we listen to music. Going back to the end of the 20-th century, we could observe radio broadcasting and music record stores to be the major ways of music consumption. Nowadays, drastic popularity of social networking has lead to the creation of web communities, changing the way of music dissemination. Music recommendation services, such as Last.fm1 have gained huge popularity and proposed new
facilities to access media data based on your personal preferences.
To this end, the need for effective search in large media databases is becoming critical. De-veloping techniques for accessing content and browsing in huge music archives has become an emerging area of research. High demand for such techniques has lead to establishing and evolving Music Information Retrieval (MIR) community, which include academic research in-stitutions, as well as industrial research companies. Music Information Retrieval is an inter-disciplinary science that addresses extraction of meaningful information from music data. It involves musicology, signal processing, machine learning and other disciplines.
In spite of growing research activities in MIR, nowadays, the most common way of media search is accomplished through textual metadata. Lots of music download services are based on the search by artist, album, song name. However, a number of content-based search engines,
1.1. CONTENT-BASED MUSIC INFORMATION RETRIEVAL
such as Shazam2 and SoundHound3 have become available, introducing essentially novel
ap-proaches to music retrieval. Content-based concept is based on the principle of processing the content of a given audio document and extracting the necessary information from it.
Shazam provides music identification service that is based on acoustic fingerprinting [1]. A fingerprint of each audio file from a huge music database is stored in an indexed database. A query audio file is subjected to the same analysis and the extracted fingerprint is matched against a large set of fingerprints from the database. A list of possible candidate songs from the database is evaluated for the correctness of the match. For robust identification in noisy environment, spectrogram peaks are used as feature set. A set of time-frequency points with the highest energy in their neighboring region is extracted and constructed constellation map is indexed. The robustness of the approach is proved by the fact that noise and distortions usually do not change the temporal layout of the spectrogram peaks. Shazam is considered to be an effective tool to search for exact content match. However, slight modifications in the song arrangement make identification impossible. For example, search query using a remix version for a given song would fail.
However, the solution of the above-mentioned search problem, when there is no exact match in spectral peak distribution, but high similarity in the harmonic content is proposed by Sound-Hound. Apart from the functionality provided by Shazam, the algorithm is so advanced that it can confidently recognize a song from your own singing and/or humming. On the other hand, sometimes, the system is not capable of exact matching and can provide a remixed version of a query song instead of the original as the final result.
Shazam and SoundHound are the solutions developed mainly for the mobile phone users. However, there is the need for such tools on desktop computers. A possible scenario could be the following: having a huge amount of untagged music data, organize a collection, where songs are sorted according to a certain criteria, e. g. artist/album, style. A solution is proposed by MusicBrainz4 project. The project is maintained by open community that collects, and makes
available to the public music metadata in the form of a relational database. The database of MusicBrainz contains information about artists, track titles, the length of each track, and other metadata. Recorded works can additionally store an acoustic fingerprint for each track. This provides the facility for automatic content-based identification and subsequent tagging.
There are thousands of other possible applications of the MIR technologies. For all of them, effective and robust algorithms for feature extraction play an essential role.
2
http://www.shazam.com
3
http://www.soundhound.com/
CHAPTER 1. INTRODUCTION
1.1.1 High-level music descriptors
One of the largest research areas of MIR is the extraction of high-level music descriptors, or attributes. The most important and informative attributes include harmony, rhythm, melody, instrumentation and others. Effective methods for extraction such descriptors is the necessary condition for developing robust and effective music information retrieval systems. A funda-mental approach to the classification of musical facets was proposed by Orio [2].
In the following sections a short description of the most important high-level music descrip-tors is provided.
Onset structure
An important characteristic of any musical excerpt is the onset structure. Onset information can be useful for the analysis of temporal structure such as tempo and meter. Music classification and music fingerprinting are the tasks where onset information could also be of great use [3]. The notion of onset leads to many definitions: a sudden burst of energy, a change in the short-time spectrum of the signal or in the statistical properties. The onset of the note is a single instant chosen to mark the temporally extended transient. In most cases, it will coincide with the start of the transient, or the earliest time at which the transient can be reliably detected [4]. Onsets can be divided into two classes, "soft" and "hard". A hard onset is characterized by a sudden energy change. A soft onset is usually represented by slow changes in the spectral energy. The most straightforward methods for hard onset detection are based on the analysis of energy-based features. Soft onsets are considered to be much more difficult to detect and usually involves spectral analysis methods. Noise and oscillations associated with frequency and amplitude modulation make the task of onset structure extraction challenging.
Rhythmic structure
Rhythmic structure of music plays an important role in MIR-related tasks. It is primarily repre-sented by tempo, beat and meter structure. For example, knowing beat structure allows one to extract musically meaningful beat-synchronous features, instead of performing frame-by-frame analysis. It can be of great benefit to manage the tasks of music structure extraction or cover song identification. In these tasks dealing with beat-normalized time axis is usually much more convenient, since a tempo-invariant representation is utilized.
1.1. CONTENT-BASED MUSIC INFORMATION RETRIEVAL
named as time signature and can be expressed in the form of a fractional number, e.g. 3/4, 2/4, 6/8. It gives information on the organization of strong (bar-level) and soft (tactum-level) events along the time axis. An example of hierarchical rhythmic structure is presented in Figure 1.1
Figure 1.1: An example of hierarchical rhythmic structure for the beginning of George Michael’s "Care-less Wisper"
Nowadays, beat detection is one of the most challenging tasks in the MIR community. While processing modern rock and pop songs with rich percussive part and stable rhythm is a nearly solved problem, dealing with non-percussive music with soft note onsets and time-varying tempo, that is characteristic of classical music, is still a challenge.
Melody
Melody is amongst the most important high-level descriptors that describe the contents of music signals. Melody extraction is highly related to the general task of pitch detection and tracking that has been extensively addressed in other research areas, such as speech signal processing. However, the task of melody extraction does not only mean estimation of the fundamental frequency, but also the subsequent quantization using musical scale to produce a score-like representation. As in the case of single speaker in speech processing, melody detection in the case of monophonic signals is nearly a solved problem. However, dealing with multi-instrument signals with the number of fundamental frequencies at a given time instant greater than one is still a challenge. This problem becomes even harder, if accompaniment instruments have rich spectral representation with harmonics containing significant part of spectral energy. There are some problems one can come across when extracting melody. Some performances may contain vibrato parts, which can lead to a sequence of notes in the final transcription, while the original score notation contain just a single note. Another case that is hard to manage is glissando. In this case, rapidly changing pitch can also be transcribed as a sequence of notes.
CHAPTER 1. INTRODUCTION
song. A song that needs to be recalled can be easily represented by singing or humming the melody, since in most cases, melody is the attribute that distinguishes one piece from another.
Harmonic structure
Key and chords are the two attributes that describe tonal and harmonic properties of a musi-cal piece. Harmony denotes a combination of simultaneously or progressively sounding notes, forming chords and their progressions. Among all existing musical styles, western tonal mu-sic, which is one of the most popular nowadays, is known for its strong basement on harmony. Harmonic structure can be used for the purposes of content-based indexing since it is derived from the mood, style and genre of musical composition. Harmonic structure can be described in terms of chord sequences. A chord can be introduced as a number of notes sounding simulta-neously, or in a certain order between two time instants, known as chord boundaries. Therefore, the task of chord transcription includes chord type classification and precise boundary detection. Harmony together with such features as tempo, rhythm, melody extracted from a raw wave-form can be widely used for context-based indexing, retrieval, and navigating through large collections of audio data.
1.1.2 MIR applications
Extracting high-level information, such as rhythm, harmony, key, melody has become a chal-lenge. We have entered an era of complex content-based search and retrieval systems [6]. A number of use cases, where recently developed content-based methods were successfully ap-plied in MIR applications are addressed in this section.
Automatic music transcription and lead sheet generation
Similarly to automatic speech recognition, automatic music transcription has a lot of challeng-ing tasks. For example, distchalleng-inguishchalleng-ing musical instruments in a polyphonic piece of audio can be more or less easily done by human being. Meanwhile solving this problem automati-cally needs a lot of research effort. Actually the most daunting problem is the transcription of polyphonic piece of music in terms of notes, which implies producing score notation for each instrument. The subtask of this problem, which deals with the extraction of harmonic prop-erties of audio signal, is chord recognition. Another challenging subtask is the extraction of hierarchical rhythmic structure [5].
1.1. CONTENT-BASED MUSIC INFORMATION RETRIEVAL
and the corresponding chord progression in a beat-synchronous fashion. State-of-the-art perfor-mance in each constituent module is achieved, which allows for obtaining transcription results close to musician expectations.
Accompaniment based on chord extraction
While the application area of tempo and beat descriptors is mainly indexing and segmentation, the information on chord progressions covers more practical aspects. Opportunity to automat-ically extract harmonic structure can be of great use to musicologists, who perform harmonic analysis over large collections of audio data, or just to amateur musicians. A great interest in chords can be indicated by the number of websites containing chord databases for existing songs. Archives containing chord transcriptions are becoming more and more popular. An easy way to accompany a singer is to play the chords extracted from the performed song, which can be extracted manually by expert musicians, or in automatic fashion. For the moment, the con-tent is generated by users manually in a time-consuming manner. The quality of the data highly depends on the user expertise and background in music. That is why online chord databases sometimes contain not reliable transcriptions. At the same time, modern advanced automatic chord extraction systems do not allow to produce 100% correct labels. The best system in the MIREX 2011 competition performed at 83% recognition rate.
The compromise between time-consuming manual labeling and the quality of automatic chord transcription can be achieved in semi-automatic mode. In the first step, preliminary labels are obtained by running automatic chord extraction system. In the final step, a number of trained musicians work together on error correction and quality check.
Automatic accompaniment generation for vocal melody and automatic song creation
Melody and harmony are considered to be the backbone of a song. The process of song creation for many song writers often starts with the idea about melody [8]. In this approach developing chord progression and accompaniment patterns are the necessary steps to produce the final version. Usually, professional musicians with the knowledge of musical structure and harmony manage the whole process of song production. However, people with poor background in music theory are not able to participate in such an amusing and creative activity. Recent advances in MIR have allowed musically-untrained individuals to work on music creation. An example of a machine-learning-based system that takes a melody as an input and generates appropriate chords was presented by Simon et al. [8].
Another interesting use case of song generation was proposed by Fukayama et al. [9]. Au-tomatic song generation web-service was developed in the context of Orpheus5 project. The
5http://ngs.hil.t.u-tokyo.ac.jp/
CHAPTER 1. INTRODUCTION
system requires only song lyrics as an input data. A user can also set up music genre, voice, tempo and other parameters. Then the system performs text analysis, melody and harmony generation, and produces score notation containing lyrics along with the resultant audio file.
Recommender systems
Extreme growth of online music collections and advances in digital multimedia have allowed us to start listening music just with a click of a button. In spite of the easy access to large web archives, discovering new music according to our personal preferences is a hard problem. This caused a variety of music recommender systems to come into existence. There are several approaches to music recommendation.
Pandora6 is one of the most popular music recommendation systems. It is based on the Music Genome Project7. Each track in the database is annotated with 400 different attributes. Annotating is performed in a time-consuming manual fashion by professional musicians, which makes the growth of the database dependent on the human resources.
Music recommendation system proposed by Last.fm8is based on a different approach. They
have developed social recommenders, also known as collaborative filters. The statistics for music tracks ever listened by a particular user forms the basis of the recommendation engine. Each user is proposed to install an optional plug-in that monitors media player software and builds a profile of his or her music preferences. Having a large database of user profiles, the system finds users whose listening history is similar and makes suggestions.
Mufin9 is a music recommendation service that is purely content-based. It analyzes the
fundamental properties of a song. The recommendation is based on the similarity of the content. The algorithm analyzes 40 characteristics of each song, including tempo, sound density, and variety of other factors.
Other use cases
The number of possible use cases, where content-based MIR algorithms are successfully applied is not limited to the above-mentioned applications. Artist identification, copyright infringement detection and protection, instrument separation, performance alignment, plagiarism detection, composer identification are amongst the most challenging MIR tasks being addressed recently.
6http://www.pandora.com 7
http://www.pandora.com/mgp.shtml
8
http://www.last.fm
1.1. CONTENT-BASED MUSIC INFORMATION RETRIEVAL
1.1.3 Music Information Retrieval Evaluation eXchange
Progressive and continuous evolving of MIR systems that we can observe nowadays is boosted by the existence of Music Information Retrieval Evaluation eXchange (MIREX) [10], the most influential, community-based evaluation framework. Direct comparison of MIR systems aimed at solving a specific problem is sometimes impossible due to many factors. Performance of a given system can be obtained on different datasets, using different evaluation metrics. Establish-ing common rules of MIR system assessment has become a necessity and caused establishEstablish-ing and gradual development of the MIREX framework.
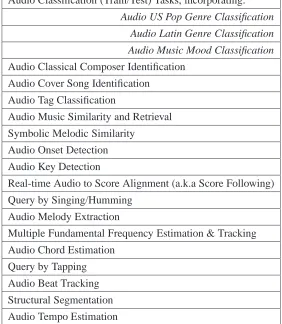
Audio Classification (Train/Test) Tasks, incorporating:
Audio US Pop Genre Classification
Audio Latin Genre Classification
Audio Music Mood Classification
Audio Classical Composer Identification Audio Cover Song Identification
Audio Tag Classification
Audio Music Similarity and Retrieval Symbolic Melodic Similarity
Audio Onset Detection Audio Key Detection
Real-time Audio to Score Alignment (a.k.a Score Following) Query by Singing/Humming
Audio Melody Extraction
Multiple Fundamental Frequency Estimation & Tracking Audio Chord Estimation
Query by Tapping Audio Beat Tracking Structural Segmentation Audio Tempo Estimation
Table 1.1: MIREX 2011 tasks.
CHAPTER 1. INTRODUCTION
test datasets for the participants is to prevent from model parameter over-fitting, which is an important aspect of objective evaluation. To this end, participants should deliver their systems to the MIREX team to execute using recently developed The Networked Environment for Mu-sic Analysis (NEMA) framework [12]. The framework facilitates valid statistical comparisons between techniques, avoiding the above-described problems by carrying out experiments that are both carefully constructed and exactly repeatable.
The set of different tasks is defined by the community. Anyone is free to propose a new task, describing the evaluation metrics, and, if necessary, provide a dataset. Then, the task is discussed on the wiki-pages by all potential participants, different approaches for the evaluation are taken into consideration, and the final description and rules becomes available.
1.2. MOTIVATION
1.2
Motivation
Fast development of hi-tech industry allowed people having hours of digital audio recordings in their pockets. It caused high demand for content-based search and retrieval, known as music recommendation. Due to the extreme growth of digital music collection, effective and robust content-based indexing and retrieval methods have become an emerging area of research. It boosted the demand for tools that can perform accurate extraction of high-level descriptors. Chords, key, beat structure and tempo are among the most relevant descriptive attributes of music information.
CHAPTER 1. INTRODUCTION
1.3
Goals
This thesis encompasses a variety of research activities aimed mainly at the extraction of har-monic and rhythmic descriptors. The main focus is concentrated on the developing compu-tational algorithms and effective feature extraction methods for the transcription of chord se-quences and beat structure.
The objectives of the work include the following aspects:
1. Analyze state-of-the art approaches for chord detection and beat structure extraction.
2. Develop robust feature sets that capture essential information from audio for a given task.
3. Design and develop probabilistic frameworks for automatic chord recognition and beat/downbeat extraction.
4. Perform large-scale evaluations and describe the behavior of the developed systems vary-ing different configuration parameters.
1.4. CONTRIBUTIONS
1.4
Contributions
The thesis contribute in the following areas:
1. A new feature set for chord recognition that outperforms standard chroma feature has been proposed. It is based on the Time-Frequency Reassignment technique and incorporates harmonic-impulsive component separation.
2. A two-level probabilistic framework for chord recognition has been introduced. It is based on a novel approach that includes acoustic modeling layer and language modeling layer.
3. The usage of standard N-grams and Factored Language Models for automatic chord recog-nition has been addressed. Experiments with different back-off strategies for Factored Language Models have been carried out.
4. The performance of the proposed chord recognition system has been investigated using large-scale parameter optimization.
5. A new feature set for beat/downbeat detection has been proposed. It is based on the harmonic and impulsive part of the Time-Frequency Reassigned spectrogram.
6. A novel probabilistic approach to beat/downbeat detection has been developed. The def-inition of a very specific beat duration model that exploits an HMM structure without self-transitions has been introduced.
Part I
Chapter 2
Background
This chapter is concerned with the background information on chord extraction. Among all existing musical styles, western tonal music, which is one of the most popular nowadays, is known for its strong relationship to harmony.
Harmonic structure can be used for the purposes of content-based indexing and retrieval since it is correlated to the mood, style and genre of musical composition. It has been suc-cessfully used for audio emotion classification [14], cover song identification [15], audio key estimation [16]. Chord sequence can serve as a robust mid-level representation for a variety of MIR tasks. Among different research directions automatic chord recognition has always been of a great interest to MIR community.
During the past few decades several approaches to chord recognition were developed. They can be classified into template matching[17, 18], machine learning [19–21] and hybrid ap-proaches [22, 23]. The majority of the current state-of-the-art machine learning apap-proaches are based on Hidden Markov Models [24], [25], [26], Dynamic Bayesian Networks (DBN) [27] and Support Vector Machines (SVM) [28]. Submissions based on the above cited approaches were among the top-ranked results in the MIREX competitions.
Section 2.1 introduces general information on feature vector selection and extraction tech-niques. In Sections 2.2 – 2.3 different approaches to automatic chord recognition are presented.
2.1
Feature extraction for chord recognition
2.1.1 Feature selection
As in the case of speech recognition, one of the most critical issues in chord recognition is the choice of the acoustic feature set to use in order to represent the waveform in a compact way.
2.1. FEATURE EXTRACTION FOR CHORD RECOGNITION
(PCP), describes harmonic content of a given frame. The amount of energy for each pitch class is described by one component in a chroma vector. Since a chord consists of a number of tones and can be uniquely determined by their positions, chroma vector can be effectively used for the chord representation.
Fujishima was the first one who used the chroma feature [29] for chord extraction from audio. The most common way of calculating chromagram is to transform the signal from the time domain to the frequency domain with the help of short-time Fourier transform (STFT) or constant-Q transform and subsequent energy mapping of spectral bins to chroma bins [19– 21, 30–32].
An alternative way to extract chroma was proposed by Müller [33]. The analyzed signal is passed through a multirate IIR filter bank. In the first step, STMSP (Short-Time Mean-Square Power) features that measure the local energy content of each filter output are extracted. Large amount of energy indicate the presence of musical notes whose frequencies correspond to the passband of a given filter. In the next step, chroma-based audio representation is obtained from STMSP by summing energies that correspond to the subbands of the same pitch class.
Much attention has been put to the problem of higher harmonics and their impact on the chroma vector. Several approaches proposed performing some sort of harmonic analysis in order to reveal the presence of higher harmonic components [34–36]. All these approaches are based on a frame-by-frame spectral analysis that is aimed at finding all the pitches that occur in the given time instant.
In the approach of Mauch and Dixon [34] an approximate note transcription procedure was applied before calculation of wrapped chromagram. Experimental results showed an increase in performance of 1%. However, their technique proved to be more advantageous when consid-ering "difficult" chords.
Ueda et al. [26] showed the importance of harmonic filtering step for feature extraction. Before extracting feature vectors, a harmonic/percussive separation is performed in order to remove impulsive components and noise. The system based on this approach showed the best result in the MIREX 2008 competition. Another important issue the authors addressed in this paper is the usage of dynamic delta-features.
CHAPTER 2. BACKGROUND
2.1.2 Beat-synchronous features
Recently, several approaches that exploit mutual dependency between harmonic progressions and rhythmic structure have been proposed [21], [37], [38]. Beat-synchronous chroma features are used instead of frame-by-frame chroma vectors [37], [28]. Since western music is highly structural in terms of rhythm and harmony, the basic idea that chord boundaries occur on the beat positions is exploited.
Papadopoulos and Peeters [21] proposed a system that performs simultaneous estimation of chord progressions and downbeats from audio. They paid a lot of attention to possible interac-tion of the metrical structure and the harmonic informainterac-tion of a piece of music. They proposed a specific topology of HMMs that allows for modeling chords dependency on metrical structure. Thus, their system is capable of recognizing chord progressions and downbeat positions at the same time. The model was evaluated on a dataset of 66 Beatles songs and proved to improve both the estimation of the chord progression and the downbeat positions.
Bello and Pickens [37] used a similar approach. The evaluation of their system showed a significant increase in performance (about 8%) when using beat-synchronous chroma features as opposed to frame-by-frame approach.
However, beat-synchronous features have some weak sides. Since the quality of beat-level segmentation depends highly on the beat extraction approach, some beat location errors can lead to incorrect segmentation.
2.1.3 Tuning
In the stage of feature extraction for chord recognition and key estimation, a lot of attention has been paid to tuning issues [18, 30, 31]. The necessity of tuning appears when audio was recorded from instruments that were not properly tuned in terms of semitone scale. They can be well-tuned relatively to each other, but, for example, "A4" note is played not at conventional 440 Hz but at 447Hz. This mis-tuning can lead to worse feature extraction and, as a result, less efficient or incorrect classification. Several approaches to circumvent the problem have been developed.
2.2. TEMPLATE-MATCHING TECHNIQUES
Peeters [31, 32] tested a set of candidate tunings, i.e. the tone below and the quarter-tone above "A4" note. For each possible tuning the amount of energy in the spectrum is esti-mated. After defining the global tuning center, the signal is resampled so that it becomes tuned to 440Hz.
Mauch et al. [30] used a quite similar approach: after computing 36-bin chromagram they pick one of three possible sets of 12-bin chromagram, relying on the maximum energy inside candidate bins (e. g. {1, 4, 7... 34 }).
2.2
Template-matching techniques
Template matching techniques are based on the idea of introducing a set of templates for each chord type. The template configurations are derived either heuristically or using some knowl-edge from music theory. In the classification step, extracted feature vectors are matched against all possible templates. The template that produces the highest correlation is used to generate chord label for a given vector.
A most trivial example would be the definition of a binary 12-dimensional chord template mask, where pitch classes that correspond to the constituent notes of a given chord are set to ones, while the other pattern components are set to zeros. A binary templateT is defined as
T = [ZC, ZC#, ZD, ZD#, ZE, ZF, ZF#, ZG, ZG#, ZA, ZA#, ZB] (2.1)
whereZp denotes the mask value that corresponds to the pitch classp. For example, binary
masks for C major and D minor chords would take the following form:
TC:maj = [1,0,0,0,1,0,0,1,0,0,0,0]
TD:min = [0,0,1,0,0,1,0,0,0,1,0,0]
(2.2)
Fujishima [29] proposed a real-time chord recognition system, describing extraction of 12-dimensional chroma vectors from the Discrete Fourier Transform (DFT) of the audio signal and introducing numerical pattern matching method using built-in chord-type templates to deter-mine the most likely root and chord type. He introduced feature vector smoothing over time and "chord change sensing". The system was tested on real audio and showed 94% accuracy for the opening theme of Smetana’s Moldau.
Similarly, Harte and Sandler [18] applied binary masks to generate templates for four dif-ferent chord classes: major, minor, diminished and augmented. Their vocabulary consisted of 48 different chords. Evaluation was performed on the first two Beatles albums, "Please, Please Me" and "Beatles For Sale". The average frame-level accuracy they achieved was 62.4%.
CHAPTER 2. BACKGROUND
PCP, Harmonic Pitch Class Profile (HPCP) that was used by Gomez [40] for key detection. In the approach presented in [39], amplitude values of four – six higher harmonics contribute to chord templates. An empirical decay factor for higher harmonics amplitude is set to0.6, so that the amplitude of ah-th harmonic is set to0.6h, whereh = 0corresponds to the fundamental.
Evaluations on the 110 songs of Beatles showed that considering six higher harmonics in chord templates brings about 5% relative improvement.
Oudre et al. [41] proposed a template-based method for chord recognition. They investigate different chord models taking into account one or more higher harmonics. As in the above-mentioned approaches, the detected chord over a frame is the one minimizing a measure of fit between a rescaled chroma vector and the chord templates. An interesting investigation they car-ried out is the influence of different measures of fit between the chroma features and the chord templates. In order to take into account the time-persistence, they performed a post-processing filtering over the recognition criteria, which quickly smoothes the results and corrects random errors. Their system was evaluated on the 13 Beatles albums. The experiments showed that chord template configurations with one and four harmonics showed better results than those with six harmonics. They discovered that the most robust and effective measure of fits in their approach are the Kullback-Leibler divergence and the Euclidean distance.
A fast and efficient template-based chord recognition method was suggested in [17]. The chord is determined by minimizing a measure of fit between the chromagram frame and the chord templates. This system proved the fact that template-based approaches can be as effective as probabilistic frameworks.
2.3
Machine learning techniques
HMM-based aproaches
2.3. MACHINE LEARNING TECHNIQUES
Bello and Pickens [37] proposed a probabilistic model that is partially based on music the-oretical considerations. As opposed to Sheh and Ellis [19], who used random initialization of mean vector and diagonal covariance matrix in Gaussian distributions, they propose initialize these values according to music theory. In order to take into consideration correlation between chroma elements, they introduce full covariance matrix. They claim that pitches which comprise the triad are more correlated than pitches which do not belong to the triad. These dependencies are introduced when initializing covariance matrix. They propose selective model training us-ing the standard Expectation Maximization (EM) algorithm for HMM parameter estimation as introduced in [42]. The observation vector parameters are not re-estimated in the training phase. The only parameters that are updated using EM algorithm is the chord transition matrix and ini-tial distributions. The experiments were conducted using the first two Beatles albums, "Please, Please Me" and "Beatles For Sale". The performance of their system proved to be significantly higher when using selective model training (75%), if compared to the system configuration, where all parameters are re-estimated in the training phase (42%).
In Western tonal music, key and chord progression are the two artifacts that are highly de-pendent on each other. Some approaches exploit this mutual dependency [20],[43]. The advan-tage of such systems is the possibility of concurrent estimation of key and chord progression, which is achieved by means of building key-dependent HMMs.
Lee and Slaney [20] described a chord recognition system that used symbolic data, taken from MIDI1files, to train HMMs. This allowed them to avoid a time consuming task of human
annotation of chord names and boundaries. At the same time, they synthesized audio from the same symbolic files and extracted feature vectors. They build a key-dependent HMMs, where chord transition probabilities are influenced by a given key. During the Viterbi decoding [42] the HMM with the highest log-likelihood determines the global key and is used to derive chord progression.
Hybrid approaches
Yoshioka et al. [22] presented an automatic chord transcription system, which is based on gen-erating hypotheses about tuples of chord symbols and chord boundaries, and further evaluating the hypotheses, taking into account three criteria: acoustic features, chord progression patterns, and bass sounds. Thus, they first performed beat-analysis on raw audio to extract downbeat po-sitions of a piece of music. Then, the most probable hypothesis about a chord sequence and the key were searched. Finally, the obtained most plausible hypothesis is produced as an output. A conventional 12-dimensional chroma feature is used as feature set. Pre-defined chord progres-sion patterns reduce the ambiguities of chord symbol identification results. They evaluated their
CHAPTER 2. BACKGROUND
system on one-minute excerpts from seven popular songs, and achieved 77% average accuracy. This approach was further developed by Sumi et al. [23]. They mainly focused on the interrelationships among musical elements and made an attempt to efficiently integrate infor-mation about bass lines into probabilistic chord recognition framework. Their framework made it possible to deal with multiple musical elements uniformly and integrate statistical information obtained from music recordings. They particularly exploited the mutual dependency between chord sequences and bass lines in order to improve the accuracy of chord recognition. For pruning the search space, they define the hypothesis reliability as the weighted sum of three probabilities: the likelihood of Gaussian Mixture Models for the observed features, the joint probability of chord and bass pitch, and the chord transition N-gram probability. Evaluation on 150 songs from twelve Beatles albums showed the average frame-rate accuracy of 73.4%.
Some approaches used structural segmentation information for enhancing chord recognition by combining information from different occurrences of the same segment type for chroma calculation [44].
In [27], a 6-layered dynamic Bayesian network was suggested. In this network four hidden source layers jointly model key, metric position, bass pitch class and chord. The two observed layers model bass and treble content of the signal. This approach shows an example of how simultaneous estimation of beats, bass and key can contribute to the chord recognition rate.
Ni et al. [45] proposed a system for simultaneous estimation of chords, key, and bass notes. As opposed to the approach of Mauch [46], where some expert knowledge is used to set up system parameters, it is fully based on the machine learning approach, where all the parameters are estimated from training data.
Chord progression statistics
Chapter 3
Feature extraction
In this chapter, a new feature set for extracting harmonic information from audio content is in-troduced. The proposed features belong to the chroma family, which has always been a common and well-established feature set for chord recognition. When performing feature extraction, sig-nal in the given asig-nalysis frame is assumed to be stationary and it is also assumed that no note transitions occur inside it. However, standard chroma extraction approaches, which are based on Short-Time Fourier Transform (STFT) or Constant-Q transform, require frame size to be long enough to provide reasonable frequency resolution. Transients and noise may cause en-ergy assignment to some frequencies that do not occur in the signal. In this thesis, we investigate on alternative solutions to feature vector extraction for chord recognition. Along with the de-scription of traditional approaches to chroma extraction, we propose two novel methods that are based on PQMF filter bank and Time-Frequency Reassignment respectively, and provide their comparative characteristics.
3.1
Introduction to chroma features
Feature extraction is an important step in the majority of MIR tasks. It allows for representing a waveform in a compact way, capturing the desired characteristics of the analyzed signal for fur-ther processing. In chord recognition domain, chroma has always been almost unique feature. One of the reasons, why chroma performs well, is the strong connection between the physical meaning of chroma vector components and music theory.
Generally, chroma feature extraction consists of the following steps. At first, audio signal is downsampled and converted to the frequency domain by means of Short-Time Fourier Trans-form (STFT) or Constant-Q transTrans-form applying a window function with a given overlapping factor.
3.2. TUNING
n(k) = 12log2
fk
fref
+69, n∈ ℜ+, (3.1)
wherefref denotes the reference frequency of "A4" tone, whilefk andn are the
frequen-cies of Fourier transform and the semitone bin scale index, respectively. Usually, different ap-proaches consider the range of frequencies between 100-200 Hz and 1-2 kHz, mainly because in this range the energy of the harmonic frequencies is stronger than non-harmonic frequencies of the semitones. In order to reduce transients and noise, similarly to Peeters [32] and Mauch et al. [30], smoothing over time using median filtering is applied. After filtering semitone bins are mapped to pitch classes, as follows:
c(n) = mod(n,12) (3.2)
A sequence of conventional 12-dimensional chroma vectors, known as chromagram is used as acoustic feature set. Each element of chroma vector corresponds to the energy of one of the 12 pitch classes.
3.2
Tuning
An important parameter in Equation (3.1) that greatly influences the quality of chroma features is the reference frequency of "A4" notefk. The task offkextraction is known as audio recording
mis-tuning estimation problem. In this section, we propose a method forfk estimation that is
based on the analysis of the spectral phase change.
In order to circumvent the problem of audio recording mis-tuning, a technique that was formerly developed for phase vocoder [49] is utilized to estimate the reference frequency. The proposed method allows for very precise and accurate frequency estimation of each sinusoid by performing the analysis of the degree of phase change. The block diagram of the proposed estimation scheme is depicted in figure 3.1.
The basic principle is to compute a second Fourier transform of the same signal, windowed by the same function shifted byDsamples. Letx[n]be a sequence of samples of the analyzed signal that contains some fundamental and harmonic components. Discrete Fourier Transform (DFT) is performed on the signal weighted by window functionw[n]as
Xw[t0, k] =
XN−1
n=0 w[n]x[n+t0]e
−2πjnk/N
(3.3)
wherekandN denote a bin number and the window size respectively.
CHAPTER 3. FEATURE EXTRACTION
t
Frame 1 Frame 2 D
Windowing
FFT
Magnitude Phase
Peak search
Windowing
FFT
Phase
Subtract
Divide by D
Frequency estimate
Figure 3.1: Block diagram of precise frequency estimates.
spectral resolution (and sometimes than a semitone distance). In such cases the energy of a harmonic component is distributed between adjacent bins, which represents an obstacle in the way of an accurate frequency estimation.
To cope with the above-mentioned problem, a second DFT is applied on the signal weighted by the same window, shifted byDsamples, from which the difference of the two given phases divided by the time interval ofDsamples is calculated as follows:
ω(D, N, t0) =
argXw[t0+D, k]−argXw[t0, k]
D (3.4)
The time intervalD is chosen so that the phase change for the maximum frequency is less than2π. Analyzing the obtained spectra in terms of phase-change allows for determining fre-quencies of harmonic components in a more accurate way, since all the adjacent bins containing the energy of a single harmonic have the same degree of phase change (see fig. 3.2).
Now, information obtained from peak-search algorithm is combined with phase-change spectrum in order to provide the final estimation. Positions of all possible candidates are checked in terms of the flatness of the corresponding frequency intervals in the phase-change spectrum.
3.3. PQMF-BASED CHROMA FEATURES
Fmax 0
Fmax 0
Fmax
f1 f2 f3
f f E
ω
f1 f2 f3
Figure 3.2: Magnitude and Phase-change spectrum.
3.3
PQMF-based chroma features
This section describes a novel approach to chroma extraction, which is based on the Pseudo-Quadrature Mirror Filters (PQMF) filter bank.
Chroma features can be extracted from audio in several different ways. The first option, which is the most common is to transform the audio to the frequency domain by means of Short-Time Fourier Transform (STFT) or Constant-Q Transform and subsequent assigning en-ergy from different spectral bins to chroma bins [19, 21]. When performing chroma extraction using transform to frequency domain, the signal in a given analysis frame is assumed to be stationary and it is also assumed that no note transitions occur inside it. Transients and noise may cause energy assignment to some frequencies that do not occur in the signal. Due to this assumptions, the analysis frame should be short enough. At the same time, frame size should be long enough to provide reasonable frequency resolution. A trade-off between frequency res-olution and stationarity should be made for a particular task. The most common frame lengths for capturing spectral content to form chroma vectors are 96ms - 360ms. As a rule, to provide smoothed feature sequence a high overlap ratio (50% – 90%) with subsequent median filter-ing or averagfilter-ing is applied. However, usfilter-ing such window lengths introduces inaccuracies with rapidly changing notes. On the other hand, short window lengths do not provide reasonable frequency resolution.
CHAPTER 3. FEATURE EXTRACTION
In this section, we propose a novel method that is based on multirate PQMF filter bank and subsequent periodicity estimation in the output of each filter. As opposed to the approach of Müller [33], passband of each filter is greater than semitone distance. We propose sample-by-sample periodicity estimation technique that can reflect close to instant frequency changes. Feature extraction process starts from passing the signal through a multirate filter bank. An ac-curate periodicity estimation is then performed on each filter output. It is assumed that features derived from this periodicity analysis reflect harmonic properties of the signal in a better way.
In the following sections, PQMF filter bank configuration is introduced and the proposed periodicity estimation technique is briefly described.
3.3.1 PQMF filter bank
(a) Pitch class profile extracted with the help of DFT of length 182 msec and 50% ovelap.
(b) Pitch class profile extracted with the help of suggested ap-proach with the frame length analysis of 23 msec.
Figure 3.3: Comparison of DFT chroma and PQMF-based chroma features.
Quadrature Mirror Filters (QMF) is a class of perfect reconstruction filter banks that divide frequency range into 2 channels. In practical applications sometimes more channels than 2 are needed. One of the possible decisions is to build a QMF-tree or to use alternative filter banks.
A Pseudo-QMF solution, an extension of QMF, is a near perfect reconstruction filter bank that was developed and successfully used for encoding audio in MPEG layer I and II formats. It consists ofN filters with equal passband bandwidths. In PQMF filter bank aliasing cancellation occurs only between adjacent bands [51].
3.3. PQMF-BASED CHROMA FEATURES
50 100 150 200 250 300 350 400 450 500 −0.005
0 0.005 0.01 0.015 0.02 0.025 0.03 0.035 0.04
Figure 3.4: Impulse response of the PQMF prototype filterh[n].
hk[n] =h[n] cos
k+1 2
(n−16) π
32
(3.5)
Filterbank configuration
The proposed novel approach for chroma extraction with the help of filter bank analysis is based on high-precision periodicity estimates in the output of each channel. There are some conditions to be met when designing a filter bank. Passband bandwidth of the selected channels should be compared to the frequency distance between adjacent semitones. It is desirable to have filters with narrow passband bandwidth to perform better separation of the harmonics. Since the semitone distance increases exponentially with the frequency and passband bandwidth is constant in all PQMF channels, a multirate filter bank was designed. In a multirate filter bank different channels are operated at different sampling rates. Thus, starting from a prototype filter one can design a filter bank with the desirable channel passband properties.
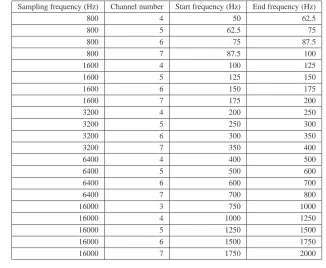
Audio analysis starts with downsampling and filtering through a number of channels. PQMF channels, sampling frequencies and passband bandwidths are presented in Table 3.1. Magnitude responses of the first 14 filters are depicted in Figure 3.5.
The outputs of all the filters are synchronized by taking into account the delay time of each output. In the next stage, each channel output is analyzed for periodicities as described in the following section.
3.3.2 PQMF-based chroma
CHAPTER 3. FEATURE EXTRACTION
Sampling frequency (Hz) Channel number Start frequency (Hz) End frequency (Hz)
800 4 50 62.5
800 5 62.5 75
800 6 75 87.5
800 7 87.5 100
1600 4 100 125
1600 5 125 150
1600 6 150 175
1600 7 175 200
3200 4 200 250
3200 5 250 300
3200 6 300 350
3200 7 350 400
6400 4 400 500
6400 5 500 600
6400 6 600 700
6400 7 700 800
16000 3 750 1000
16000 4 1000 1250
16000 5 1250 1500
16000 6 1500 1750
16000 7 1750 2000
Table 3.1: Filter bank configuration
0.1 0.2 0.3 0.4 0.5 0.6 −120
−100 −80 −60 −40 −20 0
Frequency (kHz)
Magnitude (dB)
Magnitude Response (dB)
Figure 3.5: Magnitude response of the first 14 PQMF filters.
3.3. PQMF-BASED CHROMA FEATURES
There are a lot of different approaches to periodicity estimation proposed in the litera-ture [52]. They are based on time-domain or frequency-domain analysis. In our approach we utilize time-domain analysis that is based on accurate sample-by-sample periodicity estima-tion. Normalized Cross-Correlogram (NCC) is obtained and analyzed for periodicities, which proved to be effective for pitch extraction from speech signals [53].
Cross-correlogram basics
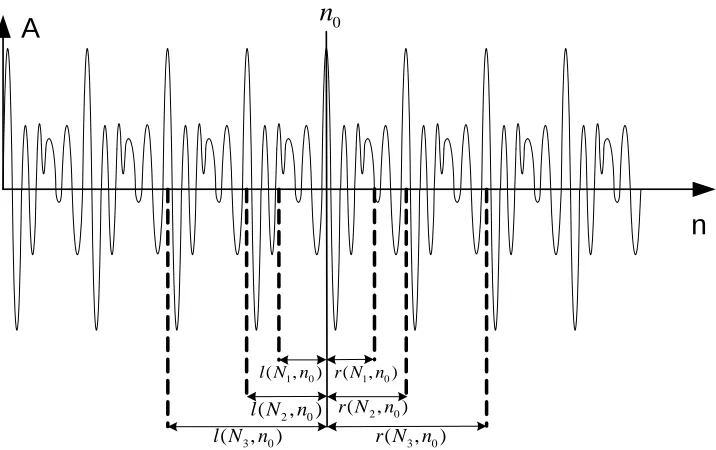
A variety of time domain methods for pitch estimation of speech signals were presented in [52]. Chung and Algazi [54] described the usage of auto-correlation and cross-correlation functions for the task. Our approach is based on the works of Medan et al. [53] and De Mori and Omol-ogo [55]. The above mentioned works aimed at extracting pitch from speech pronounced by a single speaker. Here we adapt this methodology to multi-pitch context. This is achieved by split-ting the frequency bandwidth of the signal into several subbands as described in section 3.3.1, and applying cross-correlation analysis on each channel separately.
Letx(n) be a discrete signal in the time domain sampled at a sampling frequencyFs. For
each time instantt0 =n0·Fs two vectors of samples are defined as follows:
lN,n0(n) =x(n−N +n0),0< n ≤N (3.6)
rN,n0(n) =x(n+n0),0< n≤N (3.7)
Here lN,n0(n) andlN,n0(n) denote left and right contexts of lengthN samples at the time
instantn0. Figure 3.6 shows an example of right and left contexts of different lengths N1, N2
andN3.
Let us assume that in the given intervals the signal is periodic with periodP. In the general case,P is a fractional number of samples that can be expressed asP = T
Fs whereT is a period
in seconds. Due to the fact that we operate on the filtered signal the potential periodicity range can be determined by the frequency values that lie inside the passband interval of the given channel:
fL< f < fR (3.8)
P = 1
f·Fs
(3.9)
HerefLandfRare the left and the right frequencies that define passband bandwidth of the
CHAPTER 3. FEATURE EXTRACTION
n
0
n
A
1 0
( , )
l N n r N n( 1, 0)
2 0
( , )
r N n
3 0
( , )
r N n
3 0
( , )
l N n
2 0
( , )
l N n
Figure 3.6: Example of left and right contexts of different lengths at the time instantn0.
The normalized cross-correlation coefficient between the left and the right contexts is com-puted as follows:
S(N, n0) =
lN,n0(n)·rN,n0(n)
|lN,n0(n)| · |rN,n0(n)|
(3.10)
Instantaneous periodP′ at the time instantn
0can be estimated as:
P′ =argmax
N
{S(N, n0)} (3.11)
High values of normalized cross-correlation can be observed in the multiples of the period. In figure 3.6 one can see that the context lengths of N2 and N3 samples provide high
cross-correlation coefficient between the left and the right contexts, while using the context lengths of N1samples results in lower cross-correlation value. Due to the fact that we have limited range
of possible period values defined by Equations (3.8) and (3.9), the ambiguity in the multiples of the period is avoided.
3.3. PQMF-BASED CHROMA FEATURES
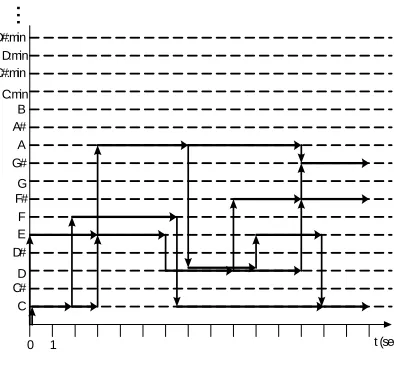
Figure 3.7: Crosscorrelogram for one of the filterbank channels.
3.3.3 From cross-correlogram to chroma representation
For a given frame, once estimated the periodicity valuePj for each samplej, the obtained data
are used to derive chroma vector. For a window sizedand for each framei, the frequencyfi
and the RMS energyErmsiare computed as shown below:
fi =
j′′
P
j=j′
Fs
Pj
j′′−j′+ 1 (3.12)
Ermsi =
j′′
P
j=j′
x(j)2
j′′−j′+ 1 (3.13)
wherej′ = ⌈i·d·F
s⌉ and j′′ = ⌊(i+ 1)·d·Fs⌋. The Ermsi portion of energy is added
to the chroma bin c(fi)that corresponds to the detected frequency fi based on the following
equation:
c(i) = 12log2
fi
fref
+ 69 (3.14)
wherefref is the reference frequency of the A4 note.
This operation is applied to all the filter bank outputs, and as a result a chroma representation is obtained, where a 12-bin chroma vector corresponds to each framei.
CHAPTER 3. FEATURE EXTRACTION
(a) Standard chroma of length 182 msec and 50% ovelap
(b) Standard chroma of length 46 msec and 50% ovelap
(c) PQMF-based chroma of length 23 msec and 0% ovelap
Figure 3.8: Unwrapped chroma vectors extracted from a short note passage by means of different ap-proaches.
Figure 3.8b depicts chroma for the same same signal, but extracted with the help of DFT of 46 msec with 50% overlap. In this case the analysis window size provides the necessary time-domain resolution for capturing rapid note changes, but on the other hand, low spectral resolution causes wide lobes of the spectral components that leads to spectral leakage.
3.4. TIME-FREQUENCY REASSIGNED CHROMA FEATURES
3.4
Time-frequency reassigned chroma features
In the past few years a lot of different techniques for accurate and relevant feature extraction in automatic chord recognition have been proposed. In this section we propose another method for chroma extraction that is based on the Time-Frequency Reassigned spectrum.
Feature extraction process is aimed at transforming a given waveform into a representation that captures desirable properties of an analyzed signal. A lot of acoustic features is derived from some kind of time-frequency representations, which can be obtained by mapping audio signal from one-dimensional time domain into two-dimensional domain of time and frequency. Spectrogram is one of the most widely spread time-frequency representations that has been successfully used in a variety of applications, where spectral energy distribution changes over time.
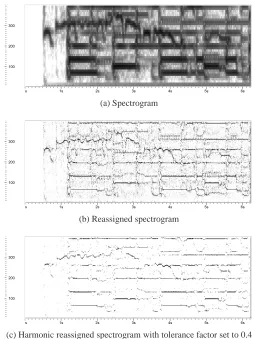
Time-frequency reassignment technique was initially proposed by Kodera et al. [56]. The main idea behind TFR technique is to remap spectral energy of each spectrogram cell into an-other cell that is the closest to the true region of support of the analyzed signal. As a result, "blurred" spectral representation becomes "sharper", that allows one to derive spectral features from reassigned spectrogram with much higher time and frequency resolution. Some papers have already investigated the usage of reassigned spectrogram in different tasks, such as sinu-soidal synthesis [57], cover song identification [58] and many others.
Now some mathematical foundations for the TFR technique are provided. Let x(n) be a discrete signal in the time domain sampled at a sampling frequencyFs.
At a given time instantt, STFT is performed on the signal weighted by a window function w(n)as in the following
X(t, k) =XM−1
n=0 w(n)x(n+t)e
−2πjnk/M, (3.15)
where k and M denote a bin number and the window size respectively. Spectrogram is derived from (3.3) as shown in (3.16).
P(t, k) =|X(t, k)|δ (3.16)
whereδ is equal to 2. The majority of chromagram extraction techniques uses this repre-sentation for mapping spectral energies to chroma bins, ignoring phase information as in the following
n(k) = 12log2
fk
fref
+69, n∈ ℜ+, (3.17)
wherefref denotes the reference frequency of "A4" tone, whilefkandnare the frequencies
CHAPTER 3. FEATURE EXTRACTION
On the other hand, the result of STFTX(t, k)can be presented in the following form:
X(t, k) =M(t, k)ejφ(t,k), (3.18)
whereM(t, k)is the magnitude, and φ(t, k)the spectral phase of X(t, k). As was shown in [59], reassigned time-frequency coordinates(ˆt,ωˆ)can be calculated as
ˆ
t(t, ω) = −∂φ(t, ω)
∂ω (3.19)
ˆ
ω(t, ω) = ω+ ∂φ(t, ω)
∂t (3.20)
Efficient computation of ˆt(t, ω) andωˆ(t, ω)in the discrete-time domain was proposed by Auger and Flandrin [60] and takes the following form:
ˆ
t(t, ω) =t− ℜ
XTw(t, ω)·X∗(t, ω)
|X(t, ω)|2
(3.21)
ˆ
ω(t, ω) =ω+ℑ
XDw(t, ω)·X∗(t, ω)
|X(t, ω)|2
(3.22)
whereXDw is the STFT of the signal weighted by a frequency-weighed window function,
XTw is the STFT of the signal weighted by a time-weighed window function ([59]).
Reallo-cating spectral energy from spectrogram coordinate(t, w)to(ˆt,ωˆ)concludes the reassignment operation. As a result more precise estimates of spectral energy distribution are obtained. How-ever, reassigned spectrogram can be noisy. A random energy can be located in points where there are no obvious harmonic or impulsive components. The principle of the reassignment technique is to reallocate energy from the geometrical center of the analysis window to the "center of gravity" of the spectral component this energy belongs to. Meanwhile, in some spec-tral regions, where there are no dominant components, large energy reassignment both in time and frequency can be observed. In order to obtain a better spectral representation and to refine the spectrogram keeping the energy of harmonic components and deemphasizing that of noisy and impulsive components, the following condition should be met [61]
∂2φ(t, ω)
∂t∂ω + 1
< A (3.23)