R E S E A R C H
Open Access
Household income differences in food sources
and food items purchased
Simone A French
1,3*, Melanie Wall
2, Nathan R Mitchell
1Abstract
Background:The present study examined income-related household food purchases among a sample of 90
households from the community.
Methods:Annotated food purchase receipts were collected for a four-week period by the primary household shopper. Receipt food source and foods items were classified into specific categories, and food quantities in ounces were recorded by research staff. For home sources, a limited number of food/beverage categories were recorded. For eating out sources, all food/beverage items were recorded. Median monthly per person dollars spent and per person ounces purchased were computed. Food sources and food categories were examined by
household income tertile.
Subjects and Setting:A community-based sample of 90 households.
Results:Higher income households spent significantly more dollars per person per month from both home and eating out sources compared with lower income households ($163 versus $100, p < .001). Compared with lower income households, higher income households spent significantly more home source dollars on both fruits/ vegetables (21.5 versus 10.2, p < .001) and sweets/snacks (17.3 versus 8.3, p < .001), but did not differ on home dollars spent on sugar sweetened beverages (2.0 versus 1.7, p < .46). The proportion of home beverages that were sugar sweetened beverages was significantly higher among lower income households (45% versus 26%, p < .01). Within eating out sources, lower income households spent a significantly greater percent of dollars per person at carry out places (54% versus 37%, p < .01). No income differences were observed for dollars spent at discount grocery stores, small grocery stores or convenience stores.
Conclusions:Higher income households spent more money on both healthy and less healthy foods from a wide range of sources. Lower income households spent a larger proportion of their eating out dollars at carry out places, and a larger proportion of their home beverage purchases were sugar sweetened beverages.
Introduction
Lower income is associated with a poorer diet
Population-based surveys of individual intake show that lower income is associated with a poorer quality diet [1]. Individuals with lower income consume fewer fruits and vegetables, a greater proportion of energy from fat, and less fiber compared to higher income individuals [1]. Data show that income disparities have a greater effect on dietary quality rather than on amount of cal-ories consumed [1-3].
Household food purchases and individual dietary intake quality
Examining food purchase patterns at the household level may provide insight into potential reasons for less healthful individual food intake. Household food pur-chases may influence individual intake through simple availability and from social influences such as behavioral modeling [4]. Lower income households purchase fewer fruits and vegetables compared with higher income households [5] and are more likely to patronize fast food restaurants than full-service restaurants when eat-ing out [6].
Two possible reasons for these differences in foods purchased and food sources selected are related to food cost and food availability. When food cost constraints * Correspondence: frenc001@umn.edu
1
Division of Epidemiology & Community Health, School of Public Health, University of Minnesota, Minneapolis, Minnesota, USA
Full list of author information is available at the end of the article
are high, as they are among lower income households, shoppers may choose more energy dense foods to maxi-mize the calories obtained per dollar expended [1,3,7,8]. This may result in less purchase of nutrient dense foods such as fruits and vegetables or cheaper versions of cer-tain food items [7,9]. The poor may also be constrained in the availability of food stores that are accessible to them. For example, lower income households may live in neighborhoods that lack large discount chain super-markets and thus may shop for food at higher-priced small grocery or convenience stores [10-12].
Eating out is another possible means by which house-hold income may influence individual dietary quality [13,14]. About half of U.S. food dollars are spent at eating out places [15,16]. Lower income households may choose less expensive restaurants when eating out, such as fast food places [6]. These eating out sources may offer less healthful, energy dense, but cheaper, foods [17].
The household food purchase receipt or record is a method that has been used to examine household food purchases (for a review, see French et al. [4,18-27]). Household food purchase receipt and record studies have focused on grocery store food purchases in relation to individual dietary intake. Most of these studies focused on nutrients and energy, and not on purchase and consumption at the food level. No studies have examined household food purchase receipts from eating out sources, despite the fact that eating out sources comprise about half of the US household food expendi-tures [13-16]. Most of these studies find modest agree-ment between household grocery store purchases and individual dietary intake [4,18-27].
The purpose of the present research was to explore income-related differences in household level food pur-chases that might be influenced by access to food sources and by food costs. The present paper reports associations between household income, food sources and food purchases among a community-based sample of 90 households. It was hypothesized that lower income households would be more likely than higher income households to spend their food dollars on home sources, such as grocery stores, rather than eating out sources. However, among eating out sources, it was hypothesized that lower income households would be more likely to spend food dollars at carry out places compared to full-service restaurants. Lower income households were hypothesized to spend more of their home source dol-lars at small grocery stores, convenience stores and gas stations, compared with higher income households. Lower income households were hypothesized to pur-chase fewer fruits and vegetables, more sweets and snacks and more sugar sweetened beverages compared to higher income households.
Experimental Methods
Study Population and Recruitment
Data for the present study were collected as part of a community-based household weight gain prevention intervention conducted in Minneapolis, Minnesota, USA
in 2007-2008 (French SA, Gerlach A, Mitchell N et al.
Household obesity prevention intervention targeting tel-evision, soft drinks, fast food and physical activity (under review). The study was a group-randomized trial, with households the unit of randomization, intervention and analysis. Data presented here are cross-sectional baseline data only. Households were recruited from the community over an eight-month period. Recruitment sources included community libraries, worksites, schools, daycare centers, health clinics, religious institu-tions, park and recreation centers, grocery stores and food co-ops. Fliers and brochures were distributed in local community centers, libraries, grocery stores and schools. In-person recruitment was conducted at com-munity events, health fairs, and after-school programs. Interested households contacted study staff and were screened for eligibility. Study eligibility criteria were related to the weight gain prevention intervention aims. Eligibility criteria included: 1) at least one child ages≥5
yrs and two household members ages≥12 yrs; 2)
resi-dence in a private house or apartment within 20 miles of the university; 3) household TV viewing weekly
aver-age of ≥10 hrs per person; 4) no household members
with dietary, medical, psychological, or physical limita-tions that would prevent their participation in interven-tion activities; and 5) willingness to be randomized to active intervention or control group. Eligibility was assessed during an initial telephone call conducted by a trained staff member and confirmed during an in-person baseline clinic visit. Overall, 732 inquiries were received, 289 families were eligible, 106 households completed the baseline clinic visit, and 90 households completed the baseline home visit and 4 week receipt data collec-tion and thus were enrolled in the study and rando-mized. The University of Minnesota IRB approved the study.
Data Collection Methods
required between 45 minutes and 2 hours, depending on the amount of food present in the household.
Primary shoppers were instructed to collect and anno-tate receipts and mail them to study staff on a weekly basis. Receipt annotation sheets queried the primary shopper for information about the food item, quantities, cost and source (name and type). Primary shoppers were instructed to query other household members about any food purchases they made during the week. The primary shopper was instructed to complete a receipt annotation sheet regardless of whether a receipt was available (e.g., if food was purchased from a vending machine or convenience store and no receipt was pro-vided). For simplicity, we use the term receipt to refer to receipt annotation sheet hereafter.
Due to the complexity and time required for receipt annotation, a decision was made to limit grocery store annotation to foods and beverages targeted by the inter-vention because of their potential link to excess weight gain. The specific targeted food categories were: fruits, vegetables, prepackaged snacks and sweets, prepackaged entrees, and beverages. For eating out receipts, primary shoppers were instructed to record all food and bever-age items on the annotation sheet, including entrees, side orders, and beverages such as alcohol and specialty drinks (e.g., lattes, smoothies, frapuccinos). Details about the receipt data collection and coding protocol are avail-able elsewhere [28].
Statistical Analysis
Statistical analyses were conducted using the Statistical Analysis System Release 8.2. (SAS Institute Cary, NC, USA) [29]. Food and beverage purchases for all receipt annotation sheets were included in all analyses (n = 2,483 annotation sheets). Summary variables were calcu-lated from the receipt data. Quantity in ounces and expenditures in dollars were summed within food and source categories for each household across the 4-weeks of receipts. To adjust for differences in number of peo-ple living in the household, per person dollars and ounces variables were created. Specifically, each house-hold quantity variable (e.g., total dollars spent at home food sources on fruits and vegetables) was divided by the number of persons five years and older living in the household. In addition, to examine different ratios of specific food or source purchases, household percent variables were created taking the total purchases in a specific food or source category and dividing by the total purchases in the broader category (e.g. % eating out dollars spent at carry-out sources = total dollars per person spent at carry-out sources divided by total dol-lars per person spent eating out).
To examine purchases by household income, tertiles of household income were created based on
self-reported household income from the clinic data collec-tion visit. Personal pre-tax income was reported only on the adult survey, and all adult income was summed within the household to generate the household income. Median values for each study variable are presented by household income and statistical tests of increasing or decreasing trends across income were performed using the Jonckheere-Terpstra test, which is a non-parametric test for trend [30]. The household demographic charac-teristics were self-reported by the primary shopper for the household.
Results
Receipt completion rates
One hundred six households completed the initial base-line clinic visit. Of these, 90 households completed four weeks of receipt collection and were enrolled in the study. Households were enrolled and randomized only if the baseline clinic visit, the home visit, and the four-week receipt collection activity were completed. Thus, the drop out rate from clinic visit to receipt collection was 15% (90/106 = 85% completers). A total of 2,483 receipt annotation sheets were returned by the 90 households. Of these, 1,892 (75.2%) included receipts plus annotation sheets, and 591 included annotation sheets only (no receipt). A total of 9,498 food line items were included in the receipt annotation sheets.
Households differed in the number of receipts returned to research staff. The number of receipts returned by a household depends on many factors, including household income and the number of adults and children who reside in the household. The median number of receipts returned by high, medium and low income households was 35, 21, and 19, respectively. Only 10 households returned 10 or fewer total receipts during the four week receipt collection period. Of these 10 households, 1, 2, and 7 were high, medium and low income, respectively. Compared with households that turned in more than 10 receipts, households that turned in 10 or fewer receipts reported lower income (US $44,000 versus US $83,101), had primary shoppers who were less educated (30% advanced education versus
64%), and had a higher body mass index (34.7 kg/m2
versus 29.0 kg/m2).
Household descriptive characteristics
household income was distributed as follows: 35%≤ US $45,000 per year; 30% between US $50,000 and $95,000;
and 35% ≥ US $100,000 per year. The average body
mass index for the primary shopper was 29.7 kg/m2
(SD = 7.2 kg/m2). Household primary shoppers reported eating from a carry-out restaurant 2.3 times and from a sit down restaurant 1.1 times during the preceding week. On average, household primary shoppers reported that the household ate six meals together during the preceding week.
Household food sources by income
Table 1 shows the household weekly dollars spent per person from each food by income group. Overall, higher income households spent more per person from both home and eating out sources compared with lower income households. As a percent of total food spending, lower income households spent 73% of their food dol-lars from home sources compared with 63% among higher income households (P= .09). As a percent of eat-ing out dollars, lower income households spent more at
carry out restaurants (54%) compared with higher
income households (37%) (P= .01).
Household per person monthly dollars spent was sig-nificantly higher among middle and high income house-holds for premium chain grocery stores, and among high income households for wholesale stores and speci-alty food stores. No significant income differences were observed for per person dollars spent at discount chain grocery stores, small grocery stores, convenience stores, gas stations or nonfood stores.
Household foods purchased by income
Table 2 shows the household monthly per person dol-lars spent for each food category by household income group. Dollars spent at home sources (left panel) and eating out sources (right panel) are presented. Com-pared with lower income households, home and eating out fruit and vegetable purchases (dollars per person), home purchases for snacks and sweets, and eating out entrees and side order purchases were significantly higher among high income households.
Table 1 Per Person Dollars Spent Monthly from Home and Eating Out Sources by Income*
Source N Receipts Low Med High P
Home Sources $ 1111 80.06 80.09 105.02 .013
Eating Out Sources $ 1372 22.77 36.2 55.4 .002
Total $ 100.2 115.44 163.48 .001
% of Total $ from Home Sources 73 71 63 .086
% of Total $ from Eating out Sources 27 29 37 .086
Eating out Sources N Receipts Low Med High P
Carry out 756 14.17 12.67 20.34 .055
Restaurants 345 5.93 11.52 27.09 .004
Cafeteria (means) 135 0.93 2.18 3.6 .049
Vending (means) 51 0.12 0.11 0.54 .011
Bar/tavern (means) 15 0.79 0.64 1.02 .227
Other eating out (means) 70 3.25 2.71 3.29 .199
% of eating out $ from carry out 54 49 37 .011
Home Sources N Receipts Low Med High P
Discount grocery chain 465 48.88 57.59 52.24 .455
Premium grocery chain (means) 163 5.48 26.90 26.16 .037
Wholesale store (means) 48 4.38 2.85 11.34 .024
Farmers market (means) 17 0.41 0.45 1.17 .094
Small grocery (means) 22 0.17 0.36 0.87 .110
Ethnic market (means) 4 0.04 0.16 0.27 .261
Specialty foods (means) 55 1.39 2.06 4.08 .049
Convenience store 199 3.91 2.90 4.25 .239
Gas station (means) 67 0.97 0.49 1.26 .095
Non-food store (means) 43 0.47 1.11 0.31 .296
Unknown store (means) 26 0.26 0.13 0.73 .327
Mail order 2 — — — —
% of home $ from convenience & gas store 10 10 7 .425
No income-related differences were observed for sugar sweetened beverage purchases from home or eating out sources. However, the percent of home beverage dollars spent for sugar sweetened beverages was significantly higher among lower income households (45%) compared with higher income households (26%). Higher income households spent significantly more dollars per person on non-caloric beverages from both home and eating out sources. The relative proportion of per person dol-lars spent on sweets and snacks versus fruits and vegeta-bles did not significantly differ by household income.
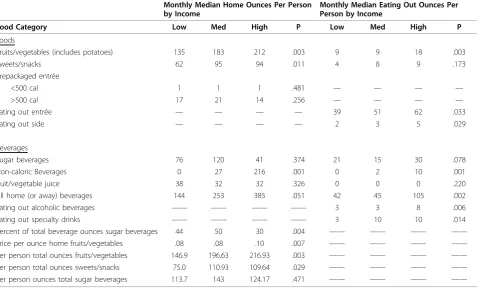
Household food quantities purchased by income
The total ounces purchased for each food and beverage category is shown in Table 3 for home and eating out sources. Overall, the pattern of results was virtually identical to that observed for the per person dollars spent by household income group. Higher income households purchased greater quantities of fruits and vegetables, sweets and snacks (home sources only), eat-ing out entrees and side orders, and non-caloric bev-erages. Compared with lower income households, higher income households purchased a smaller percent of their total beverage ounces as sugar sweetened beverages and paid more per ounce for fruits and vegetables.
Discussion
It was initially hypothesized that higher income house-holds would spend more on healthful foods and less on
sugar-sweetened beverages and snack foods [1-3,5]. The results of the present research show that relative to lower income households, higher income household spent more dollars per person on both healthful and less healthful foods. These findings are consistent with US national consumer expenditure survey 2004-2005 data that show low-income households report food spending of US $413 per month compared with US $870 per month among high-income households [31,32]. Also consistent with US national consumer expenditure survey data, higher income households pur-chased significantly more fruits and vegetables compared with lower income households. In the 2004-2005 US household consumer expenditure data, higher income households spent US $76 per month and lower income households spent US $49- US $57 per month on fruits and vegetables [31,32]. In the US national consumer expenditure survey 2004-2005, higher income groups purchased significantly more foods classified as “other,” which include some of the foods for which higher income households in the present study spent more, such as snacks, sweets, prepackaged foods, frozen meals and nonalcoholic beverages. Data from the present study and the national data suggest that higher income households purchase more fruits and vegetables and dis-cretionary convenience foods compared with lower income households. Only sugar sweetened beverages, when examined as a proportion of home spending, were significantly higher among lower income households.
Table 2 Per Person Dollars Monthly for Food Categories from Home and Eating Out Sources by Income
Home Monthly Dollars Spent* by Income Eating Out Dollars Spent* by Income
Food Category Low Med High P Low Med High P
Foods
Fruits/vegetables (includes potatoes) 10.27 16.65 21.56 .001 1.39 1.75 3.17 .003
Sweets/snacks 8.38 15.77 17.36 .001 1.13 2.10 2.45 .061
Prepackaged entrée
<500 cal 0.92 1.35 0.92 .481 – — — —
>500 cal 2.88 3.20 2.08 .375 — — — —
Eating out entrée — — — — 15.59 19.61 33.1 .003
Eating out side — — — — 0.0 0.68 0.99 .014
Beverages
Sugar beverages 1.75 2.67 2.08 .464 1.15 1.23 1.75 .056
Non-caloric beverages 0.0 0.87 3.12 .001 0 0 0.82 .001
Fruit/vegetable juice 1.34 1.54 1.66 .091 0 0 0 .220
Sum of all home (or away) beverages 4.12 6.56 9.31 .014 3.33 5.48 10.49 .002
Eating out alcoholic beverages (means) — — — — 1.54 1.77 3.31 .029
Eating out specialty drinks (means) — — — — 1.41 2.93 3.61 .012
% of home $ from sweets/snacks 14 18 19 .009 — — — —
% of home $ from fruits/vegetables 14 16 22 .001 — — — —
% home beverage $ from sugar beverage 45 38 26 .014 — — — —
Ratio of sweets/snacks $ to fruits/vegetables $ 0.95 0.89 0.97 .473 — — — —
Other data suggest more subtle differences among lower and higher income households in the healthfulness of their food purchases. For example, US individual dietary intake survey data show that lower income households consume significantly more beef compared to higher income households [33]. Other data show that meat is a high priority food item among lower income house-holds, while fruit and vegetables are not [34]. These data are suggestive and make it clear that additional focused research with precise measures of household food spending and detailed measures of specific foods purchased are needed. This type of research will shed light on the process by which lower income households spend less money for perhaps more energy dense foods that may contribute to excess weight gain and obesity [1-3,35]. It also may help explain how higher income households are able to spend more money on food and beverages but remain less likely to develop obesity.
Food purchase sources were also hypothesized to dif-fer by household income, such that lower income households would purchase a larger proportion of their food purchases from sources such as convenience stores and small markets, which typically have more expensive and less healthful food choices. The results of the pre-sent study did not support this hypothesis. Lower income households did not differ from higher income households in the per person dollars spent at discount
chain grocery stores, small grocery stores, convenience stores, gas stations or nonfood stores. The majority of food purchases were from discount chain grocery stores, regardless of household income level. Higher income households spent significantly more dollars per person from premium chain discount stores, wholesale stores and specialty food stores. Thus, in this sample of house-holds, access to large chain retail food outlets does not seem to be a barrier specific to lower income households.
Higher income households spend a larger proportion of their food dollars eating out [31]. US national consu-mer expenditure 2004-2005 survey data show that low income households spend 26% of their food dollars eat-ing out, compared with 47% among high income house-holds [31]. The present study found that higher income households spent 37% of their total food dollars eating out, compared with 27% among lower income house-holds, a marginally significant difference. As a propor-tion of eating out dollars, low income households in the present study spent significantly more on carry-out food places, and higher income households spend signifi-cantly more at full-service restaurants. These eating out food source patterns may reflect choices about food cost and food quality that differ by household income and may contribute to the low-income obesity paradox [1-3,35].
Table 3 Per Person Ounces for Food Categories from Home and Eating Out Sources by Income
Monthly Median Home Ounces Per Person by Income
Monthly Median Eating Out Ounces Per Person by Income
Food Category Low Med High P Low Med High P
Foods
Fruits/vegetables (includes potatoes) 135 183 212 .003 9 9 18 .003
Sweets/snacks 62 95 94 .011 4 8 9 .173
Prepackaged entrée
<500 cal 1 1 1 .481 — — — —
>500 cal 17 21 14 .256 — — — —
Eating out entrée — — — — 39 51 62 .033
Eating out side — — — — 2 3 5 .029
Beverages
Sugar beverages 76 120 41 .374 21 15 30 .078
Non-caloric Beverages 0 27 216 .001 0 2 10 .001
fruit/vegetable juice 38 32 32 .326 0 0 0 .220
All home (or away) beverages 144 253 385 .051 42 45 105 .002
Eating out alcoholic beverages —— —— —— —— 3 3 8 .006
Eating out specialty drinks —— —— —— —— 3 10 10 .014
Percent of total beverage ounces sugar beverages 44 50 30 .004 —— —— —— ——
Price per ounce home fruits/vegetables .08 .08 .10 .007 —— —— —— ——
Per person total ounces fruits/vegetables 146.9 196.63 216.93 .003 —— —— —— ——
Per person total ounces sweets/snacks 75.0 110.93 109.64 .029 —— —— —— ——
These results suggest that the overall amount of money available for food purchases may be the main characteristic related to food purchases by households of different income levels, more than a lack of access to food outlets. Although lower-income households may shop at similar food sources, the types and quality of the foods they purchase may be different from higher income households. For example, in the present study, lower income households may have economized by pur-chasing less expensive versions of food such as fruits and vegetables. However, it does appear that when they do purchase beverages from stores, a large percent of the beverages are sugar beverages. They also chose carry out restaurants more often than full-service restaurants. Thus, the lower income households appear to have choices about where to shop and what to buy. Higher income households may have more choices, given the greater amount of money they can afford to spend on food of all types from all sources. Food price is less of a barrier to purchase choices for high income households.
Strengths and Limitations
The present study had several strengths. Detailed data were available on the frequency of food purchases from a wide range of retail food sources over a lengthy time per-iod. The sample was a diverse community sample of households with a range of configurations of adults and children. Eating out sources were included in the receipt collection and annotation. Limitations of the study included the lack of coding of every grocery store food and beverage item purchased and the study’s focus on certain targeted food and beverage categories. It is not known whether the receipt collection captured all food and beverage purchases during the four week period, nor whether the purchases of all household members were captured. The number of eating-out receipts declined over the four-week period, suggesting that frequent small purchases from coffee shops or fast food places may not have been completely captured [28]. However, 88% of the household primary shoppers reported that their grocery store food and beverage purchases were well-represented in the receipts data, and 75% reported that their restau-rant and fast food purchases were well-represented in the receipt data [28]. The number of receipts differed by household income, which could have biased the observed results in some way.
The households that comprised the sample were not representative of the community and self-selected to participate in a weight gain prevention intervention involving eating, physical activity and television viewing behaviors. Compared to national census statistics, the sample was comprised of more married (65% versus 51% nationally), well educated (26% greater than college degree versus 9% nationally) and higher income people
(65% income > = US $50,000 versus 50% nationally) [36]. Thus, the generalizability of the results is not known.
Future research is needed to examine household income-related food and beverage purchasing patterns in a representative sample of households. Documenta-tion of food sources other than retail food stores is needed, particularly among lower income households that may receive food from sources such as food shelves or federal food programs. Examination of the full range of foods purchased will also provide more complete data about household income differences in food purchases, both sources and types of foods and beverages. A more detailed collection and analysis of specific food types and prices paid will help provide a more clear under-standing of how lower income households spend less money for food but perhaps purchase more calories and thus increase risk of excess weight gain and obesity. These data will also help clarify how higher income households can spend more money on food and bev-erages but remain at lower risk of excess weight gain.
Conclusions
Higher income households spent more money on all types of foods from a wide range of sources. Lower income households spent a larger proportion of their eating out dollars at carry out places, and a larger pro-portion of their home beverage purchases were sugar sweetened beverages. More detailed research on house-hold food spending can promote a better understanding of how retail food sources, food prices and specific foods purchased contribute to household energy pur-chased, energy balance and risk for excess weight gain.
Acknowledgements
This study was supported by grant #1U54CA116849 and #R21CA137240 from the National Institutes of Health/National Cancer Institute.
Author details
1Division of Epidemiology & Community Health, School of Public Health,
University of Minnesota, Minneapolis, Minnesota, USA.2Division of Biostatistics, School of Public Health, University of Minnesota, Minneapolis, Minnesota, USA.3Division of Epidemiology & Community Health, 1300 South 2nd St, Suite 300 Minneapolis, Minnesota 55454, USA.
Authors’contributions
SAF conceptualized the research idea and drafted the manuscript. NRM and MW conducted data analysis, provided scientific input and edited the manuscript. All authors read and approved the final manuscript.
Competing interests
The authors declare that they have no competing interests.
Received: 31 March 2010 Accepted: 26 October 2010 Published: 26 October 2010
References
2. Cade J, Booth S:What can people eat to meet the dietary goals and how much does it cost?J Hum Nutr Diet1990,3:199-207.
3. Darmon N, Ferguson EL, Briend A:A cost constraint along has adverse effects on food selection and nutrient density: An analysis of human diets by linear programming.J Nutr2002,132:3764-71.
4. French SA, Shimotsu ST, Wall M,et al:Capturing the spectrum of household food and beverage purchasing behavior: A review.J Am D iet Assoc2008,108:2051-8.
5. Blisard N, Stewart H, Jolliffe D:Low-income households’expenditures on fruits and vegetables.USDA Economic Research Service: Agricultural Economic Report No. 833; 2004.
6. Stewart H, Blisard N, Bhuyan S,et al:The demand for food away from home: Full-service or fast food?USDA Economic Research Service: Report No. 829; 2004.
7. Cade J, Upmeier H, Calvert C,et al:Costs of a healthy diet analysis from the UK Women’s Cohort Study.Public Health Nutr1999,2:505-12. 8. Jetter KM, Cassady DL:The availability and cost of healthier food
alternatives.Am J Prev Med2006,30:38-44.
9. Leibtag ES, Kaufman PR:Exploring food purchase behavior of low-income households: How do they economize?USDA Economic Research Service: Agricultural Economic Report Bulletin No. 747-07; 2003.
10. Chung C, Myers SL:Do the poor pay more for food? An analysis of grocery store availability and food price disparities.J Consum Aff1999, 33:276-96.
11. Morland K, Wing S, Diez Roux A,et al:Neighborhood characteristics associated with the location of food stores and food service places.Am J Prev Med2001,22:23-9.
12. Winkler E, Turrell G, Patterson C:Does living in a disadvantaged area entail limited opportunities to purchase fresh fruit and vegetables in terms of price, availability, and variety? Findings from the Brisbane Food Study.Health Place2005,12:741-8.
13. Lin BH, Guthrie J, Frazao E:Nutrient contribution of food away from home.Edited by: Frazao E. America’s eating habits: Changes and consequences. USDA Economic Research Service; 1999.
14. French SA, Story M, Jeffery RW:(2001) Environmental influences on eating and physical activity.Annu Rev Public Health2001,22:309-35.
15. National Restaurant Association:Restaurant.org Restaurant Industry Fact Sheet.2010 [http://www.restaurant.org].
16. Guthrie JF, Lin BH, Frazao E:Role of food prepared away from home in the American diet, 1977-78 versus 1994-1996: Changes and consequences.J Nutr Educ Behav2002,34:140-50.
17. McDonalds Corporation Nutrition Facts (2009): 2010 [http://www. mcdonalds.com].
18. Cullen K, Baranowski T, Watson K, Nicklas T, Fisher J, O’Donnell S, Baranowski J, Islam N, Missaghian M:Food category purchases vary by household education and race/ethnicity: Results from grocery receipts.J Am Diet Assoc2007,107:1747-1752.
19. Turrini A, Saba A, Perrone D, Cialfa E, D’Amico A:Food consumption patterns in Italy: the INN-CA study 1994-1996.Eur J Clin Nutr2001, 55:571-588.
20. Rankin JW, Winett RA, Anderson ES,et al:Food purchase patterns at the supermarket and their relationship to family characteristics.J Nutr Educ 1998,30:81-88.
21. Ransley JK, Donnelly JK, Khara TN,et al:The use of supermarket till receipts to determine the fat and energy intake in a UK population. Public Health Nutr2001,4:1279-1286.
22. DeWalt KM, D’Angelo S, McFadden M, Danner FW, Noland M, Kotchen JM: The use of itemized register tapes for analysis of household food acquisition patterns prompted by children.J Am Diet Assoc1990, 90:559-62.
23. Sekula W, Nelson M, Figurska K, Oltarzewski M, Weisell R, Szponar L: Comparison between household budget survey and 24-hour recall data in a nationally representative sample of Polish households.Public Health Nutr2005,8:430-439.
24. Becker W:Comparability of household and individual food consumption data: Evidence from Sweden.Public Health Nutr2001,4(5B):1177-1182. 25. Lambe J, Kearney J, Becker W, Hulshof K, Dunne A, Gibney MJ:Predicting
percentage of individuals consuming foods from percentage of households purchasing foods to improve the use of household budget surveys in estimating food chemical intake.Public Health Nutr1998, 1:239-247.
26. Nelson M, Dyson PA, Paul AA:Family food purchases and home food consumption: Comparison of nutrient contents.Br J Nutr1985, 54:373-387.
27. Riccuito L, Tarasuk V, Yatchew A:Socio-demographic influences on food purchasing among Canadian households.Eur J Clin Nutr2006,60:778-790. 28. French SA, Wall M, Mitchell N,et al:Annotated receipts capture food
purchases from a broad range of sources.Int J Behav Nutr Phys Act2009, 6:37, (July 1, 2009).
29. Statistical Analysis System/STAT:Release 8.2SAS Institute Cary, NC, USA; 2001.
30. Pirie W:“Jonckheere Tests for Ordered Alternatives”.InEncyclopedia of Statistical Sciences. Volume 4.Edited by: Kotz S, Johnson NL. New York: John Wiley 1983:315-318.
31. Frazao E, Andrews M, Smallwood D, Prell M:Food spending patterns of low income households: Will increasing purchasing power result in healthier food choices? United States Department of Agriculture, Economic Research Service.Economic Information Bulletin; 2007, 29-4. 32. Guthrie JF, Frazao E, Andrews M, Smallwood D:Improving food choices:
Can food stamps do more?Amber WavesUnited States Department of Agriculture, Economic Research Service; 2007.
33. Davis CG, Lin BH:Factors affecting US beef consumption.United States Department of Agriculture, Economic Research Service; 2005, LDP-M-135-02. 34. Wiig K, Smith C:The art of shopping on a food stamp budget: Factors
influencing food choices of low income women as they try to make ends meet.Pub Health Nutr2008,12:1726-1734.
35. Dinour LM, Bergens D, Yeh MC:The food insecurity-obesity paradox: A review of the literature and the role food stamps may play.J Am Diet Assoc2007,107:1952-1961.
36. US Bureau of the Census: Census 2000 Briefs. 2009 [http://www.census. gov/main/www/cen2000.html], Accessed April 26, 2009.
doi:10.1186/1479-5868-7-77
Cite this article as:Frenchet al.:Household income differences in food sources and food items purchased.International Journal of Behavioral Nutrition and Physical Activity20107:77.
Submit your next manuscript to BioMed Central and take full advantage of:
• Convenient online submission
• Thorough peer review
• No space constraints or color figure charges
• Immediate publication on acceptance
• Inclusion in PubMed, CAS, Scopus and Google Scholar
• Research which is freely available for redistribution