Open Access
Research
Using built environment characteristics to predict walking for
exercise
Gina S Lovasi*
1, Anne V Moudon
2,3, Amber L Pearson
4, Philip M Hurvitz
2,
Eric B Larson
5, David S Siscovick
6,7, Ethan M Berke
8, Thomas Lumley
9and
Bruce M Psaty
6,7,10Address: 1Institute for Social and Economic Research and Policy, Columbia University, New York, NY, USA, 2Urban Design and Planning,
University of Washington, Seattle, WA, USA, 3Architecture, Landscape Architecture, University of Washington, Seattle, WA, USA, 4Department of
Geography, University of Washington, Seattle, WA, USA, 5Center for Health Studies, Group Health Cooperative, Seattle, WA, USA, 6Department
of Epidemiology, University of Washington, Seattle, WA, USA, 7Department of Medicine, University of Washington, Seattle, WA, USA, 8Community and Family Medicine, Dartmouth Medical School, Hanover, NH, USA, 9Department of Biostatistics, University of Washington,
Seattle, WA, USA and 10Department of Health Services, University of Washington, Seattle, WA, USA
Email: Gina S Lovasi* - [email protected]; Anne V Moudon - [email protected];
Amber L Pearson - [email protected]; Philip M Hurvitz - [email protected]; Eric B Larson - [email protected]; David S Siscovick - [email protected]; Ethan M Berke - [email protected]; Thomas Lumley - [email protected]; Bruce M Psaty - [email protected]
* Corresponding author
Abstract
Background: Environments conducive to walking may help people avoid sedentary lifestyles and associated diseases. Recent studies developed walkability models combining several built environment characteristics to optimally predict walking. Developing and testing such models with the same data could lead to overestimating one's ability to predict walking in an independent sample of the population. More accurate estimates of model fit can be obtained by splitting a single study population into training and validation sets (holdout approach) or through developing and evaluating models in different populations. We used these two approaches to test whether built environment characteristics near the home predict walking for exercise. Study participants lived in western Washington State and were adult members of a health maintenance organization. The physical activity data used in this study were collected by telephone interview and were selected for their relevance to cardiovascular disease. In order to limit confounding by prior health conditions, the sample was restricted to participants in good self-reported health and without a documented history of cardiovascular disease.
Results: For 1,608 participants meeting the inclusion criteria, the mean age was 64 years, 90 percent were white, 37 percent had a college degree, and 62 percent of participants reported that they walked for exercise. Single built environment characteristics, such as residential density or connectivity, did not significantly predict walking for exercise. Regression models using multiple built environment characteristics to predict walking were not successful at predicting walking for exercise in an independent population sample. In the validation set, none of the logistic models had a C-statistic confidence interval excluding the null value of 0.5, and none of the linear models explained more than one percent of the variance in time spent walking for exercise. We did not
Published: 29 February 2008
International Journal of Health Geographics 2008, 7:10 doi:10.1186/1476-072X-7-10
Received: 27 November 2007 Accepted: 29 February 2008 This article is available from: http://www.ij-healthgeographics.com/content/7/1/10
© 2008 Lovasi et al; licensee BioMed Central Ltd.
detect significant differences in walking for exercise among census areas or postal codes, which were used as proxies for neighborhoods.
Conclusion: None of the built environment characteristics significantly predicted walking for exercise, nor did combinations of these characteristics predict walking for exercise when tested using a holdout approach. These results reflect a lack of neighborhood-level variation in walking for exercise for the population studied.
Background
Environments that make walking feasible and appealing have been labeled as "pedestrian-oriented" [1] or "walka-ble" [2]. Such environments may help local residents to maintain active lifestyles and to avoid health conditions for which sedentary behavior is a known risk factor, including obesity, diabetes, cardiovascular disease, and some types of cancer [3]. Residential density, connectivity, land use mix, facilities, paths, and aesthetic features have all been studied as predictors of walking or physical activ-ity [1,2,4-12], but results for these studies have not been consistent. Residential density and connectivity, for exam-ple, are associated with walking or physical activity in some studies [13-15], but not in others [16,17]. Unex-pected but significant findings have been reported as well, including more walking or physical activity in neighbor-hoods with reduced access to shops [18,19], fewer physi-cal activity facilities [20,21], or poor sidewalk conditions [22].
Discordance among studies may be due to differences in populations, disagreement between perceptions and objective measures of the environment, or environmental measurement at aggregate levels that mask relevant small-scale variation [1,4,9]. More specifically, individuals may respond differently to their environment depending on their age, affluence, car ownership, physical functioning, attitudes, preferences, or other traits. The differences between perceived neighborhood characteristics and objectively measured characteristics are potentially prob-lematic because being active may change one's percep-tions of the environment, making it difficult to separately identify the effect of environmental characteristics on activity. On the other hand, perceptions and objective characteristics may differ because the area measured through "objective" geographic data do not reflect the environment as experienced [23,24], either because the scale is too large or because the shape is not customized to reflect pertinent social or physical boundaries; objective is placed in quotes here because this term has been used to indicate that the data have come from an external source such as a government agency or commercial firm, sources which may themselves provide imprecise or biased data.
Associations between built environment characteristics and physical activity may also depend on the precision or
nature of the physical activity measurement. It is impor-tant to note that the built environment characteristics that have been used to assess neighborhood walkability may influence walking as a mode of transportation [2,7,25,26]; our study, on the other hand, evaluates whether these characteristics are associated with walking for exercise. Characteristics of the built environment are most strongly correlated with transportation-related activ-ities, especially walking and biking, that occur within the environmental context of study [17,19,27-29]. However, measures of leisure-time physical activity, including walk-ing for exercise or recreational purposes, may also warrant attention because of the link between leisure-time physi-cal activity and health. In our study, walking for exercise was measured because of the established association between regular or brisk walking and cardiovascular health [30-33]. Prior studies of walking for exercise or other leisure-time physical activity have provided some support for the relevance of residential density, street con-nectivity, sidewalk availability, proximity to potential des-tinations or fitness centers and parks for these outcomes [1,22,34-40]. However, one should note that the built environment characteristics we measured may have pub-lic health relevance through a pathway that does not include walking for exercise.
hold-out approach involves exploration and model fitting for a random selection of the study data, called the training set. The remaining data, called the validation or test set, is reserved for replication of the initial results, and to esti-mate of how well the model would fit an independent sample of data. False positive findings are unlikely to be replicated in the validation set.
In this study, data for a healthy population in Washington State were analyzed using a holdout approach. Our objec-tive was to evaluate whether built environment character-istics near the home could be used to predict walking for exercise. We created models using built environment char-acteristics near each participant's home address to predict walking for exercise, and then evaluated these models on a random subset of the study data. We also evaluated models based on data from a previously described study using a different sampling frame within the same region [27,42].
Materials and methods
Study setting and populationData came from the Heart and Vascular Health (HVH) study, an ongoing population-based case-control study in the Puget Sound Region of Washington State [46]. Sub-jects lived in King, Kitsap, Pierce, Snohomish, and Thurston counties; King County, the most populous of these, contains the City of Seattle. Although much of the land area included is rural, 97 percent our study popula-tion lived in non-rural areas (defined as a residential den-sity ≥ 96.5 units/km2 [250 units/mi2] [47]).
The HVH study was designed for investigating pharmaco-logical and genetic influences on cardiovascular disease, but we used data on 1,608 control participants to examine the effects of the built environment on walking for exer-cise. The controls from this study were a stratified random sample of 30 to 79 year old members of Group Health, a large health maintenance organization serving approxi-mately 500,000 Washington State residents. Participants gave informed consent, and the human subjects review committee at Group Health and the University of Wash-ington approved all study procedures.
Only controls were included in this analysis, to limit pos-sible recall bias or confounding by preclinical cardiovas-cular disease. Participants were also excluded if they had a documented history of myocardial infarction, stroke, con-gestive heart failure or angina, or if they reported fair or poor health prior to their reference date. These exclusions were designed to identify a healthy population in which physical activity might be important for primary preven-tion of disease, while excluding those with major health limitations that could influence both place of residence and physical activity patterns.
We randomly assigned each participant a reference date within the year of selection as a control (1995 to 2001). Information preceding the reference date was collected from medical records and telephone interviews; the refer-ence date was used by the original study to ensure compa-rable data quality for myocardial infarction cases and frequency matched controls. Telephone interviews took place from 1995 to 2004, an average of about two years (standard deviation: 0.7 years) after the assigned reference date; 76 percent of eligible, contacted controls agreed to participate in a telephone interview. Compared with par-ticipants who allowed us only to examine their medical record, participants completing the telephone interview were more likely to have treated hypertension, treated dia-betes, or a body mass index above 30 and less likely to be residents of King County (chi-squared test p < 0.05).
Physical activity and participant characteristics
The telephone interview included questions on physical activity derived from the Minnesota Leisure-Time Physical Activity questionnaire [48]. The Minnesota Leisure-Time Physical Activity questionnaire has a high test-retest relia-bility [49] for physical activity over the last year, with one month interval between tests, but has been modified for our study. Participants in the HVH study were asked to report the frequency and duration of their participation in 26 types of physical activity, including "walking for exer-cise", for a one-month period before their reference date. Frequency and average duration were used to estimate the minutes per week spent walking for exercise. Previous studies have found that data from this questionnaire on physical activity or walking for exercise are associated with incident myocardial infarction in this study population [46,50], which suggests the modified questionnaire has predictive validity and relevance to cardiovascular health.
The telephone interview also included questions on the participant's race, general health status (classified as excel-lent, very good, good, fair, or poor), smoking status, employment status, education, and income. Data from Group Health medical and pharmaceutical records were used to assess whether each participant had treated hyper-tension or treated diabetes. Measured height and weight were taken from the medical record and used to calculate body mass index (weight in kilograms/height in meters, squared). Obesity was defined as a body mass index above 30.
Addresses and geocoding
were geocoded following manual cleaning of the address data. Participants were excluded if they had no address or only a Post Office box available (n = 79); an address that could not be geocoded (n = 4); or an address located out-side of the five-county study area (n = 72).
One-kilometer airline buffers (circles with one kilometer radius surrounding each address) were created using ArcView 3.2 (ESRI, Redlands/CA, 1999). Airline buffers based on Euclidean distance were used instead of network buffers based on empirical evidence from the same geo-graphic region [52] and the high permeability of urban environments to pedestrians [53]. One kilometer buffers were selected because of the relatively small territory typi-cally covered on foot [8,29] and the lack of correlation between perceived and objective measures of the built environment beyond one kilometer [20,42].
Addresses were also allocated to census block groups, cen-sus tracts and ZIP codes using a point-in-polygon joining process [54]. Census block groups in the US contain approximately 1,000 residents, census tracts 4,000 resi-dents, and ZIP codes 30,000 residents [55].
Built environment data
For each of the five study counties digital maps of street networks, parks, and tax parcels (defined as buildings or units of land that are taxed or exempt from taxation) were obtained through the Washington State Geospatial Data Archive [56], county agencies, or cities (sidewalks, for King County only). Built environment data sources used were produced between 1998 (the midpoint of the study period) and 2005; although data from 1998 were sought in all cases, more recent data were used for several built environment characteristics because older data had not been archived, were of poor quality, or did not exist for a given county.
Residential density was calculated as housing units per square kilometer, with a housing unit defined as a house, apartment, mobile home, or other dwelling intended for occupancy as separate living quarters [57]. Residential density of each one-kilometer buffer was estimated using an area-weighted average of densities from census block groups intersecting or contained in the buffer. For exam-ple, a subject might have 30 percent of their one-kilom-eter buffer in census block group A, and 70 percent in census block group B. The estimated density for the one-kilometer buffer would then be 0.3 * (density of A) + 0.7 * (density of B). As a measure of connectivity, block size was calculated using local street maps. For sidewalk avail-ability, the total length of sidewalk-lined streets within each one-kilometer buffer was calculated. Sidewalk data were only available for King County.
We estimated proximity to several potential walking des-tinations (grocery stores, schools, restaurants and bars, banks, grocery-restaurant-retail complexes, office com-plexes, school-church combinations, fitness facilities, and parks), calculating the distance to the closest destination of each type and the number of destination of each type within one kilometer. For the destination combinations (grocery-restaurant-retail complexes, office complexes, and church-school combinations), the area of the nearest one was also calculated. Park access was measured as the proportion of the one-kilometer buffer covered by parks. With the exception of parks, which were identified using digital maps of parks in each county, destinations were identified using tax parcel land use codes. The categoriza-tion of the land use codes differed by county, but consist-ent rules were applied to categorize land uses across counties.
Statistical analysis
Built environment characteristics were tested as predictors of walking for exercise. All participants were included in analyses of logistic models predicting some walking ver-sus no walking, and those who walked were included in linear models to predict amount of walking (average min-utes per week). Time spent walking for exercise was log-transformed to moderate the effects of skewness and het-eroscedasticity.
We tested single built environment characteristics and models using multiple built environment characteristics to predict walking. Some built environment characteris-tics may be associated with walking in our sample by chance alone, raising concerns about multiple compari-sons. If we fit a model to our data, and then tested the model using the same data, our estimates of model fit would be artificially high because any chance associations unique to our data would be incorporated into our model. This would overestimate our ability to predict walking in a different sample of individuals from the same population. A holdout approach was used to avoid this bias [44,45]. Models developed in a training set were tested in a validation set, with estimates of model fit based on the validation set considered to be more accurate.
Built environment characteristics were modeled within categories or log-transformed in order to reduce the influ-ence of outliers. Proximity to destinations of each type was categorized as within 500 m, 500 m to 1000 m, or more than 1000 m away. Density, connectivity, sidewalk availability, and park access were log transformed. Regres-sion models were used to calculate the predicted probabil-ity of walking for exercise or predicted minutes per week of walking for exercise. These predicted variables were proportional to the linear predictors from the correspond-ing models: a constant (alpha) added to the product of each built environment characteristic (x) and the corre-sponding slope parameter (beta coefficient): predicted minutes/week of walking = α + Σxiβi. Slope parameters were estimated from training set data.
In addition, models were created using the Walkable and Bikeable Community (WBC) study model components: residential density; household and average block size; sidewalk availability; number of schools, restaurants or bars, grocery stores, and grocery-restaurant-retail com-plexes; distance to the closest restaurant or bar; distance to the closest grocery store; and area of the closest office complex [27,42]. We evaluated regression models with slope parameters for these 11 characteristics based our study's training set or on the WBC study data [27,42] (reanalyzed with exclusions, adjustments, and regression techniques parallel to those used for the present study).
For logistic regression models, model fit was evaluated using Hosmer-Lemeshow tests [45] and C-statistics (based on the area under the receiver operating characteristic curve). Under the null hypothesis, the logistic model pre-dicts walking no better than expected by chance, and one would expect a C-statistic of 0.5; a model with perfect pre-diction would lead to a C-statistic of 1.0. Predictive utility of linear models was assessed through the percent of vari-ation explained: r-squared * 100 percent.
Unadjusted models were compared with models adjusted for age, sex, self-reported health status, income, and edu-cation. For adjusted models, missing values for income (10 percent) and education (less than one percent) were estimated through multiple imputation [58]. Because unadjusted and adjusted models were similar, we have presented the unadjusted models in our tables. All regres-sion models were run using robust variance estimates in Stata 8.2 (StataCorp, College Station/TX, 2003), and vari-ance estimates accounted for clustering within county of residence.
Intra-class correlation coefficients (ICCs) were used to evaluate how characteristics varied between versus within ZIP codes, census tracts, and census block groups [59]. These ICCs can be interpreted as the maximum
propor-tion of variapropor-tion explained at the given group-level. If a characteristic was constant within each group, the only variation would be between groups and the ICC would be 1.0. In contrast, if the characteristic was randomly distrib-uted with respect to group, the ICC would be close to zero. These estimates were based on one-way analysis of vari-ance (ANOVA) models. Continuous variables were log-transformed to more closely meet the normality assump-tion of the ANOVA model. The ANOVA ICC estimator was also used for dichotomous variables, for which the ICC estimation remains asymptotically valid and unbi-ased [60].
Results
For 1,608 participants meeting the inclusion criteria, the mean age was 64 years, 61 percent were female, 90 percent were white, 37 percent had a college degree, and 46 per-cent were retired. The annual household income was above $50,000 for 51 percent of non-retired participants and 21 percent of retired participants.
Sixty-two percent of participants reported that they walked for exercise (Table 1). Older participants and women were more likely to report walking for exercise. Even after excluding participants in fair or poor health, general self-reported health status was associated with walking. Among those who reported walking for exercise, the median walking time was 2.3 hours per week (inter-quartile range: 1.4 to 3.6 hours per week) and the mean walking time was 2.9 hours per week (standard deviation: 2.5 hours per week).
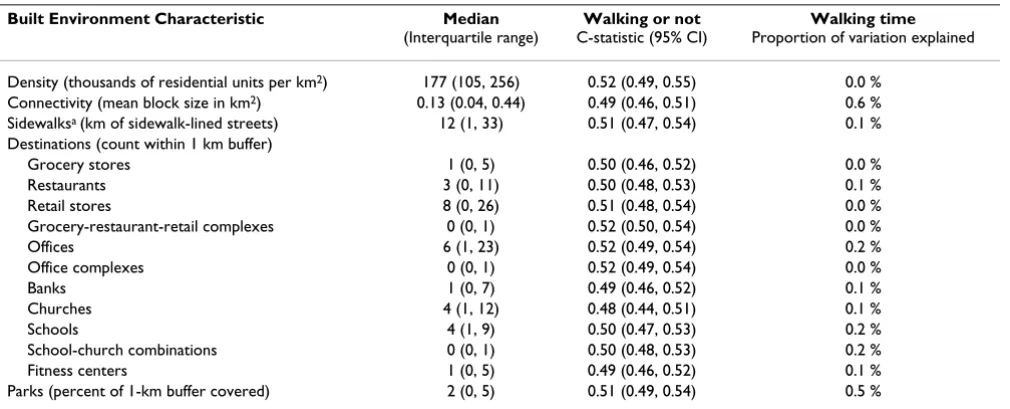
We evaluated single built environment characteristics, including residential density, street connectivity, sidewalk availability, proximity to destinations, and park access, as predictors of walking for exercise. Density of housing units had a C-statistic of 0.52 (95 percent confidence interval: 0.49, 0.55) for predicting walking versus no walking and explained less than 0.1 percent of the varia-tion in walking time (Table 2). Connectivity, measured by block size, had a C-statistic of 0.49 (95 percent confidence interval: 0.46, 0.51) and explained 0.6 percent of walking time. Sidewalk availability, measured only in King County, had a C-statistic of 0.51 (95 percent confidence interval: 0.47, 0.54) and explained 0.1 percent of the var-iation in walking time. Similarly modest results were found for other single measures, such as proximity of the various destinations (Table 2). A more general measure of proximity to potential destinations (proportion of the one-kilometer buffer occupied by commercial buildings) was also considered, but was not significantly associated with walking for exercise.
Table 1: Characteristics of participants who did and did not walk for exercise
Did not walk for exercise Walked for exercise
N = 608 N = 1,000
Age, %
30 to 45 3 2
45 to 55 21 18
55 to 65 28 27
65 to 75 33 35
75 to 79 15 17
Female sex, % 56 64
White race, % 89 91
Self-reported health status, %
Excellent 17 19
Very good 34 39
Good 49 41
Treated hypertension, % 72 67
Treated diabetes, % 9 8
Obese (body mass index > 30), % 42 35
Current smoking, % 14 7
Retired, % 41 49
Income, %
< $25,000/yr 22 22
$25,000 to $50,000/yr 40 40
> $50,000/yr 38 38
Education, %
High school or less 31 28
Some college/college graduate 51 54
Graduate/professional 18 18
County of residence, %
King 57 59
Kitsap 7 6
Pierce 11 9
Snohomish 15 15
Thurston 9 12
Table 2: Built environment characteristics used one at a time to predict walking for exercise
Built Environment Characteristic Median
(Interquartile range)
Walking or not C-statistic (95% CI)
Walking time Proportion of variation explained
Density (thousands of residential units per km2) 177 (105, 256) 0.52 (0.49, 0.55) 0.0 %
Connectivity (mean block size in km2) 0.13 (0.04, 0.44) 0.49 (0.46, 0.51) 0.6 %
Sidewalksa (km of sidewalk-lined streets) 12 (1, 33) 0.51 (0.47, 0.54) 0.1 %
Destinations (count within 1 km buffer)
Grocery stores 1 (0, 5) 0.50 (0.46, 0.52) 0.0 %
Restaurants 3 (0, 11) 0.50 (0.48, 0.53) 0.1 %
Retail stores 8 (0, 26) 0.51 (0.48, 0.54) 0.0 %
Grocery-restaurant-retail complexes 0 (0, 1) 0.52 (0.50, 0.54) 0.0 %
Offices 6 (1, 23) 0.52 (0.49, 0.54) 0.2 %
Office complexes 0 (0, 1) 0.52 (0.49, 0.54) 0.0 %
Banks 1 (0, 7) 0.49 (0.46, 0.52) 0.1 %
Churches 4 (1, 12) 0.48 (0.44, 0.51) 0.1 %
Schools 4 (1, 9) 0.50 (0.47, 0.53) 0.2 %
School-church combinations 0 (0, 1) 0.50 (0.48, 0.53) 0.2 %
Fitness centers 1 (0, 5) 0.49 (0.46, 0.52) 0.1 %
Parks (percent of 1-km buffer covered) 2 (0, 5) 0.51 (0.49, 0.54) 0.5 %
Notes: Built environment characteristics were measured within a one-kilometer airline buffer; a Sidewalk data were available only for King County,
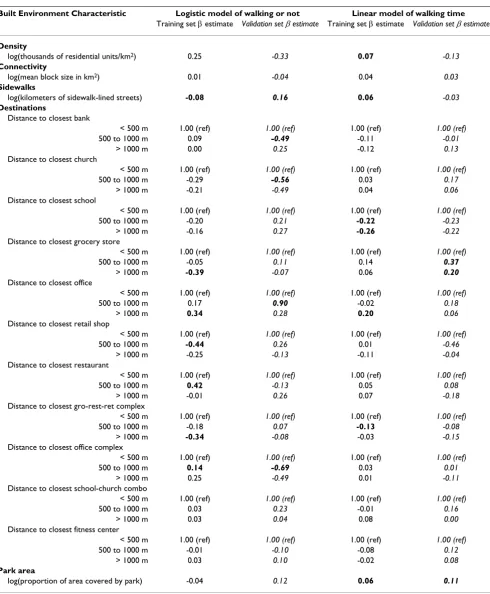
Table 3: Models using multiple built environment characteristics to predict walking for exercise
Built Environment Characteristic Logistic model of walking or not Linear model of walking time Training set β estimate Validation set β estimate Training set β estimate Validation set β estimate
Density
log(thousands of residential units/km2) 0.25 -0.33 0.07 -0.13
Connectivity
log(mean block size in km2) 0.01 -0.04 0.04 0.03
Sidewalks
log(kilometers of sidewalk-lined streets) -0.08 0.16 0.06 -0.03 Destinations
Distance to closest bank
< 500 m 1.00 (ref) 1.00 (ref) 1.00 (ref) 1.00 (ref)
500 to 1000 m 0.09 -0.49 -0.11 -0.01
> 1000 m 0.00 0.25 -0.12 0.13
Distance to closest church
< 500 m 1.00 (ref) 1.00 (ref) 1.00 (ref) 1.00 (ref)
500 to 1000 m -0.29 -0.56 0.03 0.17
> 1000 m -0.21 -0.49 0.04 0.06
Distance to closest school
< 500 m 1.00 (ref) 1.00 (ref) 1.00 (ref) 1.00 (ref)
500 to 1000 m -0.20 0.21 -0.22 -0.23
> 1000 m -0.16 0.27 -0.26 -0.22
Distance to closest grocery store
< 500 m 1.00 (ref) 1.00 (ref) 1.00 (ref) 1.00 (ref)
500 to 1000 m -0.05 0.11 0.14 0.37
> 1000 m -0.39 -0.07 0.06 0.20
Distance to closest office
< 500 m 1.00 (ref) 1.00 (ref) 1.00 (ref) 1.00 (ref)
500 to 1000 m 0.17 0.90 -0.02 0.18
> 1000 m 0.34 0.28 0.20 0.06
Distance to closest retail shop
< 500 m 1.00 (ref) 1.00 (ref) 1.00 (ref) 1.00 (ref)
500 to 1000 m -0.44 0.26 0.01 -0.46
> 1000 m -0.25 -0.13 -0.11 -0.04
Distance to closest restaurant
< 500 m 1.00 (ref) 1.00 (ref) 1.00 (ref) 1.00 (ref)
500 to 1000 m 0.42 -0.13 0.05 0.08
> 1000 m -0.01 0.26 0.07 -0.18
Distance to closest gro-rest-ret complex
< 500 m 1.00 (ref) 1.00 (ref) 1.00 (ref) 1.00 (ref)
500 to 1000 m -0.18 0.07 -0.13 -0.08
> 1000 m -0.34 -0.08 -0.03 -0.15
Distance to closest office complex
< 500 m 1.00 (ref) 1.00 (ref) 1.00 (ref) 1.00 (ref)
500 to 1000 m 0.14 -0.69 0.03 0.01
> 1000 m 0.25 -0.49 0.01 -0.11
Distance to closest school-church combo
< 500 m 1.00 (ref) 1.00 (ref) 1.00 (ref) 1.00 (ref)
500 to 1000 m 0.03 0.23 -0.01 0.16
> 1000 m 0.03 0.04 0.08 0.00
Distance to closest fitness center
< 500 m 1.00 (ref) 1.00 (ref) 1.00 (ref) 1.00 (ref)
500 to 1000 m -0.01 -0.10 -0.08 0.12
> 1000 m 0.03 0.10 -0.02 0.08
Park area
log(proportion of area covered by park) -0.04 0.12 0.06 0.11
exercise, to be validated using a holdout approach. Param-eter estimates from logistic and linear models fitted to the training set are shown in Table 3 (un-italicized estimates). Several built environment characteristics were signifi-cantly associated with walking for exercise in the training set (indicated by bold text). The training set models using this bloc of predictors were evaluated using a holdout approach, with the corresponding measures of model fit shown at the top of Table 4.
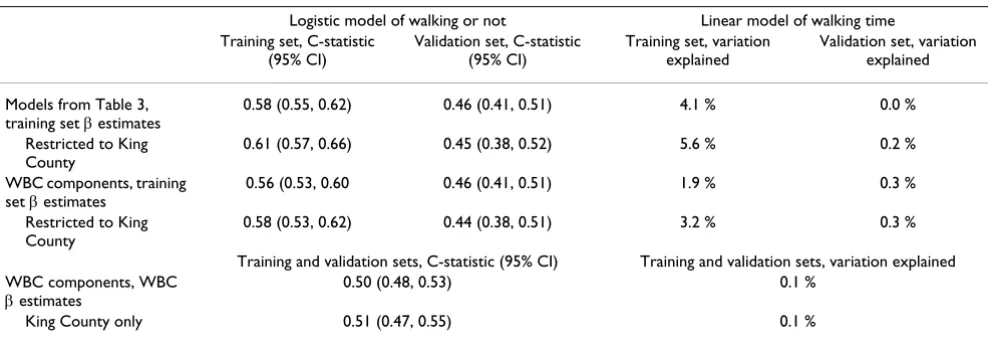
In the training set, the logistic regression model shown in Table 3 had an overall C-statistic of 0.61 (95 percent con-fidence interval: 0.58, 0.65) for predicting some walking for exercise versus none (Table 4, top). A Hosmer-Leme-show test Hosmer-Leme-showed that the expected and observed num-bers of walkers were similar across deciles of predicted probability of walking, so that the logistic regression model was not significantly rejected for the training set on the basis of this goodness-of-fit test. In the training set, the linear regression model predicted about four percent of the variation in walking time (Table 4, top).
In accordance with the planned holdout approach, mod-els with parameter estimates based on the training set were evaluated in the validation set to more accurately estimate how well they would predict walking in a new sample of individuals from the same population. When the logistic model with parameters based on the training set was used to predict walking in the validation set, the C-statistic estimate had a confidence interval that included the null value of 0.5 and the percent of variation explained by the linear model was less than one percent (Table 4, top). In the validation set, the Hosmer-Leme-show test indicated that the model did not fit the data well: across deciles of predicted walking probability, the expected and observed numbers of walkers were
signifi-cantly different (p < 0.001). The pattern observed in the validation set data significantly deviated from what was expected based on the model fitted to the training set data.
In a post hoc analysis, we created logistic and linear mod-els with parameters based on the validation set (Table 3, italicized estimates). While some parameters were similar for the training and validation sets, others were significant in each model but of opposite sign. For example, sidewalk availability was associated with a lower probability of walking in the training set but a higher probability of walking in the validation set.
Logistic and linear models using the same bloc of built environment characteristics were also estimated for the King County residents only or with adjustment for poten-tial confounders. When restricted to King County resi-dents, estimates of model fit in the training set were even higher (Table 4).
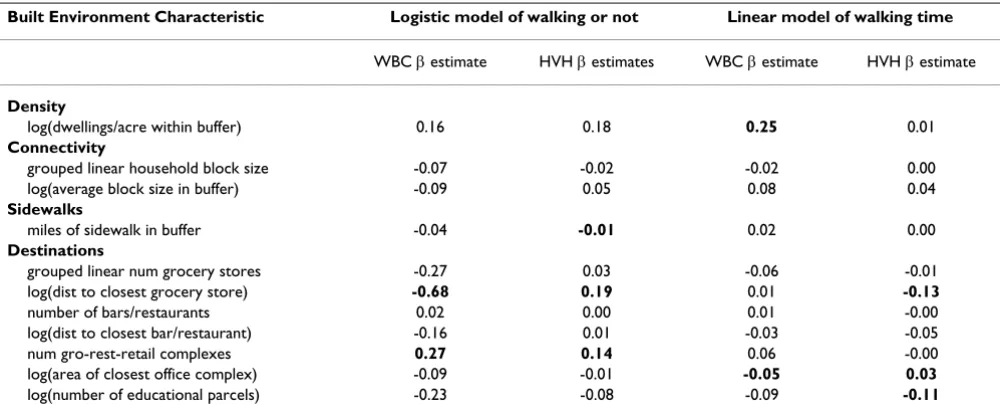
The models tested using the holdout approach may have failed in the validation set because they incorporated so many variables; the number of variables increases the probability that the model will overfit the training set data, explaining random noise unique to the data. In order to address this concern, we repeated the process of model fitting and model evaluation with a smaller number of variables, selected based on their inclusion in the models from the WBC study [27,42]. When consider-ing the 11 components of the WBC study models (Table 5), the direction of association was not consistent for these built environment characteristics between the mod-els in the HVH study population and those from the WBC study. Neither models with training set parameter esti-mates nor those with WBC parameter estiesti-mates
signifi-Table 4: Holdout validation and replication of models using the built environment to predict walking for exercise
Logistic model of walking or not Linear model of walking time Training set, C-statistic
(95% CI)
Validation set, C-statistic (95% CI)
Training set, variation explained
Validation set, variation explained
Models from Table 3, training set β estimates
0.58 (0.55, 0.62) 0.46 (0.41, 0.51) 4.1 % 0.0 %
Restricted to King County
0.61 (0.57, 0.66) 0.45 (0.38, 0.52) 5.6 % 0.2 %
WBC components, training set β estimates
0.56 (0.53, 0.60 0.46 (0.41, 0.51) 1.9 % 0.3 %
Restricted to King County
0.58 (0.53, 0.62) 0.44 (0.38, 0.51) 3.2 % 0.3 %
Training and validation sets, C-statistic (95% CI) Training and validation sets, variation explained WBC components, WBC
β estimates
0.50 (0.48, 0.53) 0.1 %
King County only 0.51 (0.47, 0.55) 0.1 %
cantly predicted the corresponding walking outcome outside of the sample in which it was fitted (Table 4).
Selecting variable transformations that maximized the model fit in the training set, adjusting for potential con-founders (sex, age, health status, education and income), or restricting to non-rural areas did not improve model fit in the validation set. Models using the same built environ-ment characteristics also failed to reliably predict total physical activity time per week [61], a measure described elsewhere [46,50].
To better understand these results, the geographic varia-tion in walking for exercise and three continuous meas-ures of the built environment (density, connectivity, and park area) were explored using ICCs (Table 6). Small
cor-relations were observed within census areas for amount of walking for exercise but these were not significant. Since the ICC confidence intervals for both walking measures included 0.000, the data were compatible with no neigh-borhood-level pattern in walking for exercise. Residential density, connectivity, and park area were highly correlated within census tracts and census block groups, as expected.
Discussion
In this study, built environment characteristics were meas-ured within one kilometer of participants' residential addresses, but these built environment characteristics were not consistent predictors of walking for exercise. Models using these built environment characteristics to predict walking for exercise could not be validated using a holdout approach. This was true for the outcomes of
walk-Table 5: Built environment characteristics associated with walking (WBC study) or walking for exercise (HVH study)
Built Environment Characteristic Logistic model of walking or not Linear model of walking time
WBC β estimate HVH β estimates WBC β estimate HVH β estimate
Density
log(dwellings/acre within buffer) 0.16 0.18 0.25 0.01
Connectivity
grouped linear household block size -0.07 -0.02 -0.02 0.00
log(average block size in buffer) -0.09 0.05 0.08 0.04
Sidewalks
miles of sidewalk in buffer -0.04 -0.01 0.02 0.00
Destinations
grouped linear num grocery stores -0.27 0.03 -0.06 -0.01 log(dist to closest grocery store) -0.68 0.19 0.01 -0.13
number of bars/restaurants 0.02 0.00 0.01 -0.00
log(dist to closest bar/restaurant) -0.16 0.01 -0.03 -0.05
num gro-rest-retail complexes 0.27 0.14 0.06 -0.00
log(area of closest office complex) -0.09 -0.01 -0.05 0.03 log(number of educational parcels) -0.23 -0.08 -0.09 -0.11
Notes: WBC indicates Walkable and Bikeable Communities Study; HVH indicates Heart and Vascular Health Study
Table 6: Geographic variation in physical activity and the built environment
ZIP code Census tract Census block group
ICC (95% CI) ICC (95% CI) ICC (95% CI)
Walking for exercise
Some versus none 0.003 (0.000, 0.025) 0.000 (0.000, 0.051) 0.000 (0.000, 0.102) Minutes per weekab 0.000 (0.000, 0.036) 0.046 (0.000, 0.129) 0.055 (0.000, 0.211)
Built environment characteristics
Residential density of 1-km buffera 0.739 (0.680, 0.799) 0.920 (0.907, 0.932) 0.953 (0.946, 0.960)
Connectivity of 1-km buffera 0.784 (0.731, 0.836) 0.879 (0.861, 0.897) 0.931 (0.920, 0.941)
Park area within 1-km buffera 0.330 (0.255, 0.405) 0.601 (0.554, 0.648) 0.778 (0.746, 0.809)
Notes: ICC indicates intra-class correlation coefficient; CI indicates confidence interval; except where otherwise indicated N = 1,608
a Log-transformed to approximate normality
ing for exercise versus not walking for exercise or amount of walking for exercise among those who walked; for models with parameters estimated from a random sample of the study data or parameters estimated from a different study population in the same geographic region; for anal-yses restricted to the most populous county or to non-rural areas; and for models with and without adjustment for potential confounders. Participants living in the same census block group, census tract, or ZIP code were no more similar with respect to walking for exercise than would be expected by chance. This lack of significant neighborhood-level variation in physical activity variables was found despite the presence of neighborhood-level variation in residential density, connectivity, and park area.
This study suggests that the amount of walking for exercise explained by the objectively measured built environment characteristics near one's home may be quite small, possi-bly accounting for one percent of the total variation. The importance of immediate physical surroundings may be limited because of the many social and psychological influences shaping physical activity behavior [39,62,63]. The larger estimates of model fit from the training set did not reflect how well the models would predict walking for exercise in an independent sample of the same popula-tion.
The physical activity data used in this study were collected for their relevance to cardiovascular disease [46,50]. Walk-ing for transportation or walkWalk-ing within one's neighbor-hood may be more sensitive to the local built environment, but should continue to be evaluated with respect to health outcomes [64,65]; walking pace and validity of self-report may be lower for transportation walking compared with walking for exercise [66] so that the association between transportation walking and improved health outcomes should be tested and not assumed. The present findings do not directly address the hypothesis that built environment characteristics influ-ence walking for transportation, which has been sepa-rately evaluated in the same geographic region [67] and elsewhere [7,14,25,68-70].
Previous studies that measured walking for different pur-poses found different neighborhood determinants of walking for transportation versus recreational purposes [2,9,22,27,28,35,71,72], and the neighborhood built environment has been more strongly associated with walking for transportation as compared with walking for exercise or recreation. While expert consensus [39] and some previous studies [20,34,37,38,71-73] support an association between the neighborhood built environment and walking for recreation or exercise, findings from the present study agree with studies in other regions and
pop-ulations that have reported no association between the built environment and walking for exercise or recreation [16,21,22,28].
More than half of our study population was age 65 or older. Older adults may be particularly sensitive to their built environment [74,75] and several studies that have focused on the importance of the built environment for supporting the physical activity and independence of older adults. Urban design, the availability of services, rec-reational facilities, and safety from crime have been asso-ciated with more walking in previous studies of older adults [13,34,76,77]. One study of older women found stronger associations between the built environment and pedometer measures, compared with self-reported physi-cal activity, suggesting transport walking may be impor-tant [77]. However, older adults may be less likely to walk for transportation [27]. Future research on the importance of walkability for older adults may find pedometer meas-ures to be more sensitive to the built environment. There is also some evidence that walkability may affect the phys-ical activity and health of older adults through increased social capital [78] or social cohesion [79], and under-standing the multiple pathways through which the built environment affects health will be important for guiding policy decisions [67].
Limitations
Data on walking for exercise were derived from telephone interview data, a method subject to recall error [64,80] and social desirability bias [81]. Compared with more vig-orous physical activities, walking may be underestimated due to low salience [4,80,82]. Also, the external validity of the present study is limited by the setting and by restric-tions chosen to enhance internal validity: all participants had health insurance, participated in a telephone inter-view, reported good health, had no history of cardiovas-cular disease, and lived in the Puget Sound Region of Washington State. While these restrictions served to reduce confounding by socioeconomic status or prior health status, they may also have reduced variability. This observational study cannot exclude the possibility that uncontrolled confounding is masking the true relation-ship between the built environment and walking for exer-cise.
in this study. However, the lack of geographic variation in the outcome, walking for exercise, would limit this study's statistical power to investigate other built environment characteristics. Finally, built environment characteristics were assessed for one-kilometer circular buffers which may not precisely reflect the environment experienced by study participants [23,24].
Conclusion
Built environment characteristics near home did not con-sistently predict walking for exercise in this healthy popu-lation in western Washington State. Further, there was little evidence of neighborhood-level variation in walking for exercise, despite neighborhood-level variation in the built environment. The built environment may support walking for other specific purposes, such as transporta-tion. The poor prediction of walking for exercise in our study may be due to a weak association between the built environment and walking for exercise, or may reflect the need to incorporate a wider range of built environments by conducting national or international studies [10]. Future research is needed to estimate and confirm the effects of the built environment on different types and measures of walking, physical activity, and health out-comes. Replication across study populations is needed to support accurate predictions, cost-effectiveness analyses, intervention studies, and recommendations for health promotion.
Abbreviations
Abbreviations used in the text or tables: Heart and Vascu-lar Health (HVH) study, Walkable and Bikeable Commu-nity (WBC) study, intra-class correlation coefficient (ICC), analysis of variance (ANOVA), and confidence interval (CI).
Competing interests
The author(s) declare that they have no competing inter-ests.
Authors' contributions
All authors contributed to the study design, analytic approach, and presentation of results. The geographic information systems tools and data layers for this project were developed by GSL, AVM, ALP, and PMH. GSL geoco-ded the study addresses and created neighborhood meas-ures, conducted the analyses, and prepared the manuscript. All authors critically reviewed manuscript drafts and approved the final manuscript.
Acknowledgements
This research was supported by a University of Washington Royalty Research fund award; by contracts R01-HL043201, R01-HL068639, and T32-HL07902 from the National Heart, Lung, and Blood Institute; and by grant R01-AG09556 from the National Institute on Aging. The authors
thank the Robert Wood Johnson Foundation Health & Society Scholars program for its financial support.
References
1. Handy SL, Boarnet MG, Ewing R, Killingsworth RE: How the built environment affects physical activity: views from urban plan-ning. American journal of preventive medicine 2002, 23(2 Suppl):64-73.
2. Moudon AV, Lee C: Walking and bicycling: an evaluation of environmental audit instruments. Am J Health Promot 2003,
18(1):21-37.
3. Eyre H, Kahn R, Robertson RM, Clark NG, Doyle C, Hong Y, Gansler T, Glynn T, Smith RA, Taubert K, Thun MJ: Preventing cancer, car-diovascular disease, and diabetes: a common agenda for the American Cancer Society, the American Diabetes Associa-tion, and the American Heart Association. Circulation 2004,
109(25):3244-55. Epub 2004 Jun 15..
4. Frank LD, Engelke PO: The built environment and human activ-ity patterns: exploring the impacts of urban form on public health. Journal of Planning Literature 2001, 16(2):202-218.
5. Humpel N, Owen N, Leslie E: Environmental factors associated with adults' participation in physical activity: a review. Amer-ican journal of preventive medicine 2002, 22(3):188-199.
6. Trost SG, Owen N, Bauman AE, Sallis JF, Brown W: Correlates of adults' participation in physical activity: review and update.
Medicine and science in sports and exercise 2002, 34(12):1996-2001. 7. Saelens BE, Sallis JF, Frank LD: Environmental correlates of
walk-ing and cyclwalk-ing: findwalk-ings from the transportation, urban design, and planning literatures. Ann Behav Med 2003,
25(2):80-91.
8. Lee C, Moudon AV: Physical activity and environment research in the health field: implications for urban and transportation planning practice and research. Journal of Planning Literature
2004, 19(2):147-181.
9. Owen N, Humpel N, Leslie E, Bauman A, Sallis JF: Understanding environmental influences on walking; Review and research agenda. American journal of preventive medicine 2004, 27(1):67-76. 10. TRB: TRB Special Report 282: Does the built environment
influence physical activity? Examining the evidence. Washing-ton, DC , The National Academies, Transportation Research Board; 2005.
11. Ewing R: Can the physical environment determine physical activity levels? Exerc Sport Sci Rev 2005, 33(2):69-75.
12. Frank LD, Engelke PO, Schmid TL: Health and Community Design. Washington, DC , Island Press; 2003:22-26.
13. Li F, Fisher KJ, Brownson RC, Bosworth M: Multilevel modelling of built environment characteristics related to neighbour-hood walking activity in older adults. Journal of epidemiology and community health 2005, 59(7):558-564.
14. Frank LD, Andresen MA, Schmid TL: Obesity relationships with community design, physical activity, and time spent in cars.
American journal of preventive medicine 2004, 27(2):87-96.
15. Ewing R, Schmid T, Killingsworth R, Zlot A, Raudenbush S: Relation-ship between urban sprawl and physical activity, obesity, and morbidity. Am J Health Promot 2003, 18(1):47-57.
16. Rutt CD, Coleman KJ: The impact of the built environment on walking as a leisure-time activity along the U.S./Mexico bor-der. Journal of Physical Activity and Health 2005, 2(3):257-271. 17. Cervero R, Duncan M: Walking, bicycling, and urban
land-scapes: evidence from the San Francisco Bay Area. American journal of public health 2003, 93(9):1478-1483.
18. De Bourdeaudhuij I, Sallis JF, Saelens BE: Environmental corre-lates of physical activity in a sample of Belgian adults. Am J Health Promot 2003, 18(1):83-92.
19. Humpel N, Owen N, Leslie E, Marshall AL, Bauman AE, Sallis JF:
Associations of location and perceived environmental attributes with walking in neighborhoods. Am J Health Promot
2004, 18(3):239-242.
20. Duncan M, Mummery K: Psychosocial and environmental fac-tors associated with physical activity among city dwellers in regional Queensland. Preventive medicine 2005, 40(4):363-372. 21. Rutt CD, Coleman KJ: Examining the relationships among built
22. Hoehner CM, Brennan Ramirez LK, Elliott MB, Handy SL, Brownson RC: Perceived and objective environmental measures and physical activity among urban adults. American journal of preven-tive medicine 2005, 28(2 Suppl 2):105-116.
23. Coulton CJ, Korbin J, Chan T, Su M: Mapping residents' percep-tions of neighborhood boundaries: a methodological note.
Am J Community Psychol 2001, 29(2):371-383.
24. Oliver LN, Schuurman N, Hall AW: Comparing circular and net-work buffers to examine the influence of land use on walking for leisure and errands. International journal of health geographics [electronic resource] 2007, 6:41.
25. Cervero R, Kockelman K: Travel demand and the 3Ds: density, diversity, and design. Transpn Res-D 1997, 2(3):199-219. 26. Ewing RC R.: Travel and the Built Enviornment: A Synthesis.
Transportation Research Record 1780 2001, 1780:87-114.
27. Lee C, Moudon AV: Correlates of walking for transportation or recreation purposes. Journal of Physical Activity and Health 2006,
3(Suppl 1):S77-S98.
28. Troped PJ, Saunders RP, Pate RR, Reininger B, Addy CL: Correlates of recreational and transportation physical activity among adults in a New England community. Preventive medicine 2003,
37(4):304-310.
29. Hoehner CM, Brennan LK, Brownson RC, Handy SL, Killingsworth R:
Opportunities for integrating public health and urban plan-ning approaches to promote active community environ-ments. Am J Health Promot 2003, 18(1):14-20.
30. Manson JE, Greenland P, LaCroix AZ, Stefanick ML, Mouton CP, Oberman A, Perri MG, Sheps DS, Pettinger MB, Siscovick DS: Walk-ing compared with vigorous exercise for the prevention of cardiovascular events in women. The New England journal of med-icine 2002, 347(10):716-725.
31. Tanasescu M, Leitzmann MF, Rimm EB, Willett WC, Stampfer MJ, Hu FB: Exercise type and intensity in relation to coronary heart disease in men. JAMA 2002, 288(16):1994-2000.
32. Wannamethee SG, Shaper AG: Physical activity in the preven-tion of cardiovascular disease: an epidemiological perspec-tive. Sports Med 2001, 31(2):101-114.
33. Oguma Y, Shinoda-Tagawa T: Physical activity decreases cardio-vascular disease risk in women: review and meta-analysis.
American journal of preventive medicine 2004, 26(5):407-418. 34. Berke EM, Koepsell TD, Moudon AV, Hoskins RE, Larson EB:
Asso-ciation of the built environment with physical activity and obesity in older persons. American journal of public health 2007,
97(3):486-492.
35. Suminski RR, Poston WS, Petosa RL, Stevens E, Katzenmoyer LM:
Features of the neighborhood environment and walking by U.S. adults. American journal of preventive medicine 2005,
28(2):149-155.
36. Atkinson JL, Sallis JF, Saelens BE, Cain KL, Black JB: The association of neighborhood design and recreational environments with physical activity. Am J Health Promot 2005, 19(4):304-309. 37. Sharpe PA, Granner ML, Hutto B, Ainsworth BE: Association of
environmental factors to meeting physical activity recom-mendations in two South Carolina counties. Am J Health Pro-mot 2004, 18(3):251-257.
38. Addy CL, Wilson DK, Kirtland KA, Ainsworth BE, Sharpe P, Kimsey D: Associations of perceived social and physical environmen-tal supports with physical activity and walking behavior.
American journal of public health 2004, 94(3):440-443.
39. Pikora T, Giles-Corti B, Bull F, Jamrozik K, Donovan R: Developing a framework for assessment of the environmental determi-nants of walking and cycling. Social science & medicine (1982)
2003, 56(8):1693-1703.
40. Gauvin L, Riva M, Barnett T, Richard L, Craig CL, Spivock M, Laforest S, Laberge S, Fournel MC, Gagnon H, Gagne S: Association between Neighborhood Active Living Potential and Walk-ing. American journal of epidemiology 2008.
41. Frank LD, Schmid TL, Sallis JF, Chapman J, Saelens BE: Linking objec-tively measured physical activity with objecobjec-tively measured urban form: findings from SMARTRAQ. American journal of pre-ventive medicine 2005, 28(2 Suppl 2):117-125.
42. Moudon AV, Lee C, Cheadle AD, Garvin C, Johnson D, Schmid TL, Weathers RD, Lin L: Operational definitions of walkable neigh-borhood: theoretical and empirical insights. Journal of Physical Activity and Health 2006, 3(Suppl 1):S99-S117.
43. Leslie E, Saelens B, Frank L, Owen N, Bauman A, Coffee N, Hugo G:
Residents' perceptions of walkability attributes in objectively different neighbourhoods: a pilot study. Health Place 2005,
11(3):227-236.
44. Harrell FE Jr., Lee KL, Mark DB: Multivariable prognostic mod-els: issues in developing models, evaluating assumptions and adequacy, and measuring and reducing errors. Statistics in med-icine 1996, 15(4):361-387.
45. Hosmer DW, Lemeshow S: Assessing the fit of the model. In
Applied Logistic Regression Second edition. New York , John Wiley & Sons, Inc; 2000:143-202.
46. Lemaitre RN, Heckbert SR, Psaty BM, Siscovick DS: Leisure-time physical activity and the risk of nonfatal myocardial infarc-tion in postmenopausal women. Arch Intern Med 1995,
155(21):2302-2308.
47. Cayo MR, Talbot TO: Positional error in automated geocoding of residential addresses. Int J Health Geogr 2003, 19(2):1-10. 48. Taylor HL, Jacobs DR Jr., Schucker B, Knudsen J, Leon AS, Debacker
G: A questionnaire for the assessment of leisure time physi-cal activities. J Chronic Dis 1978, 31(12):741-755.
49. Folsom AR, Jacobs DR Jr., Caspersen CJ, Gomez-Marin O, Knudsen J: Test-retest reliability of the Minnesota Leisure Time Phys-ical Activity Questionnaire. J Chronic Dis 1986, 39(7):505-511. 50. Lovasi GS, Lemaitre RN, Siscovick DS, Dublin S, Bis JC, Lumley T,
Heckbert SR, Smith NL, Psaty BM: Amount of leisure-time phys-ical activity and risk of nonfatal myocardial infarction. Ann Epidemiol 2007, 17(6):410-416.
51. Lovasi GS, Weiss JC, Hoskins R, Whitsel EA, Rice K, Erickson CF, Psaty BM: Comparing a single-stage geocoding method to a multi-stage geocoding method: how much and where do they disagree? Int J Health Geogr 2007, 6(12):.
52. Moudon AV, Lee C, Cheadle AD, Garvin C, Johnson DB, Schmid TL, Weathers RD: Attributes of environments supporting walk-ing. Am J Health Promot 2007, 21(5):448-459.
53. Hess PM, Moudon AV, Snyder MC, Stanilov K: Site design and pedestrian travel. Transportation Research Record 1999, 1674:9-19. 54. Lovasi GS, Moudon AV, Smith NL, Lumley T, Larson EB, Sohn DW, Siscovick DS, Psaty BM: Evaluating Options for Measurement of Neighborhood Socioeconomic Context: Evidence from a Myocardial Infarction Case-Control Study. Health & Place
2007.
55. Krieger N, Chen JT, Waterman PD, Soobader MJ, Subramanian SV, Carson R: Geocoding and monitoring of US socioeconomic inequalities in mortality and cancer incidence: does the choice of area-based measure and geographic level matter?: the Public Health Disparities Geocoding Project. American journal of epidemiology 2002, 156(5):471-482.
56. Washington U: Washington State Geospatial Data Archive: wagda.lib.washington.edu. 2005.
57. U.S. Census Bureau: Housing Unit Estimates. [http://www.cen sus.gov/popest/topics/terms/housing_unit.html].
58. Royston P: Multiple imputation of missing values. Stata Journal
2004, 4(3):227-241.
59. Merlo J, Chaix B, Yang M, Lynch J, Rastam L: A brief conceptual tutorial on multilevel analysis in social epidemiology: inter-preting neighbourhood differences and the effect of neigh-bourhood characteristics on individual health. J Epidemiol Community Health 2005, 59(12):1022-1028.
60. Ridout MS, Demetrio CG, Firth D: Estimating intraclass correla-tion for binary data. Biometrics 1999, 55(1):137-148.
61. Lovasi GS: Neighborhood Walkability, Physical Activity, and Cardiovascular Risk. In Epidemiology Volume PhD. Seattle , Univer-sity of Washington, School of Public Health and Community Medicine; 2006:64.
62. Bauman AE, Sallis JF, Dzewaltowski DA, Owen N: Toward a better understanding of the influences on physical activity: the role of determinants, correlates, causal variables, mediators, moderators, and confounders. American journal of preventive med-icine 2002, 23(2 Suppl):5-14.
63. Northridge ME, Sclar ED, Biswas P: Sorting out the connections between the built environment and health: a conceptual framework for navigating pathways and planning healthy cit-ies. Journal of Urban Health 2003, 80(4):556-568.
Publish with BioMed Central and every scientist can read your work free of charge "BioMed Central will be the most significant development for disseminating the results of biomedical researc h in our lifetime."
Sir Paul Nurse, Cancer Research UK
Your research papers will be:
available free of charge to the entire biomedical community
peer reviewed and published immediately upon acceptance
cited in PubMed and archived on PubMed Central
yours — you keep the copyright
Submit your manuscript here:
http://www.biomedcentral.com/info/publishing_adv.asp
BioMedcentral
65. Ogilvie D, Egan M, Hamilton V, Petticrew M: Promoting walking and cycling as an alternative to using cars: systematic review.
BMJ (Clinical research ed 2004, 329(7469):763.
66. Whitt MC, DuBose KD, Ainsworth BE, Tudor-Locke C: Walking patterns in a sample of African American, Native American, and Caucasian women: the cross-cultural activity participa-tion study. Health Educ Behav 2004, 31(4 Suppl):45S-56S. 67. Frank L, Sallis JF, Conway JM, Chapman JE, Saelens BE, Bachman W:
Many pathways from land use to health: Associations between neighborhood walkability and active transporta-tion, body mass index, and air quality. JAPA 2006, 72(1):75-87. 68. Pucher J, Dijkstra L: Promoting safe walking and cycling to improve public health: lessons from The Netherlands and Germany. American journal of public health 2003, 93(9):1509-1516. 69. Cerin E, Leslie E, Toit L, Owen N, Frank LD: Destinations that
matter: Associations with walking for transport. Health & Place 2007, 13(3):713-724.
70. Besser LM, Dannenberg AL: Walking to public transit: steps to help meet physical activity recommendations. American journal of preventive medicine 2005, 29(4):273-280.
71. Giles-Corti B, Donovan RJ: Socioeconomic status differences in recreational physical activity levels and real and perceived access to a supportive physical environment. Preventive medi-cine 2002, 35(6):601-611.
72. Humpel N, Owen N, Iverson D, Leslie E, Bauman A: Perceived environment attributes, residential location, and walking for particular purposes. American journal of preventive medicine 2004,
26(2):119-125.
73. Ball K, Bauman A, Leslie E, Owen N: Perceived environmental aesthetics and convenience and company are associated with walking for exercise among Australian adults. Preventive medicine 2001, 33(5):434-440.
74. Dannenberg AL, Jackson RJ, Frumkin H, Schieber RA, Pratt M, Kochtitzky C, Tilson HH: The impact of community design and land-use choices on public health: a scientific research agenda. American journal of public health 2003, 93(9):1500-1508. 75. Tranter RT, Slater R, Vaughan N: Barriers to mobility:
physically-disabled and frail elderly people in their local outdoor envi-ronment. Int J Rehabil Res 1991, 14(4):303-312.
76. Patterson PK, Chapman NJ: Urban form and older residents' service use, walking, driving, quality of life, and neighbor-hood satisfaction. Am J Health Promot 2004, 19(1):45-52. 77. King WC, Brach JS, Belle S, Killingsworth R, Fenton M, Kriska AM:
The relationship between convenience of destinations and walking levels in older women. Am J Health Promot 2003,
18(1):74-82.
78. Leyden KM: Social capital and the built environment: the importance of walkable neighborhoods. American journal of pub-lic health 2003, 93(9):1546-1551.
79. Fisher KJ, Li F, Michael Y, Cleveland M: Neighborhood-level influ-ences on physical activity among older adults: a multilevel analysis. J Aging Phys Act 2004, 12(1):45-63.
80. Bassett DR Jr., Cureton AL, Ainsworth BE: Measurement of daily walking distance-questionnaire versus pedometer. Med Sci Sports Exerc 2000, 32(5):1018-1023.
81. Armstrong BK, White E, Saracci R: Exposure measurement error and its effects. In Principles of Exposure Measurement in Epidemiology
New York , Oxford University Press Inc.; 2000:49-77.