PRIMARY RESEARCH
Establishment and evaluation of four
different types of patient-derived xenograft
models
Xiaoqian Ji
1,2†, Siyu Chen
2†, Yanwu Guo
3, Wende Li
2, Xiaolong Qi
4, Han Yang
5, Sa Xiao
2,6, Guang Fang
2,6,
Jinfang Hu
2, Chuangyu Wen
7, Huanliang Liu
7, Zhen Han
4, Guangxu Deng
4, Qingbin Yang
4, Xiangling Yang
7,
Yuting Xu
3, Zhihong Peng
2,6, Fengping Li
4, Nvlue Cai
2, Guoxin Li
4*and Ren Huang
2*Abstract
Background: Patient-derived xenografts (PDX) have a biologically stable in tumor architecture, drug responsive-ness, mutational status and global gene-expression patterns. Numerous PDX models have been established to date, however their thorough characterization regarding the tumor formation and rates of tumor growth in the established models remains a challenging task. Our study aimed to provide more detailed information for establishing the PDX models successfully and effectively.
Methods: We transplanted four different types of solid tumors from 108 Chinese patients, including 21 glioblastoma (GBM), 11 lung cancers (LC), 54 gastric cancers (GC) and 21 colorectal cancers (CRC), and took tumor tissues passaged for three successive generations. Here we report the rate of tumor formation, tumor-forming times, tumor growth curves and mortality of mice in PDX model. We also report H&E staining and immunohistochemistry for HLA-A, CD45, Ki67, GFAP, and CEA protein expression between patient cancer tissues and PDX models.
Results: Tumor formation rate increased significantly in subsequent tumor generations. Also, the survival rates of GC and CRC were remarkably higher than GBM and LC. As for the time required for the formation of tumors, which reflects the tumor growth rate, indicated that tumor growth rate always increased as the generation number increased. The tumor growth curves also illustrate this law. Similarly, the survival rate of PDX mice gradually improved with the increased generation number in GC and CRC. And generally, there was more proliferation (Ki67+) in the PDX models than in the patient tumors, which was in accordance with the results of tumor growth rate. The histological findings confirm similar histological architecture and degrees of differentiation between patient cancer tissues and PDX models with statistical analysis by GraphPad Prism 5.0.
Conclusion: We established four different types of PDX models successfully, and our results add to the current understanding of the establishment of PDX models and may contribute to the extension of application of different types of PDX models.
Keywords: Patient derived xenograft (PDX), Glioblastoma (GBM), Lung cancer (LC), Gastric cancer (GC), Colorectal cancer (CRC)
© The Author(s) 2017. This article is distributed under the terms of the Creative Commons Attribution 4.0 International License (http://creativecommons.org/licenses/by/4.0/), which permits unrestricted use, distribution, and reproduction in any medium, provided you give appropriate credit to the original author(s) and the source, provide a link to the Creative Commons license, and indicate if changes were made. The Creative Commons Public Domain Dedication waiver (http://creativecommons.org/ publicdomain/zero/1.0/) applies to the data made available in this article, unless otherwise stated.
Open Access
*Correspondence: gzliguoxin@163.com; 1649405216@qq.com
†Xiaoqian Ji and Siyu Chen contributed equally to this work 2 Guangdong Laboratory Animals Monitoring Institute, Guangdong
Key Laboratory Animal Lab, 11 Fengxin Road, Science City, Guangzhou 510663, China
4 Department of General Surgery, Nanfang Hospital, Southern Medical
Background
Although the advent of cancer cell-line culture techniques stimulated an acceleration and expansion of cancer biology discovery that continues to this day, the harsh reality is that there is a high failure rate among new oncology agents when attempting to translate preclinical efficacy into clinical ben-efit. The primary reasons cited for high failure rates include substantial genetic divergence between primary cancers and cell lines, and the inability of cell lines to mimic the het-erogeneity of tumors in patients [1–5]. Afterwards, in vivo models based on a limited number of cancer cells previ-ously isolated from tumors and selected prior to implanta-tion in animals have been used extensively in tumor biology research or evaluation of anticancer drugs [6, 7]. Unfortu-nately, these in vivo models also fail to reproduce the tumor microenvironment and cancer cell adaptation to the innate immune system, both of which are pivotal to the architec-ture of the primary tumors, proliferation and metastasis [3].
One of the critical issues relevant to the failure of the preclinical models is their failure to recapitulate the heter-ogeneity of tumors in patients. The heterheter-ogeneity includes intratumor heterogeneity and intertumor heterogeneity, differences in the sensitivities to drug treatment, and dif-ferent rates of resistance to the drugs, resulting in inad-equate treatment decisions [8]. Recently, patient-derived xenograft (PDX) models of human tumor tissues obtained directly from the patients and transplanted into immune-compromised mice have gained popularity in cancer research. These models better resemble the heterogene-ity of human tumors [2, 9–11]. Furthermore, PDX models have been shown to predict clinical responses to chemo-therapeutic drugs more accurately than other platforms, which centralize the role of PDX models in a new genera-tion of personalized cancer therapy [12, 13].
In February 2016, the national cancer institute (NCI) announced that at NCI-60 cell line repository, which has been used by researchers across the world for the past 25 years, would retire in late spring due to the emergence of PDX models [14]. An article in late 2015 in the inter-national academic journal Nature medicine reported that researchers at the Novartis institute of biomedical research had successfully established about 1000 cases of patient-derived xenograft animal models. The research-ers had also validated these models and proved that the clinical relevance of these models is as high as 90%. The results indicate potential applications of the PDX models in preclinical drug evaluation and prediction of precise clinical effects of drug compounds [15].
At present, the research category of PDX models is mainly focused on the following aspects: assessment of cellular, histology, epigenetic and molecular signatures of patient tumor tissue with PDX model, oncology drug development, and clinical research [2, 16–19]. However,
detailed PDX modeling methods have not been widely disseminated, and the factors that affect the rates of tumor formation and mortality are also not clear. Some of the urgent questions awaiting answers on PDX mod-els include: after transplantation, how long does it take for the tumor to grow up to 500 mm3, whether different
types of tumors have similar tumor formation rates, how does serial passaging effect the original tumor, how to ensure stable tumor formation rate, and so on.
Hence, in the present study, we established a set of PDXs by transplanting 21 GBM, 11 LC, 54 GC and 21 CRC patient tumor specimens into highly immune-compro-mised NOD.Cg-Prkdcscid Il2rgtm1Wjl/SzJ (NSG) mice, and demonstrated that these PDXs reflected the histological and biochemical characteristics of the original cancer. We also present a summary of the important factors that influ-ence the tumor formation rate and the mortality in PDX mice. We hope to perfect and refine the methodology of establishing PDX mice model, which can be eventually used as a reference for future applications of the PDX model.
Materials and methods Materials and reagents
Hanks fluid (Leagene,CC0033), glycerin (Sigma,G9012), SP Rabbit HRP Kit (DAB) was brought from Cwbiotech
(CW2035S), HRP-labeled Goat Anti-Mouse IgG (H+L)
was purchased from Beyotime Biotechnology (Shang-hai, China), Antibodies were obtained from the follow-ing sources: anti-HLA-A (Abcam, ab52922), anti-CD45 (Abcam, ab10558), Ki67 (Abcam, ab15580), anti-glial fibrillary acidic protein (Dako), anti-Human Carci-noembryonic Antigen (clone II-7, Dako).
Patient tissue procurement
freezing in liquid nitrogen for DNA/RNA extraction, and fixed in 4% paraformaldehyde solution for 24 h and embedded into paraffin for histopathological analyses.
Patient tumor xenografts
The generation harboring patient-derived tumor tissue is termed as F1. And mice were bred and maintained at the local animal facility according to the legislation and ethi-cal approval was obtained for the establishment of patient derived xenografts (PDX). We carried out the trans-plant on a UV ultra clean table. Before imtrans-plantation, the necrotic tissues were removed, and the tissue was rinsed with sterile Hanks fluid. Solid tumor tissues were selected and cut into approximately 3 × 3 × 3 mm3 pieces for
preparation. 6–8 week-old NSG female mice were selected for the establishment of PDX models. Recipient immuno-compromised NSG mice were given general anesthesia via isoflurane inhalation continuously at 1–3% concentration with an oxygen flow rate of 9–10 cc/min. The mouse was placed ventral side down with a nose-cone to provide con-tinuous anesthesia. The left thigh was cleaned with 75% ethanol and a small horizontal 5 mm incision was made using sterile small surgical scissors. The tip of the sterile scissors was inserted into the incision, directly over the thigh, and the scissors were opened to introduce a pocket in the subcutaneous space. One individual piece of tumor tissue was inserted into the pocket using sterile forceps. The overlying skin was held together for 3–5 s with for-ceps to allow adequate time for drying. Monitoring for tumor growth was done up to 8 months after transplanta-tion for patient tumor (F0). If no tumor was palpable on animals after this period, grafting was considered unsuc-cessful. After outgrowth of patient tumor and reaching a size of approximately 500 mm3, PDX tumors were
har-vested and passaged to another batch of NSG mice and called F2. Tumors were typically transplanted two times consecutively (i.e. up to F3). After implantation, animals were carefully tended and observed. The length and width of the xenografts were measured once a week after tumor formation, and relative tumor volume was calculated using the formula: relative tumor volume = 0.5 × length diame-ter × short diameter2 [18]. Then the tumor volume growth
curve was figured out. During the growth of the tumor, the date and number of dead mice will also be recorded to cal-culate the survival rate of these tumor PDX models.
Tumor cryopreservation
After dissociation, tumor tissue not used for passaging or pathologic analysis was cryopreserved for banking and later usage. One part of the tumor was directly frozen in − 80 °C, another part was cut into pieces in micro tubes containing chilled 10% glycerin for 24 h, and transferred to liquid nitrogen for long-term storage.
Clinical data collection
The diagnosis of GBM, LC, GC and CRC was confirmed by histological analysis in all cases. The following patient characteristics were collected for research study only, including: gender, age, tumor site, histological grade, dif-ferentiated degree, and TNM classification.
Pathology
The surgical resection specimen was inspected and pro-cessed according to national and international guide-lines [20]. The microscopic assessment was performed by an experienced GI-pathologist and the final diagnosis was set in accordance with the WHO classification [21]. Adenocarcinomas and squamous cell carcinomas were classified according to site of origin and tumor stage, in accordance with the TNM classification of malignant tumors [22].
H&E staining
Tissues from all PDX models and the corresponding patient tumors were harvested and fixed in 4% Para-formaldehyde solution within 24 h after resection. Sec-tions were dehydrated and immersed in the wax prior to paraffin embedding and cut into slices of 4 μm on a microtome. Finally, the sections were stained with hema-toxylin and eosin and reviewed by a pathologist to con-firm the diagnosis.
Immunohistochemistry
Prepared tissue sections of 4 μm were de-paraffinized, followed by heat and high pressure mediated antigen retrieval with citrate buffer solution (pH 7.4). Endog-enous peroxidase activity was blocked with 3% hydrogen peroxide in PBS. Non-specific staining was blocked using normal goat serum for 40 min at room temperature. Pri-mary antibodies were diluted in normal antibody dilution buffer (Solarbio), applied on tissue sections and incu-bated overnight at 4 °C in a humidified chamber. Next day, biotin conjugated goat anti-rabbit IgG was used as the secondary antibody while Streptavidin-HRP applied as the third step both for 30 min at room temperature. Visualization was performed using DAB detection sys-tem. Antibodies used for immunohistochemistry were: anti-HLA-A (Abcam, 1:100), anti-CD45 (Abcam, 1:100), anti-Ki67 (Abcam, 1:100), anti-glial fibrillary acidic pro-tein (Dako, 1:100), anti-Human Carcinoembryonic Anti-gen (clone II-7, Dako, 1:100).
Statistical analysis
test (GraphPad Prism 5.0). p < 0.05 was considered statis-tically significant.
Results
Schematic outline of the generation of four different types of cancer PDX models and the growth and death of PDX model mice
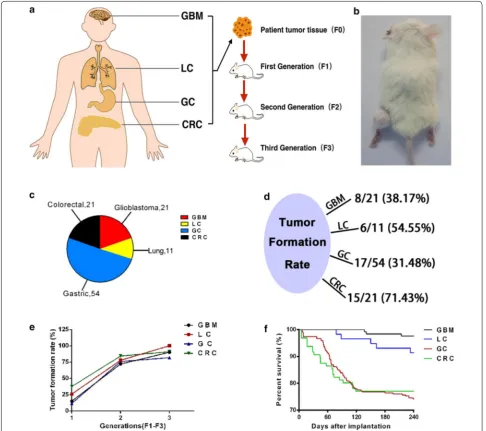
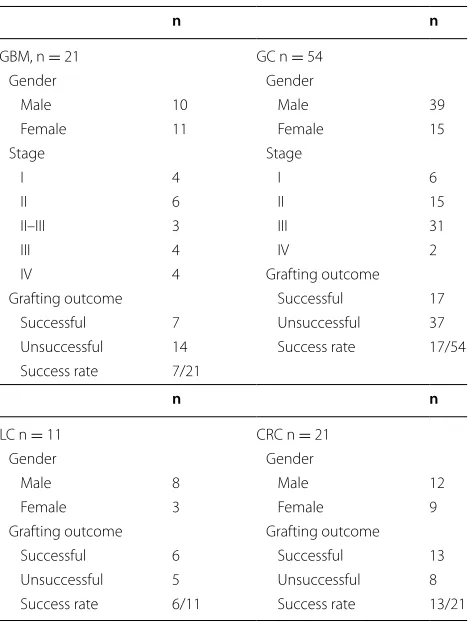
We analyzed 21 GBM, 11 LC, 54 GC and 21 CRC from the hospital (Fig. 1c), and put the brief information about patients’ number, gender and WHO grade in Table 1, detailed clinical pathology reports were shown at Addi-tional file 1: Table S1, Additional file 2: Table S2, Addi-tional file 3: Table S3, Additional file 4: Table S4. After we got a fresh tumor specimen, one part of it was directly
frozen, and the other part was used for pathological analy-sis, namely F0. The remainder was cut into pieces approx-imately 3 × 3 × 3 mm3, then implanted in the left thigh
of the NSG mice (Fig. 1b). The rates of tumor formation in GBM, LC, GC and CRC were 8/21, 6/11, 17/54 and 15/21, respectively (Fig. 1d). The first generation mice that received patient tumor specimens were recorded as F1. In general, one patient sample was implanted into four to six mice. All GBM, LC, GC, CRC were implanted in 125, 58, 267, 96 F1 mice respectively. After transplantation, the long and short diameters of the tumor and information on the survival of the PDX mice were recorded. When the tumor volume grew to 500 mm3 within 8 months,
PDX model was considered to be successful. The tumor
Fig. 1 Patient-derived xenograft (PDX) mice model. a Schematic outline of the generation of four different cancer PDXs. b Tumor transplanting site.
formation rates of F1 were 19/125, 15/58, 31/267, 36/96 respectively (Table 2). As for survival rate of F1 mice, sur-vival rates of GBM and LC were significantly higher than GC and CRC (Fig. 1f). As tumor volume of F1 mice grow to 500 mm3, the tumors were harvested and a part of these
tumors was frozen while another part was used for patho-logical analysis. The third part was divided into sections approximately 3 × 3 × 3 mm3 and transplanted to the
recipient mice named F2. All F1 GBM, LC, GC, CRC were implanted into 25, 9, 33, 19 F2. For F2, as in F1, the tumor growth rates and the animal survival rates were recorded.
As for F1, when the tumor volume grew to 500 mm3
within 6 months, it was considered to be successful, the tumor formation rates of F2 were calculated as 18/25, 7/9,
25/33, and 16/19 (Table 2). And so on, the third genera-tion was called F3, GBM, LC, GC, CRC each transplanted 10, 4, 22 and 11 mice. Likewise, make a record of growth and death of PDX model mice. Transplantation was con-sidered successful if the tumor volume grew to 500 mm3
within 4 months. The tumor formation rates of F3 were 9/10, 4/4, 18/22, 10/11 (Table 2). When the tumor volume of F3 grew to 500 mm3, the tumors were harvest, part for
frozen, part for pathological analysis. The entire process is indicated in Fig. 1a. We found that the tumor formation rate is positively correlated with generations (Fig. 1e). Comparison of the tumor growth rates in F1–F3 in each type of tumor PDX model
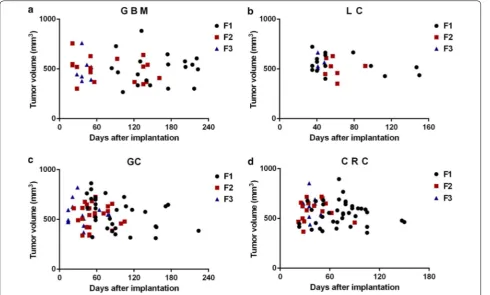
19 mice implanted with GBM in the F1 stage were positive for successful tumor growth and it took 84–223 days. 18 mice in F2 grew tumor successfully, it took 22–161 days. 9 mice in F3 grew tumor successfully, it took 28–51 days (Fig. 2a). 15 mice in LC F1 grew tumor successfully, it took 35–150 days. 7 mice in F2 grew tumor successfully, it took 49–92 days. 4 mice in F3 grew tumor successfully, it took 41–48 days (Fig. 2b). 31 mice in GC F1 grew tumor successfully, it took 44–224 days, F2 had 25 mice grew tumor successfully, it took 23–105 days, 18 mice in F3 grew tumor successfully, it took 14–80 days (Fig. 2c). 36 mice in CRC F1 grew tumor successfully, it took 23–150 days. 16 mice in F2 grew tumor successfully, it took 22–90 days. 10 mice in F3 grew tumor success-fully, it took 28–50 days (Fig. 2d). In brief, the longest tumor formation day of the four different tumors in F1 is 224, F2 is 161, and F3 is 80, in other word, the tumor growth rate accelerated with the increase of generation.
Histopathological comparison of patient tissue
with transplanted tumors and the tumor volume growth curves for all generations in GBM‑16
In F1, F2 and F3, some tumor cells were similar to F0, the tissue heteromorphism was more obvious than F0, and the tumor cells showed a dense distribution (Fig. 3a). Tumor volume growth curves for GBM-16 in F2 and F3 were visibly faster than F1 (Fig. 3b). As for the immuno-histochemical data, HLA-A and GFAP protein expression in all generations were similar (Fig. 3c, f). CD45 protein Table 1 Clinical characteristics of biobank patients
n n
GBM, n = 21 GC n = 54
Gender Gender
Male 10 Male 39
Female 11 Female 15
Stage Stage
I 4 I 6
II 6 II 15
II–III 3 III 31
III 4 IV 2
IV 4 Grafting outcome
Grafting outcome Successful 17 Successful 7 Unsuccessful 37 Unsuccessful 14 Success rate 17/54 Success rate 7/21
n n
LC n = 11 CRC n = 21
Gender Gender
Male 8 Male 12
Female 3 Female 9
Grafting outcome Grafting outcome Successful 6 Successful 13 Unsuccessful 5 Unsuccessful 8 Success rate 6/11 Success rate 13/21
Table 2 The tumor formation rate and mortality rate of PDX models
Tumor formation rate Mortality rate
F1 F2 F3 F1 F2 F3
GBM 19/125 (15%) 18/25 (72%) 9/10 (90%) 3/125 (2%) 1/25 (4%) 0/10 (0%)
LC 15/58 (26%) 7/9 (78%) 4/4 (100%) 3/58 (5%) 2/9 (22%) 0/4 (0%)
expression in F1, F2 and F3 was dramatically reduced in comparison to the expression levels in F0 (Fig. 3d). The numbers of Ki67 positive cells in F1 and F2 were no less than F0, but F3 showed higher numbers of Ki67 positive cells (Fig. 3e).
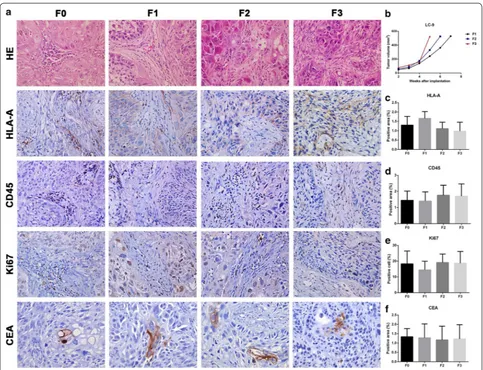
Histopathological comparison of patient tissues with transplanted tumors and the tumor volume growth curves of all generations in LC‑9
Compared with F0, tumor cells in F1, F2 and F3 had obvious heteromorphism and pathologic mitosis. Besides, some tumor cells were similar to F0, and they all owned similar tissue stroma (Fig. 4a). Tumor growth rates of LC-9 were accelerated as the generation number increased (Fig. 4b). HLA-A, CD45, CEA protein expres-sion and cells positive for Ki67 in F1, F2 and F3 were sim-ilar to F0 (Fig. 4c–f).
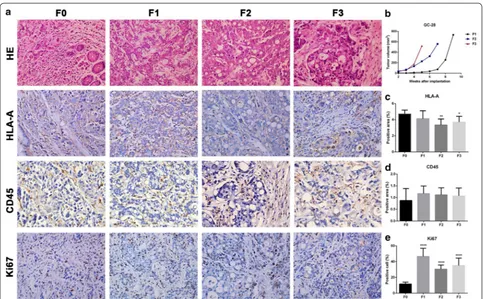
Histopathological comparison of patient tissue
with transplanted tumors and the tumor volume growth curves for all generations in GC‑28
Inflammatory reactions in F1, F2, and F3 were lesser than the reactions observed in F0, while the tumor cell density was higher. However, tumor tissues and cells in all gen-erations showed obvious heteromorphism and similar
morphology (Fig. 5a). Accelerated tumor growth rate was observed for GC-28 as the generation increased (Fig. 5b). HLA-A protein expression in F1 was the same as F0, but decreased in F2 and F3 (Fig. 5c). CD45 protein expression in F1, F2 and F3 were similar to F0 (Fig. 5d). More cells were positive for Ki67 in F1, F2, and F3 as compared to the F0 (Fig. 5e).
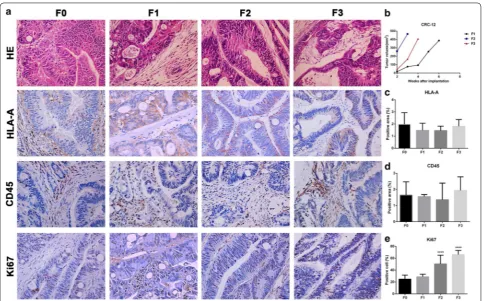
Histopathological comparison of patient tissues with transplanted tumors and the tumor volume growth curves for all generations in CRC‑12
According to the H&E staining, xenograft models main-tained the tumor tissue cell morphology and the mesen-chymal components of parental tumor tissue (Fig. 6a). The tumor growth rate for CRC-12 in F2 and F3 were faster than F1. However, F3 was slower than that of F2 (Fig. 6b). HLA-A and CD45 protein expression in F1, F2 and F3 were same as F0 (Fig. 6c, d). Cells positive for Ki67 were similar in F1 and F0 while the number of cells positive increased in F2 and F3 compared to F1 (Fig. 6e). Discussion
tumor microenvironment and can be used to understand the impact of various anti-cancer treatments. Preclinical trials for validation of potential therapeutic targets via in vitro and in vivo models are regarded indispensable in the development of anti-cancer drug therapeutics [23]. However, standard tumor cell lines expanded in vitro and cell line-derived xenografts show low predictability of drug sensitivities because of failure to accurately reflect the genetic and functional aspects related to the hetero-geneity of the tumor cells [24]. In contrast, animal mod-els are regarded as appropriate tools to resolve both basic and clinical research problems [25]. Therefore, patient-derived xenografts (PDX) can overcome the limitations of in vitro models by faithfully recapitulating the histo-logical and functional heterogeneity observed in primary tumor samples [2].
In recent years, patient derived xenografts (PDXs) have been used to evaluate targeted treatments for dif-ferent types of tumors, such as breast and non-small cell lung cancer, esophageal squamous cell carcinoma. The response of PDXs to chemotherapy has been shown to resemble the patient response in different clinical treat-ment trials [16, 26, 27]. In the last decade, the PDX model has been widely used for preclinical research. However, few studies have detailed the methodology of many types of PDX establishment and various factors that affect the tumor formation rate. Therefore, we summarized the detailed records during the development of the PDX models for different human tumors to provide a reliable reference.
passaging is crucial to expand primary tumor tissue for biobanks and cohorts for preclinical mouse avatar trials. In general, all PDXs eventually lose the human stromal elements and therefore, the consensus is that a low-passage number is ideal to conserve the histological and genetic integrity of the primary tumor [28]. In this paper, we passaged the parental tumors (F0) up to three genera-tions-F1, F2, and F3 respectively.
In the past, generally all PDX models are implanted with the patient tumor tissue in the flank of mice. We however implanted the tumor in the left thigh of mice for three reasons: it is convenient to observe and meas-ure the tumor size, fixed position of tumor was in favor of fixed point chemotherapy for our future studies and it is easy to determine whether the tumor is metastatic, fol-lowing tumor resection. Most important of all, we found
that there are many related reports in the very early research injecting cell line or solid tumor subcutane-ously into the right thigh or hind limb of mice and calcu-lating tumor volume to benefit fixed point radiotherapy [29–33].
To evaluate whether established PDX models resemble the original patient tumor, the histology of tumor sam-ples from the PDX was assessed based on representa-tive hematoxylin–eosin (HE) staining of the parental tumor (F0) and homologous F1, F2, F3 tumors. We found that these xenografts closely rebuilt the original patient tumors and the tumor cells had similar morphologies and/or associated intercellular stromal elements in suc-cessive PDX generations, thereby underlining the value of PDX for modeling morphologically heterogeneous patient tumors in vivo. Although we did not examine Fig. 4 Histopathological comparison of patient tissues with transplanted tumors and the tumor growth curves of LC-9. a H&E and immunohisto-chemistry staining of HLA-A, CD45, Ki67, CEA on (F0) patient tumor and derived (F1-F3) transplanted tumors. b The tumor growth curve of LC-9. c,
the gene expression patterns in this paper, we confirmed that the xenograft tumors-F1, F2 and F3 exhibited simi-lar immunohistochemical phenotypes to that of patient’s original tumor, which indicates that PDXs primarily maintain the histopathological and molecular character-istics of the parental tumor.
In addition, we found certain patterns during serial passaging in vivo. Obviously, tumor formation rate increased significantly in subsequent tumor generations. Also, the survival rates of GC and CRC were remarkably higher than GBM and LC. As for the time required for the formation of tumors, which reflects the tumor growth rate, indicated that tumor growth rate always increased as the generation number increased. The tumor growth curves also illustrate this law. Similarly, the survival rate of PDX mice gradually improved with the increased gen-eration number in GC and CRC. And generally, there
was more proliferation (Ki67+) in the PDX models than in the patient tumors, which was in accordance with the results of tumor growth rate.
Conclusion
In summary, we established four different types of PDX models successfully, and our findings are of particular rel-evance for current and future preclinical mouse studies correlating drug screening and personalized anti-tumor therapy in different types of tumors, including GBM, LC, GC and CRC. It is quite clear that further large scale studies are required to validate our conclusion, especially for LC. In addition, we are planning to investigate chem-otherapeutic drugs in PDX mice models. Nonetheless, future studies are still warranted to determine if PDX technique can be widely used as an important tool to develop the novel drugs against drug-resistant tumors in Fig. 5 Histopathological comparison of patient tissue with transplanted tumor tissues and the tumor growth curves of GC-28. a H&E and immuno-histochemistry staining for HLA-A, CD45, Ki67 on (F0) patient tumor and derived (F1-F3) transplanted tumors. b The tumor growth curves of GC-28.
preclinical trials and to guide in the treatment decisions for individual patients upon tumor progression on stand-ard treatment.
Abbreviations
PDX: patient derived xenograft; GBM: glioblastoma; LC: lung cancer; GC: gastric cancer; CRC: colorectal cancer; GFAP: glial fibrillary acidic protein; CEA: carci-noembryonic antigen; F0: the patient tumor; F1: first generation; F2: second generation; F3: third generation.
Authors’ contributions
RH, GL, XJ, SC and WL participated in experimental design. XJ, SC, SX, GF, JH, ZP performed all experiments. YG, XQ, HY, CW, HL, ZH, GD, QY, XY, YX, FL provided patient specimens. NC sent back patient specimens from hospitals. XJ and SC analyzed data. XJ and WL wrote and edited the manuscript. All authors read and approved the final manuscript.
Additional files
Additional file 1: Table S1. Clinical characteristics of GBM patients. Additional file 2: Table S2. Clinical and pathological characteristics of LC patients.
Additional file 3: Table S3. Clinical characteristics of GC patients. Additional file 4: Table S4. Clinical and pathological characteristics of CRC patients.
Author details
1 School of Basic Courses, Guangdong Pharmaceutical University,
Guang-zhou 510006, China. 2 Guangdong Laboratory Animals Monitoring Institute,
Guangdong Key Laboratory Animal Lab, 11 Fengxin Road, Science City, Guangzhou 510663, China. 3 Department of Neurosurgery, Zhujiang Hospital,
Southern Medical University, Guangzhou 510282, China. 4 Department of General
Surgery, Nanfang Hospital, Southern Medical University, 1838 Baiyun Road North, Guangzhou 510080, China. 5 Department of Thoracic Surgery, Sun Yat-Sen
Uni-versity Cancer Center, Guangzhou 510030, China. 6 Guangdong Key Laboratory
for Research and Development of Natural Drug, Guangdong Medical University, Zhanjiang 524003, Guangdong, China. 7 Guangdong Provincial Key Laboratory
of Colorectal and Pelvic Floor Diseases, Guangdong Institute of Gastroenterology and the Sixth Affiliated Hospital, Sun Yat-sen University, Guangzhou 510150, China.
Acknowledgements
Not applicable.
Competing interests
The authors declare that they have no competing interests.
Availability of data and materials
The data supporting the conclusions of this paper are included within the manuscript.
Consent for publication
The manuscript is approved by all authors for publication.
Ethics approval and consent to participate
The laboratory animal facility has been accredited by AAALAC (Association for Assessment and Accreditation of Laboratory Animal Care International) and the IACUC (Institutional Animal Care and Use Committee) of Guangdong Fig. 6 Histopathological comparison of patient tissue with transplanted tumors and the tumor growth curves of CRC-12. a H&E and immunohis-tochemistry staining for HLA-A, CD45, Ki67 in patient tumor (F0) and derived (F1–F3) transplanted tumors. b Tumor growth curve of CRC-12. c, d
• We accept pre-submission inquiries
• Our selector tool helps you to find the most relevant journal • We provide round the clock customer support
• Convenient online submission • Thorough peer review
• Inclusion in PubMed and all major indexing services • Maximum visibility for your research
Submit your manuscript at www.biomedcentral.com/submit
Submit your next manuscript to BioMed Central
and we will help you at every step:
Laboratory Animal Monitoring Institute approved all animal protocols used in this study.
Funding
The present study was funding by the Science and Technology Pro-jects of Guangdong Province (2015A040404026, 2016A040403064 and 2017A070702001), China.
Publisher’s Note
Springer Nature remains neutral with regard to jurisdictional claims in pub-lished maps and institutional affiliations.
Received: 23 October 2017 Accepted: 13 December 2017
References
1. Jin K, Teng L, Shen Y, et al. Patient-derived human tumour tissue xeno-grafts in immunodeficient mice: a systematic review. Clin Transl Oncol. 2010;12:473–80.
2. Tentler JJ, Tan AC, Weekes CD, et al. Patient-derived tumour xeno-grafts as models for oncology drug development. Nat Rev Clin Oncol. 2012;9:338–50.
3. Daniel VC, Marchionni L, Hierman JS, et al. A primary xenograft model of small-cell lung cancer reveals irreversible changes in gene expression imposed by culture in vitro. Cancer Res. 2009;69:3364–73.
4. Herrmann D, Conway JR, Vennin C, et al. Three-dimensional cancer models mimic cell-matrix interactions in the tumour microenvironment. Carcinogenesis. 2014;35:1671–9.
5. Mishra DK, Creighton CJ, Zhang Y, et al. Gene expression profile of A549 cells from tissue of 4D model predicts poor prognosis in lung cancer patients. Int J Cancer. 2014;134:789–98.
6. Sausville EA, Burger AM. Contributions of human tumor xenografts to anticancer drug development. Cancer Res. 2006;66:3351–4.
7. Boedigheimer MJ, Freeman DJ, Kiaei P, et al. Gene expression profiles can predict panitumumab monotherapy responsiveness in human tumor xenograft models. Neoplasia. 2013;15:125–32.
8. Damhofer H, Ebbing EA, Steins A, et al. Establishment of patient-derived xenograft models and cell lines for malignancies of the upper gastroin-testinal tract. J Transl Med. 2015;13:115.
9. Rubio-Viqueira B, Hidalgo M. Direct in vivo xenograft tumor model for predicting chemotherapeutic drug response in cancer patients. Clin Pharmacol Ther. 2009;85:217–21.
10. Rubio-Viqueira B, Jimeno A, Cusatis G, et al. An in vivo platform for translational drug development in pancreatic cancer. Clin Cancer Res. 2006;12:4652–61.
11. Kim MP, Evans DB, Wang H, et al. Generation of orthotopic and hetero-topic human pancreatic cancer xenografts in immunodeficient mice. Nat Protoc. 2009;4:1670–80.
12. Johnson JI, Decker S, Zaharevitz D, et al. Relationships between drug activity in NCI preclinical in vitro and in vivo models and early clinical trials. Br J Cancer. 2001;84:1424–31.
13. Hidalgo M, Bruckheimer E, Rajeshkumar NV, et al. A pilot clinical study of treatment guided by personalized tumorgrafts in patients with advanced cancer. Mol Cancer Ther. 2011;10:1311–6.
14. Ledford H. US cancer institute overhauls cell lines: veteran cells to be replaced by human tumours grown in mice. Nature. 2016;530(7591):391 (Academic OneFile, Accessed 1 Sept. 2017).
15. Gao H, Korn JM, Ferretti S, et al. High-throughput screening using patient-derived tumor xenografts to predict clinical trial drug response. Nat Med. 2015. https://doi.org/10.1038/nm.3954.
16. Zhang J, Jiang D, Li X, et al. Establishment and characterization of esopha-geal squamous cell carcinoma patient-derived xenograft mouse models for preclinical drug discovery. Lab Invest. 2014;94:917–26.
17. Dieter SM, Giessler KM, Kriegsmann M, et al. Patient-derived xenografts of gastrointestinal cancers are susceptible to rapid and delayed B-lym-phoproliferation. Int J Cancer. 2017;140:1356–63.
18. Zhuang Y, Zhu Y, Wang H, et al. Establishment of patient-derived tumor xenograft (PDTX) models using samples from CT-guided percutaneous biopsy. Br J Med Res. 2017;50(6):e6000.
19. Stewart E, Federico SM, Chen X, et al. Orthotopic patient-derived xenografts of paediatric solid tumours. Nature. 2017;10:1038. https://doi. org/10.1038/nature23647.
20. Westra WH. Surgical pathology dissection: an illustrated guide. 2nd ed. New York: Springer; 2003.
21. Bosman FT, World Health Organization, International Agency for Research on Cancer. WHO classification of tumors of the digestive system. 4th ed. Lyon: International Agency for Research on Cancer; 2010.
22. Sobin LH, Gospodarowicz MK, Wittekind C, International Union against Cancer. TNM classification of malignant tumors. 7th ed. Chichester: Wiley-Blackwell; 2010.
23. Zhao X, Liu Z, Yu L, et al. Global gene expression profiling confirms the molecular fidelity of primary tumor-based orthotopic xenograft mouse models of medulloblastoma. Neuro Oncol. 2012;14:574–83.
24. Gillet JP, Calcagno AM, Varma S, et al. Redefining the relevance of estab-lished cancer cell lines to the study of mechanisms of clinical anticancer drug resistance. Proc Natl Acad Sci USA. 2011;108:18708–13.
25. Jiang Y, Wu Q, Yang X, et al. A method for establishing a patient-derived xenograft model to explore new therapeutic strategies for esophageal squamous cell carcinoma. Oncol Rep. 2016;35:785–92.
26. Van HP, Hulshof MC, Van LJ, et al. Preoperative chemoradiotherapy for esophageal or junctional cancer. N Engl J Med. 2012;366:2074–84. 27. Ruhstaller T, Widmer L, Schuller JC, et al. Multicenter phase II trial of
preoperative induction chemotherapy followed by chemoradiation with docetaxel and cisplatin for locally advanced esophageal carcinoma (SAKK 75/02). Ann Oncol. 2009;20:1522–8.
28. Morgan KM, Riedlinger GM, Rosenfeld J, et al. Patient-derived xenograft models of non-small cell lung cancer and their potential utility in person-alized medicine. Front Oncol. 2017;7:2.
29. Edwards E, Geng L, Tan J, et al. Phosphatidylinositol 3-kinase/Akt signaling in the response of vascular endothelium to ionizing radiation. Cancer Res. 2002;62:4671–7.
30. Garcia-Barros M, Paris F, Cordon-Cardo C, et al. Tumor response to radiotherapy regulated by endothelial cell apoptosis. Science. 2003;300:1155–9.
31. Gerweck LE, Vijayappa S, Kurimasa A, et al. Tumor cell radiosensitiv-ity is a major determinant of tumor response to radiation. Cancer Res. 2006;66:8352–5.
32. Ogawa K, Boucher Y, Kashiwagi S, et al. Influence of tumor cell and stroma sensitivity on tumor response to radiation. Cancer Res. 2007;67:4016–21. 33. Garcia-Barros M, Thin TH, Maj J, et al. Impact of stromal sensitivity on