_____________________________________________________________________________________________________ *Corresponding author: E-mail: shawonjess@gmail.com, shawonjess01@gmail.com;
Effect of Nitrogen and Phosphorus on the Growth
and Seed Yield of Spinach
Md. Rafiqul Islam
1, Khaleda Khatun
2, Tahmina Mostarin
2, Md. Ehsanul Haq
3*,
Md. Nahidul Islam
2, Bithi Rani Biswas
2and Jinia Afsun
21Institute of Seed Technology, Sher-e-Bangla Agricultural University, Dhaka, Bangladesh.
2
Department of Horticulture, Sher-e-Bangla Agricultural University, Dhaka, Bangladesh. 3
Plant Breeding Division, Bangladesh Rice Research Institute, Gazipur, Bangladesh.
Authors’ contributions
This work was carried out in collaboration among all authors. Authors KK and TM planned the experiment and lead the research. Authors TM, KK and MRI designed and carried out the research. Authors MEH and MRI performed the statistical analysis. Author MRI carried out the research on the field. Authors MNI, BRB and JA collected the data. Authors MRI and MEH wrote the manuscript. Authors MRI, MNI, BRB and JA managed the literature searches. All authors provided critical feedback and helped shape the research, analysis and manuscript. All authors read and approved the final manuscript.
Article Information
DOI: 10.9734/APRJ/2019/v3i130056 Editor(s): (1)Dr. Nesreen Houssien Abou- Baker ,Associate Professor, Department of Soil and Water Use, Division of Agricultural and Biological Research, National Research Centre, Giza, Egypt. (2)Dr. Langa Tembo, Lecturer, Department of Agriculture Production, Makerere University, Kampala, Uganda And Department of Plant Science, University of Zambia, Lusaka, Zambia. Reviewers: (1)Jamile da Silva Oliveira, Brazil. (2)Munene Rozy, Kenyatta University, Nairobi, Kenya. Complete Peer review History:http://www.sdiarticle3.com/review-history/50718
Received 24 June 2019 Accepted 24 August 2019 Published 29 August 2019
ABSTRACT
The experiment was conducted at the farm of Sher-e-Bangla Agricultural University, Dhaka, Bangladesh during Rabi (November 2017 to March 2018) season to find out the growth, yield and economic benefit of spinach seed as influenced by nitrogen and phosphorus. The research involved two factors. Factor A: Four levels of nitrogen; N0= 0 kg/ha N1= 27.6 kg/ha, N2=55.2 kg/ha, N3= 82.8
kg/ha, and factor B: Four levels of phosphorus; P0= 0 kg/ha; P1 = 15.84 kg/ha, P2= 31.68 kg/ha, P3=
47.52 kg/ha. There were 16 treatment combinations in the experiment and laid out in Randomized
Complete Block Design (RCBD) with three replications. Quality tests of seeds were done based on the germination test (%), seed vigor test (Electrical conductivity). In case of nitrogen, the highest
seed yield (1.10 t ha-1), germination percentage (87.33%) and lowest value in EC test (11.87 dS/cm) were obtained from N2, while the lowest seed yield (0.81 t ha-1), germination percentage (79.33%)
and highest value in EC test ( 13.87 dS/cm) from N0. For phosphorus levels, the highest seed yield
(1.05 t ha-1), germination percentage (86.58 % and) and lowest value in EC test (11.79 dS/cm) were recorded from P2, whereas the lowest seed yield (0.84 t ha-1), germination percentage (79.91%) and
highest value in EC test (13.35 dS/cm) from P0. Due to mutual effect, the highest seed yield (1.30 t
ha-1), germination percentage (91.33%) and lowest value in EC test (10.2 dS/cm) were noted from
N2P2, whereas the lowest seed yield (0.69 t ha-1), germination percentage (72.66%) and highest
value in EC test (14.83 dS/cm) from N0P0. From the economic point of view, the highest Benefit-Cost
Ratio (BCR) (1.59) was found in the treatment of N2P2 and the lowest BCR (1.01) was found in the
treatment of N0P0. It is apparent that the treatment combination N2P2 gave the best performance for
the seed yield and economic benefit of spinach.
Keywords: Growth; nitrogen; phosphorus; seed yield.
1. INTRODUCTION
Spinach (Spinacia oleracea) is a leafy green cool-season vegetable that is known for its nutritive value and is considered one of the most popular vegetables in Bangladesh. It is believed to have originated from Persia. Its leaves are a common edible vegetable. By weight, spinach consists of 91.4% water, 3.6% carbons, and 2.9% protein [1]. There are 23 calories in 100 grams of spinach and further benefits of spinach leaves consumption can be of more value e.g vital mineral elements in spinach compared to other vegetables e.g iron which is very good for women. The seed is produced for commercial consumption and for seed companies that supply seed throughout the country. In Bangladesh spinach occupies 22000 acres [2] with an annual production of 66000 tons. In comparison to other countries, this yields much lower. So, to use of quality seeds of high yield varieties are the foremost important technique for maximizing yield per unit area. Quality seed can increase vegetable production by up to 25-50% [1]. Farmers save seeds annually of about 50 tons and used every year, which in most cases are of inferior in quality [3]. Appropriate fertilizer application to the plants greatly affects their
growth and production. Nitrogen strongly
stimulates growth, expansion of the crop canopy and interception of solar radiation [4]. Increasing the levels of nitrogen during the vegetative stage can strengthen and allow a plant to grow more rapidly and produce large amounts of succulent, green foliage, which in turn can generate higher yields [5]. Similarly, phosphorus (P) is an essential nutrient act as catalysts in the
conversion of numerous key biochemical
reactions in plants. Phosphorus stimulates root development, improves flower formation, seed production and improves crop quality and
increases resistance to plant diseases [6]. Leafy
vegetables, particularly, spinach is highly
responsive to fertilization [7] and oxalates are the main indexes of the quality due to a very efficient uptake system and inefficient reductive systems [8]. The fertilizer requirements on sandy and sandy loams are 85 to 120 kg N, 75 to 85 kg P2O5, and 85 to 150 kg K2O. On heavier clay
soils, 75 kg ha-1 of each nutrient should be adequate. If the fertilizer is banded at seeding it should be placed along each side of the rows 2 to 3 inches below the level of the seed and 6 inches to the side of the row; fertilizer should never come in contact with the seed and two or three splits of 85 to 120 kg ha-1 N would be adequate as side-dressing [9]. An adequate supply of fertilizers can promote plant growth and increase crop production, but excessive and inappropriate use of chemical fertilizers causes accumulation of compounds in the edible products which can be detrimental to human health in addition cause environmental pollution and economic losses [10]. Fadaly and Mishriky [11] found that N increased the spinach yield and enhanced the accumulation of N and P in leaves. Assiouty et al.[12] reported that application of 40 kg N + 15.0 kg P2O5 increased plant fresh yield
by 27.2 and 42.3% and 16.3 and 10.4% in seed yield in relation to the control in the first and second seasons, respectively. Boroujerdnia and Ansari [13] achieved the highest yield with 120 kg N ha-1 Farmers in Bangladesh generally do not use any improved or special techniques for quality seed production. There for to achieve higher seeds yield with good quality fertilizer management is an important practice which cannot be emphasized. The present study was thus undertaken to evaluate the effects of nitrogen and phosphorus on the growth, yield
and economic benefit of spinach (Spinacia
2. MATERIALS AND METHODS
2.1 Experimental Site
The experiment was conducted at the Agronomy Research Farm of Sher-e-Bangla Agricultural University (SAU), Dhaka, Bangladesh from November 2017 to March 2018. Experimental site situated an elevation of 8 meters above the sea level in the Agro-ecological zone of "Madhupur Tract" (AEZ-28). The soil was sandy loam and medium high land in texture having pH 5.46- 5.62.
2.2 Experiment Frame Work
The research was consisted of two factors: Factor A: Four levels of nitrogen; N0= 0 kg/ha
N1= 27.6 kg/ha, N2=55.2 kg/ha, N3= 82.8 kg/ha,
and factor B: Four levels of phosphorus; P0= 0
kg/ha-); P1 = 15.84 kg/ha, P2= 31.68 kg/ha, P3=
47.52 kg/ha. The two factors experiment was laid out following the Randomized Complete Block Design (RCBD) with three replications. The experiment was divided into three equal blocks where each block was divided into 16 plots. Then
16 treatment combinations were allotted
randomly in each block. The size of each unit plot was 1.5 m × 1 m. The distance maintained between two blocks and two plots were 0.75 m and 0.5 m, respectively. Row to row distance was 30 cm and plant to plant distance was 20 cm.
2.3 Application of Manure and Fertilizers
About 5 t ha-1 well-decomposed cow dung was applied as the control (N0P0) treatment) plot and
incorporated adequately to the soil during final land preparation whereas other plots were applied with inorganic fertilizer as per treatment. Doses of inorganic fertilizers (Urea and Triple
superphosphate) were applied in the
experimental plot according to the treatments
(Table 1). The whole amount of TSP and half the amount of urea and MoP (180 kg/ha)
were also applied as basal dose before sowing of seed in the main field. 1st top dressing
of urea was applied when seedlings established in the main field about 10 days after seed sowing. 2nd top dressing of urea and the rest amount of MoP was applied about 25 days after 1st top dressing. Then the rest amount of urea was applied as 3rd installment after flowering. Each top dressing was followed by manual irrigation.
2.4 Economic Analysis
The cost of production was analyzed in order to
find out the most economic treatment of nitrogen and phosphorus for quality seed production of spinach. All the non-material
and material input costs and interests in running capital were considered for computing
the cost of production. The benefit-cost ratio (BCR) was calculated by the following
formula:
Benefit-cost ratio (BCR) = Gross return (tk/ha) ÷ Total cost of production (tk/ha)
2.5 Statistical Analysis
The data obtained for different characters were statistically analyzed to observe the significant difference among the treatment by using the STATISTIX-10 computer package program. The mean values of all the characters were calculated and analysis of variance was performed. The significance of the difference among the treatments means was estimated by the Least Significant Different Test (LSD) at 5% level of probability.
Table 1. Doses of nutrients application in the main field as per treatment
Treatments N rates (kg ha-1)
Fertilizers (kg ha-1)
Doses (g plot-1)
Treatments P rates (kg ha-1)
Fertilizes (kg ha-1)
Doses (g plot-1)
N Urea Urea P TSP TSP
N0 0 0 0 P0 0 0 0
N1 27.6 60 9 P1 15.84 75 11.25
N2 55.2 120 18 P2 31.68 150 22.5
3. RESULTS AND DISCUSSION
3.1 Plant Height (cm)
A significant variation was observed on the plant height of spinach due to the application of different levels of nitrogen (Table 2). The highest plant height 13.94 cm and 47.69 cm were obtained before flowering and at the time of harvest respectively from N3 while the lowest
plant height 11.01 cm and 34.88 cm were obtained before flowering and at the time of harvest respectively from N0. P3 showed the
highest plant height 13.64 cm and 46.68 cm before flowering and at the time of harvest respectively and the lowest plant height 11.60 cm and 35.18 cm at before flowering and at the time of harvest respectively in P0 (Table 3).
The combined effect of different levels of nitrogen and phosphorus application showed a significant effect on the plant height of spinach (Table 4). The highest plant height 15.21 cm and 55.25 cm before flowering and at the time of harvest, respectively was observed in N3P3 while
the lowest plant height 10.10cm and 27.7 cm before flowering and at the time of harvest, respectively in N0P0.
3.2 Number of Leaves per Plant
The effect of nitrogen on the number of leaves per plant of spinach was significant (Table 2).
The highest number of leaves (8.46) was
produced from N2 and the lowest number of
leaves (6.42) was observed in N0. P2 showed the
maximum leaves per plant (8.30) and the minimum leaves per plant (6.36) was observed in P0 (Table 3).
The combined effect of different levels of nitrogen and phosphorus showed a significant effect on the number of leaves per plant of spinach (Table 4). The maximum leaves per plant (10.35) were observed in N2P2 and the
lowest leaves per plant (5.01) were recorded with N0P0, [14] also found a similar result.
3.3 Number of Inflorescence per Plant
Statistically significant differences were found on the number of inflorescence per plant of spinach due to the application of nitrogen (Table 5). The highest number of inflorescence per plant(8.03)
was recorded from N2 whereas, the lowest
number (5.17) was observed from N0. The
highest number of inflorescence per plant (7.80)
was recorded from P2 and the lowest (4.94) was
found from P0 (Table 6).
Table 2. Effect of nitrogen on plant height (before flowering and at the time of harvest) leaves per plantof spinach
Treatments Plant height before
flowering (cm)
Plant height at the time of harvest (cm)
Leaves per plant
N0 11.01 34.88 6.42
N1 12.34 40.35 7.24
N2 13.07 43.75 8.46
N3 13.94 47.69 7.84
LSD 0.87 3.12 0.54
CV % 8.34 9.00 8.70
Here, N0= 0 kg/ha; N1=27.6 kg/ha; N2= 55.2 kg/ha; N3= 82.8 kg/ha
Table 3. Effect of phosphorus on plant height (before and at the time of harvest), Leaves per plantof spinach
Treatments Plant height before
flowering
Plant height at the time of harvest
Leaves per plant
P0 11.60 35.18 6.36
P1 12.16 40.37 7.24
P2 12.96 44.44 8.30
P3 13.64 46.68 8.06
LSD 0.87 3.11 0.543
CV % 8.34 9.00 8.70
Table 4. Combined effect of nitrogen and phosphoruson the plant height (before and at the time of harvesting), leaves per plantof spinach
Treatments Plant height before
flowering (cm)
Plant height at the time of harvest (cm)
Leaves per plant
N0 P0 10.10 27.7 5.01
N0 P1 10.63 34.34 6.25
N0 P2 11.25 37.31 6.66
N0 P3 12.07 40.18 7.76
N1 P0 11.49 34.65 6.60
N1 P1 12.15 41.03 7.33
N1 P2 12.60 42.44 7.46
N1 P3 13.12 43.29 7.58
N2 P0 12.14 37.88 6.91
N2 P1 12.54 21.80 7.81
N2 P2 13.42 47.31 10.35
N2 P3 14.17 48.01 8.76
N3 P0 12.65 40.51 6.93
N3 P1 13.35 44.30 7.56
N3 P2 14.56 50.71 8.73
N3 P3 15.21 55.25 8.13
LSD 1.75 6.25 1.08
CV % 8.34 9.00 8.70
Here, N0= 0 kg/ha; N1=27.6 kg/ha; N2= 55.2 kg/ha; N3= 82.8 kg/ha.
P0= 0 kg/ha; P1= 15.84 kg/ha; P2= 31.68 kg/ha; P3= 47.52 kg/ha.
The combined effect of nitrogen and phosphorus showed significant variation in the number of inflorescences per plant (Table 7). The highest number of inflorescence per plant (10.53) was recorded from N2P2 and the lowest number of
inflorescence per plant (3.90) from N0P0.
3.4 Length of Inflorescence
A significant variation was observed on the
length of an inflorescence of spinach when
different levels of nitrogen were applied (Table 5). The highest length of inflorescence (29.54 cm) was recorded in N2 and the lowest length of
inflorescence (19.09 cm) from N0. The highest
length of inflorescence (28.97 cm) was recorded
in P3 and the lowest length of inflorescence
(20.58 cm) was recorded in P0 (Table 6).
The combined effect of different levels of nitrogen and phosphorus showed a significant effect on the length of inflorescence (Table 7). The highest length of inflorescence (35.04 cm) was observed in N2P2 and the lowest length of
inflorescence(15.19 cm) was recorded in N0P0.
3.5 Number of Seeds per Inflorescence
Statistically significant differences were found on the number of seeds per inflorescence of spinach due to the application of different nitrogen levels
(Table 5). The maximum seeds per inflorescence (58.68) was recorded from N2 (55.2 kg/ha) and
the minimum (38.15) was observed from N0. The
highest seeds per inflorescence (57.19) were recorded from P2 and the lowest number of
seeds per inflorescence (39.13) in P0 (Table 6).
The number of seeds per inflorescence was
significantly influenced by the combined
application of nitrogen and phosphorus (Table 7).
The maximum number of seeds per
inflorescence (70.41) was recorded from N2P2
and the lowest number of seeds per
inflorescence (35.33) in N0P0.
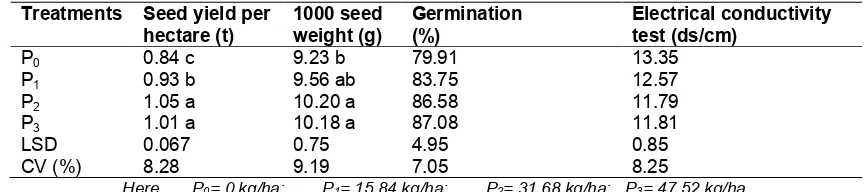
3.6 Seed Yield per Hectare (Ton)
Statistically significant differences were found for seed yield per hectare of spinach due to different nitrogen levels (Table 8). The maximum seed yield (1.10 t ha-1) was recorded from N2 and the
lowest (0.81 t ha-1) was recorded from N0. The
maximum seed yield (1.05 t ha-1) was recorded from P2 and the lowest (0.84 t ha-1) was recorded
from P0 (Table 9.). The combined effect of
nitrogen and phosphorus showed significant variation in the seed yield of spinach (Table 10). The highest seed yield (1.30 t/ha) was recorded from the combination of N2P2 and the lowest
(0.69 t ha-1) was recorded from N0P0 treatment
Table 5. Effect of nitrogen on number of inflorescence per plant, inflorescence length and seeds per inflorescenceof spinach
Treatments Number of
inflorescence per plant
Inflorescence length (cm)
Seeds per inflorescence
N0 5.17 19.99 38.15
N1 6.30 23.56 47.37
N2 8.03 29.54 58.86
N3 7.13 29.01 56.28
LSD 0.47 1.857 3.40
CV % 8.48 8.73 8.12
Here, N0= 0 kg/ha; N1=27.6 kg/ha; N2= 55.2 kg/ha; N3= 82.8 kg/ha.
Table 6. Effect of phosphorus on number of inflorescence per plant, inflorescence length and seeds per inflorescenceof spinach
Treatments Number of inflorescence
per plant
Inflorescence length (cm)
Seeds per inflorescence
P0 4.94 20.58 39.13
P1 6.26 24.12 48.19
P2 7.80 28.43 57.19
P3 7.64 28.97 56.15
LSD 0.48 1.85 3.39
CV % 8.48 8.73 8.12
Here, P0= 0 kg/ha; P1= 15.84 kg/ha; P2= 31.68 kg/ha; P3= 47.52 kg/ha.
Table 7. Combined effect of nitrogen and phosphoruson number of inflorescence per plant, inflorescence length and seeds per inflorescenceof spinach
Treatments Number of inflorescence per
plant
Inflorescence length (cm)
Seeds per inflorescence
N0 P0 3.9 15.19 28.03
N0P1 5.03 18.95 35.33
N0P2 5.70 21.86 43.82
N0P3 6.06 23.96 45.43
N1 P0 5.08 19.91 36.27
N1 P1 6.23 22.91 47.79
N1 P2 6.75 24.72 51.74
N1 P3 7.15 26.69 53.70
N2 P0 5.23 22.84 45.25
N2 P1 7.05 26.15 54.29
N2 P2 10.53 35.04 70.41
N2 P3 9.31 34.15 65.48
N3 P0 5.55 24.38 47.00
N3 P1 6.73 28.48 55.34
N3 P2 8.21 32.10 62.80
N3 P3 8.03 31.10 60.00
LSD 0.94 3.71 6.79
CV (%) 8.48 8.73 8.12
Here, N0= 0 kg/ha; N1=27.6 kg/ha; N2= 55.2 kg/ha; N3= 82.8 kg/ha.
P0= 0 kg/ha; P1= 15.84 kg/ha; P2= 31.68 kg/ha; P3= 47.52 kg/ha.
3.7 1000 Seed Weight (g)
Statistically significant differences were found for 1000 seed weight of spinach due to the nitrogen level (Table 8). The maximum 1000 seed weight (10.19 g) was recorded from N2 and the lowest
(9.24 g) was recorded from N0. The maximum
1000 seed weight (10.20 g) was recorded from P2 and the lowest (9.23 g) was recorded
from P0 (Table 9). The combined effect of
10). The highest 1000 seed weight (11.06 g) was recorded from the combination of N2P2 and the
lowest (8.77 g) from N0P0.
3.8 Germination Percentage
A significant difference was found on
germination % due to fertilizer level (Table 8). The maximum germination percentage (87.33%)
was recorded from N2 and the minimum
(79.33%) was found in N0. Zaki and Halawa [15]
reported that seed yield and its quality of spinach obtained that increasing the rate of nitrogen levels up to the levels at 60 kg N produced higher seed yield with the best quality, germination percentage and germination rate. The maximum germination percentage (87.08%)
was recorded from P3 and the minimum
(79.91%) was found from P0 (Table 9).
The combined effect of nitrogen and phosphorus was significant on the germination percentage of spinach (Table 10). The highest germination percentage (91.33%) was recorded from the combination of N2P2 and the lowest germination
percentage (72.66%) was recorded in N0P0
(control). Ambia et al. [14] experimented on the
farm of the Department of Horticulture,
BSMRAU, Salna, Gazipur on 6 spinach genotypes to observe their seed production potentiality and to evaluate the quality of produced seed. They reported that the quality test of seed was done based on germination test
(%), seed vigor test (Electrical conductivity), moisture test (%) and thousand seed weight (g) of seeds.
3.9 Electrical Conductivity Test
A significant difference was found in electrical conductivity test value due to the application of different levels of nitrogen (Table 8). The highest EC test value (13.87 dS/cm) was recorded from
treatment N0 whereas, the minimum (11.16
dS/cm) was found in N2. The maximum EC test
value (13.35 dS/cm) was recorded from treatment P0 and the lowest EC test value (11.79
dS/cm) was recorded in P2 (Table 9).The
combined effect of nitrogen and phosphorus was significant on the EC test value of spinach (Table 10). The highest EC test value (14.83 dS/cm) was recorded from the combination (N0P0) and
the lowest EC test value (10.20 dS/cm) was recorded with N2P2 treatment combination. Why
highest in N2P2 and not N3P3.
3.10 Benefit Cost Ratio (BCR)
The combination of nitrogen and phosphorus showed different benefit cost ratio. The highest benefit cost ratio (1.59) which is economically more benefitted was obtained from N2P2 and the
lowest benefit cost ratio (1.01) which is economically less benefitted was obtained from the treatment combination of N0P0 (Table 11).
Table 8. Effect of nitrogen on seed yield per hectare 1000 seed weight, germination percentage and electrical conductivity test
Treatments Seed yield per
hectare (t)
1000 seed weight (g)
Germination (%)
Electrical conductivity test (ds/cm)
N0 0.81 9.24 79.33 13.87
N1 0.91 9.58 83.41 12.78
N2 1.10 10.19 87.33 11.16
N3 1.01 10.14 87.25 11.73
LSD 0.06 0.75 4.95 0.85
CV (%) 8.28 9.19 7.05 8.25
Table 9. Effect of phosphorus on seed yield per hectare, 1000 seed weight, germination percentage and electrical conductivity test
Treatments Seed yield per hectare (t)
1000 seed weight (g)
Germination (%)
Electrical conductivity test (ds/cm)
P0 0.84 c 9.23 b 79.91 13.35
P1 0.93 b 9.56 ab 83.75 12.57
P2 1.05 a 10.20 a 86.58 11.79
P3 1.01 a 10.18 a 87.08 11.81
LSD 0.067 0.75 4.95 0.85
CV (%) 8.28 9.19 7.05 8.25
Table 10. The combined effect of nitrogen and phosphorus seed yield per hectare, 1000 seed weight, germination percentage and electrical conductivity test
Treatments Seed yield per
hectare (t)
1000 seed weight (g)
Germination (%)
Electrical conductivity test (ds/cm)
N0P0 0.69 8.77 72.66 14.83
N0P1 0.83 9.22 80.00 13.97
N0P2 0.85 9.43 81.00 13.37
N0P3 0.88 9.56 83.66 13.30
N1 P0 0.83 9.15 79.00 13.55
N1 P1 0.91 9.47 84.00 12.85
N1 P2 0.95 9.76 84.66 12.58
N1 P3 0.96 9.95 86.00 12.14
N2 P0 0.93 9.26 83.33 12.59
N2 P1 0.99 9.74 84.66 11.46
N2 P2 1.30 11.06 91.33 10.20
N2 P3 1.16 10.70 90.00 10.42
N3 P0 0.92 9.73 84.66 12.45
N3 P1 0.98 9.80 86.33 12.01
N3 P2 1.09 10.53 89.33 11.03
N3 P3 1.04 10.50 88.66 11.41
LSD 0.13 1.50 9.91 1.70
CV (%) 8.28 9.19 7.05 8.25
Here, N0= 0 kg/ha; N1=27.6 kg/ha; N2= 55.2 kg/ha; N3= 82.8 kg/ha.
P0= 0 kg/ha; P1= 15.84 kg/ha; P2= 31.68 kg/ha; P3= 47.52 kg/ha.
Table 11. Cost and return analysis of spinach seed considering nitrogen and phosphorus
Treatments Seed yield
(t/ha)
Gross return (Tk/ha)
Total cost of production(Tk)
Net return (Tk/ha)
Benefit cost ratio (BCR)
N0P0 0.69 117000 116656.8 13156 1.01
N0 P1 0.83 124500 118342 6158 1.05
N0 P2 0.85 127500 120027.3 7472.7 1.06
N0 P3 0.88 132000 121712.5 10287.5 1.08
N1 P0 0.83 124500 117870.1 6629.9 1.05
N1 P1 0.91 136500 119555.4 16944.6 1.14
N1 P2 0.95 142500 121240.6 21259.4 1.17
N1 P3 0.96 144000 122925.9 21074.1 1.17
N2 P0 0.93 133500 119083.5 14416.5 1.12
N2 P1 0.99 148500 120768.8 27731.2 1.22
N2 P2 1.30 195000 122454 72546 1.59
N2 P3 1.16 174000 124139.3 49860.7 1.40
N3 P0 0.92 138000 120296.9 17703.1 1.14
N3 P1 0.98 147000 121982.1 25017.9 1.20
N3 P2 1.09 163500 123667.4 39832.6 1.32
N3 P3 1.04 156000 125352.6 30647.4 1.24
Here,
Sale of marketable seed @ Tk.150/kg
Gross return = Marketable yield x Tk./kg
Net income = Gross return-Total cost of production
BCR = Gross return ÷ cost of production
4. CONCLUSION
Both seed yield and economic benefit of crop are important for the seed production. Application of nitrogen (55.2 kg/ha) represents higher seed
The combined effect of nitrogen and phosphorus had positive effect on morphological characters, yield contributing characters but seed yield and seed quality of spinach increased by the combined application of (N 55.2 kg/ha+ P 31.68 kg/ha). On the basis of benefit cost ratio, it may be suggested that application of N 55.2 kg/ha with P 31.68 kg/ha combination seemed to be more suitable for the highest values of gross return, net return as well as highest beneficial cost ratio of spinach..
COMPETING INTERESTS
The authors have declared that no competing interests exist.
REFERENCES
1. George RAT. Vegetable seed production.
New York, America. 1985;318.
2. BBS. Year book of Agricultural statistics of
Bangladesh. 2016 28th Ed. Bangladesh
Bureau of statistics. Statistics Division, Ministry of planning. Govt. of the people Republic of Bangladesh. 2016;204.
3. Anonymous. Requirement and supply of
seeds. Report of a task force, Ministry of Agriculture, Government of the Peoples Republic of Bangladesh, Dhaka. 1995;284.
4. Milford GFJ, Armstrong MJ, Jarvis PJ,
Houghton BJ, Bellett DM, Jones J, Leigh RA. Effects of potassium fertilizer on the yield, quality and potassium offtake of sugar beet crops grown on soils of different potassium status. J. Agric. Sci. 2000;135: 1-10.
5. Eckert D. Efficient fertilizer use of nitrogen. John Willy and Sons, New York, America. 2010;1-19.
6. Griffith B. Efficient fertilizer use-
phosphorus. McMillan Co. Amsterdam, Netherland. 2010;1-7.
7. Cantliffe D. Nitrate accumulation in
vegetable crops as affected by photoperiod and light duration (beets, radish, spinach, beans). J. Am. Soc. Hort. Sci. 1992;97: 414-418.
8. Jaworska G. Content of nitrates, nitrites, and oxalates in New Zealand spinach. Food Chem. 2005;89:235-242.
9. Canali S, Montemurro F, Tittarelli F,
Masetti O. Effect of nitrogen fertilization reduction on yield, quality and N utilization of processing spinach. J. Food. Agric.
Environ. 2008;6(3&4):242-247.
10. Wang ZH, Zong ZQ, Li SX, Chen BM.
Nitrate accumulation in vegetables and its residual in vegetable fields. Environ. Sci. 2002;23(11):79-83.
11. Fadaly KA, Mishriky JF. Effect of nitrogen sources and levels on growth, yield and mineral composition of spinach. Bulletin of Faculty of Agriculture, University of Cairo. 2000;41(3):973-988.
12. Assiouty MM, Sedera SA, Giza D. Effect of
bio and chemical fertilizers on seed production and quality of spinach. Int. J. Agril. Biol.2005;7(6):947–952.
13. Boroujerdnia M. Ansari NA .Effect of
different levels of nitrogen fertilizer and cultivars on growth, yield and yield components of Romaine Lettuce (Lactuca sativa L.). Middle Eastern and Russian J. Plant. Sci. Biotech. 2007;1(2):47-53. 14. Ambia K, Hossain M, Haque M, Mosiur A,
Halder C, Krisna S. Evaluation seed yield and quality of different genotypes of spinach (Beta vulgaris). Sci. Agri. 2016; 16(2):61-66.
15. Zaki MS, Halawa SS. Effect of nitrogen
fertilizer and growth stimulants on
flowering behavior, seed yield and its quality of spinach. Annal. Agric. Sci. 2016;54(2):345-354.
_________________________________________________________________________________ © 2019 Islam et al.; This is an Open Access article distributed under the terms of the Creative Commons Attribution License (http://creativecommons.org/licenses/by/4.0), which permits unrestricted use, distribution, and reproduction in any medium, provided the original work is properly cited.
Peer-review history: