The Stationary Subspace Analysis Toolbox
Jan Saputra M ¨uller [email protected]
Paul von B ¨unau [email protected]
Frank C. Meinecke [email protected]
Franz J. Kir´aly [email protected]
Klaus-Robert M ¨uller [email protected]
Machine Learning Group Department of Computer Science
Berlin Institute of Technology (TU Berlin) Franklinstr. 28/29, 10587 Berlin, Germany
Editor: Cheng Soon Ong
Abstract
The Stationary Subspace Analysis (SSA) algorithm linearly factorizes a high-dimensional time se-ries into stationary and non-stationary components. The SSA Toolbox is a platform-independent efficient stand-alone implementation of the SSA algorithm with a graphical user interface written in Java, that can also be invoked from the command line and from Matlab. The graphical inter-face guides the user through the whole process; data can be imported and exported from comma separated values (CSV) and Matlab’s.matfiles.
Keywords: non-stationarities, blind source separation, dimensionality reduction, unsupervised learning
1. Introduction
Discovering and understanding temporal changes in high-dimensional time series is a central task in data analysis. In particular, when the observed data is a mixture of latent factors that cannot be measured directly, visual inspection of multivariate time series is not informative to discern stationary and non-stationary contributions. For example, a single non-stationary factor can be spread out among all channels and make the whole data appear non-stationary, even when all other sources are perfectly stationary. Conversely, a non-stationary component with low power can remain hidden among stronger stationary sources. In electroencephalography (EEG) analysis (Niedermeyer and Lopes da Silva, 2005), for instance, the electrodes on the scalp record a mixture of the activity from a multitude of sources located inside the brain, which we cannot measure individually with non-invasive methods. Thus, in order to distinguish the activity of stationary and non-stationary brain sources, we need to separate their contributions in the measured EEG signals (von B¨unau et al., 2010).
To that end, in the Stationary Subspace Analysis (SSA) model (von B¨unau et al., 2009), the observed data x(t)∈RDis assumed to be generated as a linear mixture of d stationary sources ss
(t) and D−d non-stationary sources sn
(t),
x(t) =As(t) =
As An
ss
(t)
sn
(t)
where A is an invertible mixing matrix. Note that the sources s(t)are not assumed to be independent or uncorrelated. A time series is considered stationary if its mean and covariance are constant over time, that is, a time series u(t)is called stationary if
E[u(t1)] =E[u(t2)] and E[u(t1)u(t1)⊤] =E[u(t2)u(t2)⊤],
at all pairs of time points t1,t2≥0. This is a variant of weak stationarity (Priestley, 1983), where
we do not consider the time structure.
The SSA algorithm (von B¨unau et al., 2009; Hara et al., 2010; Kawanabe et al., 2011) finds the demixing matrix that separates the stationary and non-stationary sources given samples from x(t) by solving a non-convex optimization problem. This yields an estimate for the mixing matrix, and the stationary and non-stationary sources.
2. Capabilities of the SSA Toolbox
The SSA Toolbox is a platform-independent implementation of the SSA algorithm with a convenient graphical user interface. The latest release is available from the SSA website.1 It can be used in the following environments.
• As a stand-alone application with a graphical user interface.
• From the operating system’s command line.
• From Matlab via an efficient in-memory interface through the wrapper scriptssa.m.
• As a library from your Java own application.
In the following, we give an overview of the main features of the SSA Toolbox.
2.1 Platforms
The SSA Toolbox is platform-independent: it is written in the Java programming language with bytecode backwards-compatible until JVM version 1.5 (released in 2004); native libraries are in-cluded for all major platforms with a pure-Java fallback.
2.2 Data Import/Export
The stand-alone application can read data and write results from comma separated values (CSV) and from Matlab’s.matfile format.2
2.3 Efficiency
The efficiency of the toolbox is mainly due to the underlying matrix libraries. The user can choose betweenCOLT,3written in pure Java, and the high-performance library jblas4(Braun et al., 2010), which wraps the state-of-the-art BLAS and LAPACK implementations included as native binaries for Windows, Linux and MacOS in 32 and 64 bit.
1. Seehttp://www.stationary-subspace-analysis.org/toolbox.
2. We use theJMatIOlibrary, seehttp://sourceforge.net/projects/jmatio. 3. Seehttp://acs.lbl.gov/software/colt/.
Figure 1: Graphical user interface of the SSA Toolbox. From top to bottom, the panels correspond to the steps data import, parameter specification, and export of results. The window also includes a log panel at the bottom, which is not shown here.
2.4 User Interface
The graphical user interface of the stand-alone application provides step-by-step guidance through the whole process: from data import, specification of parameters to the export of results. The toolbox also suggests sensible parameter values based on heuristics. The log panel, not pictured in Figure 1, shows instructive error and diagnostic messages.
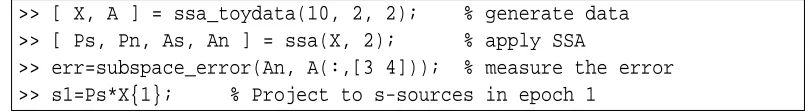
>> [ X, A ] = ssa_toydata(10, 2, 2); % generate data >> [ Ps, Pn, As, An ] = ssa(X, 2); % apply SSA
>> err=subspace_error(An, A(:,[3 4])); % measure the error >> s1=Ps*X{1}; % Project to s-sources in epoch 1
Figure 2: Application of the SSA Toolbox from within Matlab to a synthetic data set with two stationary and two non-stationary sources.
2.5 Matlab Interface
2.6 Documentation
The user manual explains the SSA algorithm, the use of the toolbox, interpretation of results and an-swers frequently asked questions. It also includes a section for developers that provides an overview of the source code and a description of the unit tests.
2.7 Examples
The toolbox comes with example data in CSV and .mat format, a Matlab script for generating synthetic data sets (documented in the manual, and a self-contained Matlab demossa demo.m).
2.8 Developer Access, License and Unit Tests
The source code is provided under the BSD license and is available in a separate archive for each released version. The latest version of the source code is available from github,5 a free hosting services for the git version control system. The source code is fully documented according to the Javadoc conventions and accompanied by a set of unit tests, which are described in the developer section of the user manual.
Acknowledgments
We acknowledge support by the Bernstein Cooperation (German Federal Ministry of Education and Science), FKZ 01 GQ 0711; the Bernstein Focus Neurotechnology and the EU PASCAL2 NoE.
References
Mikio Braun, Johannes Schaback, Jan Saputra Mueller, and Matthias Jugel. jblas, 2010. http: //mloss.org/software/view/180/.
Satoshi Hara, Yoshinobu Kawahara, Takashi Washio, and Paul von B¨unau. Stationary subspace analysis as a generalized eigenvalue problem. In Proceedings of the 17th International
Confer-ence on Neural Information Processing: Theory and Algorithms - Volume Part I, ICONIP’10,
pages 422–429, Berlin, Heidelberg, 2010. Springer-Verlag.
Motoaki Kawanabe, Wojciech Samek, Paul von B¨unau, and Frank Meinecke. An information geo-metrical view of stationary subspace analysis. In Artificial Neural Networks and Machine
Learn-ing ICANN 2011, volume 6792 of Lecture Notes in Computer Science, pages 397–404. SprLearn-inger
Berlin / Heidelberg, 2011. URLhttp://dx.doi.org/10.1007/978-3-642-21738-8_51.
Ernst Niedermeyer and Feranando H. Lopes da Silva. Electroencephalography: Basic Principles,
Clinical Applications, and Related Fields. Lippincott, Williams and Wilkins, 530 Walnut Street,
Philadephia, PA 19106 USA, 2005.
Maurice B. Priestley. Spectral Analysis and Time Series. Academic Press, 1983.
Paul von B¨unau, Frank C. Meinecke, Franz J. Kir´aly, and Klaus-Robert M¨uller. Finding stationary subspaces in multivariate time series. Phys. Rev. Lett., 103(21):214101, Nov 2009. doi: 10.1103/ PhysRevLett.103.214101.