INTRODUCTION
The importance of Non-linear optical (NLO) materials is that they are required in the field of opto-electronics for frequency conversion, optical modulation and optical switching. To date, several thousand non-linear crystals and their related isomorphs have been developed. But characteristics such as transparency, phase matching, high optical quality, and availability in bulk form are necessary for them to serve as good NLO materials. Organic NLO materials have been studied extensively for second harmonic generation, but the growth of these crystals and also cutting and polishing is difficult. Hence much attention has been given to semi-organic NLO materials. The advantage of semi-organic materials is that the crystals can be grown from aqueous solutions and they can be easily cut and polished. The phthalic acid derivatives, when grown into crystals are potential candidates for NLO and electro-optic applications. Potassium acid phthalate (KAP) is one of the important NLO crystals in the phthalic acid family. KAP crystal is
Materials Science Research india Vol. 4(1), 127-135 (2007)
Effect of divalent metal ions on the structure, optical and
mechanical properties of KAP single crystals
K. UTHAYARANI
1, R. SANKAR
2and C.K. SHASHIDHARAN NAIR
31Department of Physics, Sri Ramakrishna Engineering College, Coimbatore - 641 022 (India) 2Crystal Growth Centre, Anna University, Chennai - 600 025 (India)
3*Department of Physics, PSG College of Technology, Coimbatore - 641 004 (India) (Received: March 03, 2007; Accepted: April 14, 2007)
ABSTRACT
Single crystals of potassium acid phthalate (KAP), Nickel Doped KAP (NiKAP) and Cobalt doped KAP(Co KAP) have been grown from aqueous solutions by solvent evaporation method. The effect of these metal irons on surface morphology, structure, optical and mechanical properties have been studied. Single crystal XRD studies of these crystals confirm that both the added impurities have modified the structure of the KAP crystals in a similar manner. The presence of dopants in the crystal lattice have been further confirmed by FTIR analysis. The stoichiometric composition of both the doped crystals have been studied using EDAX analysis. Optical absorbance was carried out for all the crystals. The absorbance in the visible region observed in both the doped crystals was assigned to their d-d transitions. Micro hardness of the pure and doped crystals were found using Vickers’s Hardness Technique.
Key words: Solution growth, KAP, Impurities, Semi-organic.
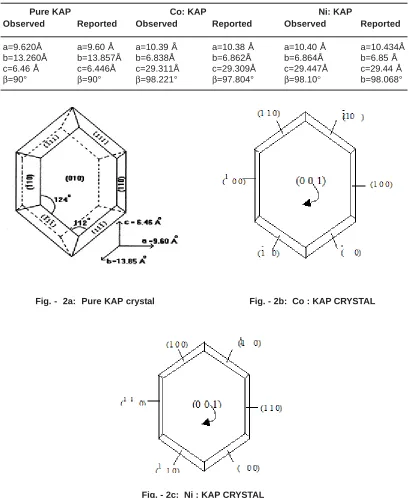
an orthorhombic system, space group= Pca21 with unit cell parameters a = 9.609Å, b = 13.857Å, c = 6.446Å1,2. It has one perfect (0 1 0) cleavage plane and its cleavage faces find applications as substrates in epitaxial techniques. Hence, KAP cr ystals, besides application in soft X-ray spectroscopy, are used as substrates for the growth of highly oriented films of conjugated polymers with high non-linear optical susceptibility3.For a long time researchers have been interested in the influence of impurities on crystal growth kinetics and crystal morphology. This is due to the fact that additives can change the crystallization process drastically. It has been reported that organic additives, differing in their chemical behaviour, affect growth rates of different faces of KAP and KDP crystals4,5. The surface morphology in the presence of inorganic impurities has also been reported6-9.
trivalent metal ions like Fe3+ and Cr3+ ions on the structure, optical and electro-optical properties of KAP crystals were studied and reported10. The structure of cobalt and nickel doped KAP was reported earlier11,12. In this present work, influence of divalent metal ions such as cobalt (Co2+) and nickel (Ni2+) on the mor phology and optical properties of KAP crystals is carried out and reported.
Crystal Growth Pure KAP crystal
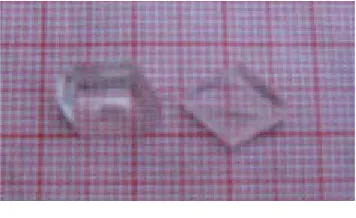
All the chemicals used for the present experiment were of analar grade, supplied by E-Merck. Saturated solutions of KAP was prepared in double distilled water and was filtered using whatman filter paper. The filtered solution was transferred into a crystallization dish of 100 mm diameter and 50 mm height. The dish was covered with perforated covers. Tiny crystals were seen within 2 days. Crystallization completed in about 3 weeks. Pure KAP cr ystals grown from slow evaporation technique are shown in fig(1a).
dimension 20mmx15mmx5mm was observed. At this concentration, when the size of the crystal was big, 2 or 3 crystals only formed. But when more no. of crystal was formed, the size reduced. Few cobalt doped KAP crystals are shown in the Fig (1b).
Co2+ doped KAP crystals
Cobalt doped KAP crystals were grown by dissolving 0.02M - 0.1M CoCl2 in KAP solution and the solution was filtered and transferred into a crystallization dish of 100 mm diameter and 50 mm height. The dish was covered with perforated covers. Tiny crystals were seen within 2 days. It was observed that for lower concentrations such as 0.02M and 0.04M crystals of pink colour and colorless were observed in the same dish. For the concentration of 0.1M CoCl2, pink crystal of
Characterization
The grown crystals were characterized by single crystal XRD, FTIR spectroscopy, UV-Visible spectroscopy, EDAX, AAS, thermal analysis, dielectric studies, birefringence, SHG, hardness and etching studies.
Single crystal XRD study
Single crystal XRD was carried out in ENRAF Nonius CAD4 diffractometer using a MoKaradiation. KAP, cobalt and nickel doped KAP specimens of Fig. -1a: KAP crystal grown from slow
evaporation technique
Fig. -1b: Cobalt doped KAP crystals
Ni2+ doped KAP crystals
For nickel doping, nickel was taken in the form of NiCl2. But the crystals formed were not of good size. Hence NiSO4 was used. The concentration of nickel was also varied from 0.02M - 0.1M. It was observed that for the concentration 0.08M NiSO4, crystals of 15mmx12mmx4mm size was obtained [Fig(1c)]. For other concentrations crystals of smaller size were obtained.
Fig. - 2a: Pure KAP crystal Fig. - 2b: Co : KAP CRYSTAL
Fig. - 2c: Ni : KAP CRYSTAL
Table -1: Single crystal X-ray diffraction data
Pure KAP Co: KAP Ni: KAP
Observed Reported Observed Reported Observed Reported
a=9.620Å a=9.60 Å a=10.39 Å a=10.38 Å a=10.40 Å a=10.434Å
b=13.260Å b=13.857Å b=6.838Å b=6.862Å b=6.864Å b=6.85 Å
c=6.46 Å c=6.446Å c=29.311Å c=29.309Å c=29.447Å c=29.44 Å
β=90° β=90° β=98.221° β=97.804° β=98.10° b=98.068°
dimensions 0.17x0.21x0.33 mm3 cut from the as grown crystals were used. Least square refinement of 25 reflections were done in the range 20 – 30º. Results of single crystal X-ray diffraction is given in table 1. The lattice parameters of the pure and doped KAP crystals were found to be in good
agreement with repor ted values [5,11,12]. The schematic morphology diagrams for the pure and doped KAP crystals are shown in fig 2a, 2b and 2c. There is significant departure from that of pure KAP[13].
Fig. - 3: EDAX spectra of KAP
Fig. - 3b : EDAX spectra of Co:KAP
Energy Dispersive Analysis by X-ray Diffraction (EDAX) and Atomic Absorption Spectroscopic analysis (AAS)
The energy dispersive X-ray diffraction was carried out in IWCA 200 system connected to a LEO – stereo scan 440 scanning electron microscope. EDAX spectra of KAP, Co: KAP, Ni: KAP are shown in Fig.3a, 3b and 3c respectively. The atomic percentage of metals in each crystal is indicated in table 2. The level of Co and Ni doping in KAP is observed to be nearly equal. This reveals that KAP has nearly the same driving force to take in either Co or Ni in the same quantities in the crystal lattice. This appears to be true, because the
phthalate ion is not making any direct bonding interaction with either cobalt or nickel. This is also evident from the report[11], who reported the X-ray crystal structures of nickel doped KAP crystal. In both the crystals, the phthalate ion is seen to interact with water present in the coordination sphere of the metals. Since cobalt can also accommodate six water molecules in its coordination sphere like nickel, Co:KAP crystal structure is also expected to be same as that of Ni:KAP. In line with our view, as discussed in the XRD analysis, the structure of Co:KAP is same as that of Ni:KAP. Hence within the lattice both cobalt and nickel in their crystals are expected to have same level of bonding interaction in order to provide the same crystal structure, with the same unit cell constants. The binding energy value close to 8 KeV for both cobalt and nickel illustrates two chemical status for both; it could be assigned to metals buried in the bulk portion of the crystal and those close to the surface. The atomic absorption spectroscopic studies were carried out to confirm the incorporation of Ni2+ and Co2+ dopants.
Table - 2
Element weight (%) Atomic (%)
Pure KAP KK 100% 100%
Co:KAP KK 96.06 96.99
Cok 3.94 3.01
Ni:KAP KK 95.79 96.73
NiK 4.21 3.27
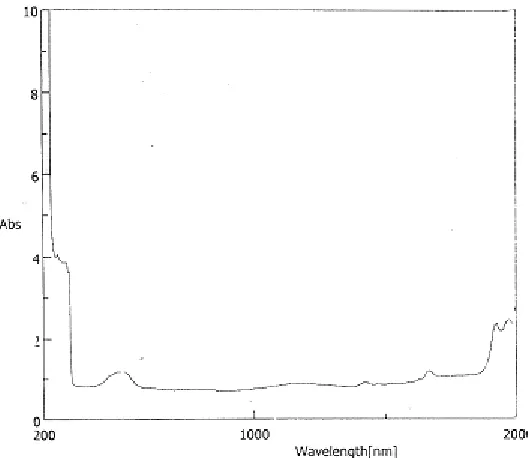
Fig. - 4a: Absorption spectrum of Ni:KAP crystals
UV-Visible spectral analysis
Linear optical properties of the crystals were studied using a Shimadzu UV-Visible spectrophotometer. The UV-visible spectral analysis of KAP, cobalt doped and nickel doped KAP crystals were carried out covering the ultraviolet, visible and near IR regions. The plot of wavelength against absorbance for Co:KAP and Ni:KAP are presented in Fig. 4a and 4b respectively. There are absorption bands below 750 nm in all the spectra, which are assigned to overtones, and combination bands. In
the visible region no absorbance is observed for KAP but in the spectrum of Co:KAP, there is an absorbance maximum close to 400nm. Similarly Ni:KAP shows broad absorbance maximum between 500-750nm. The absorbance in the visible region in both cobalt and nickel doped KAP is assigned to their d-d transitions. The absorbance in Co:KAP is assigned to
4
T1g(
F
)
→
4
T1g(
P
)
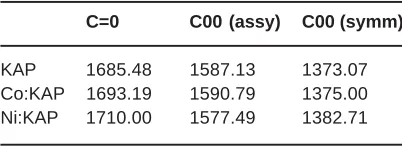
transitions. It matches with the electronic transition in [Co(H2O) 6]2+.Table - 3: Infrared group vibrations C=0 C00 (assy) C00 (symm) KAP 1685.48 1587.13 1373.07 Co:KAP 1693.19 1590.79 1375.00 Ni:KAP 1710.00 1577.49 1382.71
Hence this observation confirms the presence of six water molecules around cobalt in conjunction with XRD analysis as reported by[12].
Generally [Ni[H2O]6]2+ shows three absorption bands due to
3 A2g → 3 T2g 1125 nm
3 A2g → 3 T1g(F) 700 nm 3 A2g → 3 T1g(P) 300 nm transitions14. Similar absorption bands are also noted in the spectrum of Ni:KAP. Hence Ni might
also have six water molecules around its coordination sphere11. The recorded spectrum of Co:KAP shows that the cr ystals show good transmission in the entire visible region. The lower cut-off lies below 300 nm in the ultraviolet (UV) region.
Fourier transform infrared analysis
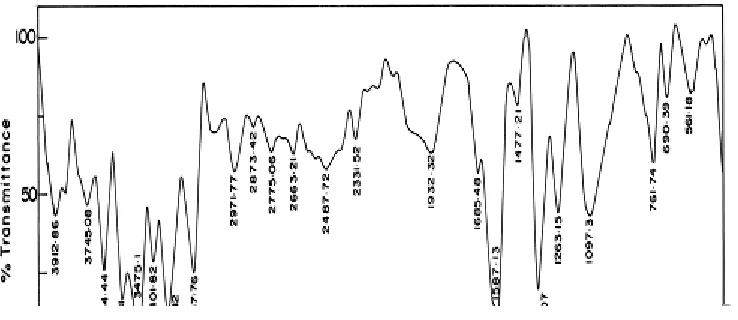
The FTIR spectra of the samples were recorded in the range 400-4000 cm-1 employing a Perking-Elmer spectrometer by KBr pellet method. The middle FT-IR spectrum of KAP is shown in Fig (5a). In the higher energy region between
3100-Fig. - 5b: FT-IR spectrum of Ni2+ doped KAP crystals
4000 cm-1, there are resolved peaks due to O-H stretch of COOH group of potassium acid phthalate and water. The aromatic C-H stretching vibration appears just above 3000 cm-1. The bands between 2500 cm-1 and 3000 cm-1 are the additional fine structure bands due to hydrogen bonding interaction of COOH group. The peaks between 2000 cm-1 and 2500 cm-1 are due to overtones and combination
bands. The C=0 stretch appears to be partly resolved at 1685.48 cm-1. The asymmetric and symmetric C-O-O stretching vibrations appear at 1587.13 cm-1 and 1373.07 cm-1. The aromatic ring C-H bend occurs at 761.7 cm-1. The aromatic ring skeletal vibrations are not well resolved due to its overlapping with asymmetric C-O-O stretching vibrations.
stretching vibrations in the higher energy region are clearly distinct, the COOH group is to be bonded to cobalt without deprotonation. It is also evident from the molecular packing diagram of the unit cell12.
The middle FT-IR spectrum of Ni:KAP is shown in Fig. 5c. It also carries features same as Fig. 11 and 12. Similar to Co (II) doped KAP, this crystal also shows bonding of the carboxyl group to nickel as there is distinct shifting of peak positions due to C=0 and carboxyl groupings as shown in Table 3.The C=0 stretching appears at 1685.48 cm -1, for the parent KAP. But it is shifted to 1693.19 cm -1 and 1710 cm-1 for Co (II) and Ni (II) doped crystals respectively. Hence this shifting is a clear indication
temperature (300 K) using a Leitz Wetzlar hardness tester fitted with a Vickers’s pyramidal indenter. Loads of different magnitude 5, 10, 35 and 50 g were applied over a fixed inter val of time. Indentations were made at different sites on the crystal surface. Vickers’s micro hardness values were calculated from the formula
Hv = 1.8544 (P/d2) kg/mm2
where Hv is the Vickers’s micro hardness number in kg/mm2, P is the applied load in g and d is the average diagonal length in mm. In pure KAP it was observed that the hardness decreases at lower loads and saturates for a load of 50g. These
Fig. - 5c. FT-IR spectrum of Co2+:KAP crystals
Fig. -6
for the coordination of C-O-O with the metal. In the absence of metal coordination there is much electron delocalization in the C-O-O grouping, and hence the strength of C=0 group gets decreased. But when the carboxyl group is bonded to Co (II) the strength of C=0 bond is increased due to less electron delocalization and hence the C=0 stretching frequencies of both the metal containing crystals are shifted to higher values.
Vickers’s Hardness studies
results can be attributed to the work hardening of the surface layers. Above 50g load cracks were formed due to the release of internal stress generated locally by indentation. Metal ion doped KAP showed lower hardness values than the pure crystals, which may be due to the decrease in bond energy due to doping. The doped KAP crystals show cracking even at very low loads, as shown in the figure (6). The hardness values are
Hv for Co: KAP = 93 kg/mm2 Hv for Ni: KAP = 89.15 kg/mm2
CONCLUSIONS
The pure, cobalt doped and nickel doped crystals of KAP were grown by slow evaporation
method. The effect of these impurities on surface morphology, structure, optical, and mechanical proper ties have been studied. From the morphological studies, it is observed that there is significant effect of these impurities of the morphology. The crystallographic parameters were determined using single crystal XRD method. The presence of the dopants was confirmed by Atomic Absorption Spectroscopic studies and their nature inside the crystal studied using EDAX and FT-IR analysis. The above studies conclude that the impurities have gone into the crystal lattice and modified the morphology and structure of the KAP single crystals. The optical transmission is altered due to doping. Hardness of the material is decreased due to metal ion doping.
1. Y. Okaya, Acta Cryst., 19: 879 (1965). 2. L.A.M.J.Jetten, Ph.D. Thesis, University of
Nijemegan, (1983).
3. S.Timpanaro, A Sasella, A.Z.Bhorghesi, W.Porzio, P.Fontaine, M.Goldmann, Adv. Mater., 3 127 (2001).
4. V.A.Kuznetsov, T.M.Okhrimenko and M.Rak, Proc. SPIE, 3178, 100 (1997).
5. V.A.Kuznetzov, T.M.Okhrimenko and M.Rak, J. Cryst. Growth, 193, 164 (1998).
6. M.H.J.Hottenhuis and C.B.Lucasius, J. Cryst. Growth, 623 (1988).
7. M.H.J.Hottenhuis and C.B.Lucasius, J. Cryst. Growth, 78, 379 (1986).
8. M.H.J.Hottenhuis and Oudenampsen, J. Cryst. Growth, 92, 513 (1988).
REFERENCES
9. M.H.J.Hottenhuis and C.B.Lucasius, J. Cryst. Growth, 94, 708 (1989).
10. N. Kejalakshmy, K. Srinivasan, Optical Materials, 27 (2004), 389-394.
11. Biagni Cingi, M., Manotti Lanfredi, A.M. Tiripicchio, A. Acta Cryst. C40, 56-58 (1984). 12. Furmanova, N.G., Eremina T.A., Okhimenko T.M, Kuznetsov V.A., Cryst. Repet, (2000), 45, 842-845.
13. A.V.Alex and J. Philip, J. Appl. Phys. 88, 5 (2000).
14. R.Jayavel, R.Dhanasekaran, P.Ramasamy, J. Cryst. Growth, 207 325-329 (1999). 15. F.A. Cotton, G.Wilkinson, Advanced
Inorganic Chemistry, Wiley Eastern Pvt. Ltd., New Delhi, (1972).


![Localizing toponyms in topographic map titles (Repérer des toponymes dans des titres de cartes topographiques) [in French]](data:image/gif;base64,R0lGODlhAQABAIAAAP///wAAACH5BAEAAAAALAAAAAABAAEAAAICRAEAOw==)