Published online November 30, 2013 (http://www.sciencepublishinggroup.com/j/jeee) doi: 10.11648/j.jeee.20130105.12
Analytical surface charge control model for
AlN/GaN/AlGaN double heterojunction field-effect
transistor
Md Shofiqul Islam Khan
Department of Electrical and Electronic Engineering, Bangladesh University of Engineering and Technology (BUET), Bangladesh
Email address:
To cite this article:
Md Shofiqul Islam Khan. Analytical Surface Charge Control Model for AlN/GaN/AlGaN Double Heterojunction Field-Effect Transistor.
Journal of Electrical and Electronic Engineering. Vol. 1, No. 5, 2013, pp. 114-122. doi: 10.11648/j.jeee.20130105.12
Abstract:
We have argued that the nature of surface potential variation with gate voltage of AlN/GaN/AlGaN Double Heterojunction Field Effect Transistor (DHFET) is no different from that of the conventional GaAs/AlGaAs HEMT devices. Necessary simulated band diagrams have been presented to justify our claim and we have also proposed a non-linear expression for Fermi level (EF) variation with the two-dimensional electron gas density (2DEG). We have showed that our proposed expression provides better agreement with the numerical solution than the previous approximations. Besides, expression of surface charge density (ns) variation with gate voltage (VG) obtained using our proposed model, shows better fit with the numerical simulation data in wide range of bias conditions.Keywords:
AlN/GaN/AlGaN DHFET, Double Heterojunction, Analytical Charge Control Model, 2DEG, Fermi Level1. Introduction
With the increasing requirements for millimeter-wave amplifiers in wireless communication systems and radars has induced innovative developments in solid-state device structures, one emerging area of which had been gallium nitride (GaN)-based field-effect transistors. AlGaN/GaN high-electron mobility transistors (HEMTs) have been established as the best candidate for microwave power applications not only because of their wide bandgap and large polarization charge enabling high carrier densities but also excellent thermal dissipation [1]. High current density and high breakdown voltage are the demands of high frequency power switching devices which we cannot achieve if we intend to reduce device dimension, decreasing the commonly used AlGaN barrier thickness below 10 nm as it leads to a strong degradation of the 2DEG carrier concentration [2].
However, use of AlN substituting AlGaN as barrier layer is getting popularity nowadays for Al-rich barrier thickness is an efficient way to realize normally-off [3], [4] devices with the benefit of circuit simplicity and safety while maintaining a high polarization charge density [5]. Achievement of high-performance enhancement mode
Journal of Electrical and Electronic Engineering 2013; 1(5): 114-122 115
expression of EF versus ns is developed and a comparison between our results and numerical data is carried and good agreement over a wide range of bias conditions is obtained.
2. Device Structure and Simulation
Method
In this paper we have simulated the device structure described in [6], and calibrated our simulator in such a way that it produces similar transfer characteristics obtained experimentally in that article (see Fig. 1 (c)). Necessary numerical data is then extracted from the simulator and used to check the validity of our proposed analytical charge control model. Years of research into device physics have resulted in a mathematical model that operates on any semiconductor device [8]. This model consists of a set of fundamental equations, which link together the electrostatic potential and the carrier densities, within some simulation domain. These equations, which are solved inside any general purpose device simulator, have been derived from Maxwell’s laws and consist of Poisson’s Equation (1), the
continuity equations (2)-(3) and the transport equations (4)-(5).
(1)
(2)
(3)
! ln $% (4)
& & & ! ln $% (5)
where is the electrostatic potential, ' is the local permittivity, and ( is the local space charge density, and p are the electron and hole concentration, and are the electron and hole current densities, Gn and Gp are the generation rates for electrons and holes, Rn and Rp are the recombination rates for electrons and holes, nie is the effective intrinsic concentration and TL is the lattice temperature and q is the magnitude of the charge on an electron.
Fig 1. Conventional structure of (a) AlN/GaN/AlGaN DHFET and (b) AlGaAs/GaAs HEMT. (c) Transfer characteristics obtained from numerical simulation of DHFET device which fits the experimental data obtained in [6].
Poisson’s equation relates variations in electrostatic potential to local charge densities. The continuity and the transport equations describe the way that the electron and hole densities evolve as a result of transport processes, generation processes, and recombination processes.
In our simulator Poisson’s equation is solved along with the above mentioned current continuity equations for electrons and holes. The simplest Drift-Diffusion Model for charge transport has been used for this model has the attractive feature that it does not introduce any independent variables in addition to ψ, n and p. In case of GaN power device simulation another critical issue that had to be considered was strong polarization effect in AlN/GaN interface. For calculating strain and polarization in AlN/GaN interface the parameters as listed in [9] were used. Parameter values and scaling factors have been modified within reasonable range to obtain better fit with experimental results. The average electric field in the DHFET channel is high, and thus, electron velocity saturation effects are becoming important. The optical phonon energy in GaN is large (92 meV) due to a strong bond and a small Nitrogen atomic mass, as a result of
which, the velocity-field dependence in the GaN DHFET channel is similar to that of conventional (GaAs) HEMTs. For that reason, Field-dependent mobility model [10] was chosen, which provides a smooth transition between low-field and high low-field behavior of electron. Moreover, Fermi-Dirac statistical model was incorporated as carrier model and Shockley-Read-Hall as recombination model [11]. The system of differential equations is solved self-consistently.
3. Discussion on Device Physics
simulation result (see Fig. 2), that similar zone division implies for the AlN/GaN/AlGaN DHFET also. For the purpose of developing charge control model, we are more interested in Intrinsic-FET-Zone behaviour. In this zone, the quantum well is modulated by the gate voltage togethe with drain voltage. At the source-side gate edge, low voltage leads to more electrons in the quantum well. At the drain-side gate edge, high voltage leads to fewer electrons
Fig. 2. Zone division illustrated over simulated electron density contour of an AlN/GaN/AlGaN DHFET working under (a) triode operatio saturation operation.
(a)
(c)
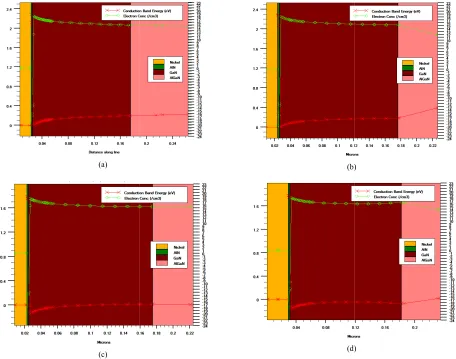
Fig. 3. Conduction band diagram and charge profile under (a) gate bias 0 V for 0% Al in AlGaN buffer (GaN buffer), (b) gate bias 0 V for 18% Al in AlGaN buffer, (c) gate bias 0.5 V for 0% Al in AlGaN buffer (GaN buffer), (d) gate bias 0.5 V for 18% Al in AlGaN buffer.
ig. 2), that similar zone division implies for the AlN/GaN/AlGaN DHFET also. For the purpose of developing charge control model, we are more Zone behaviour. In this zone, the quantum well is modulated by the gate voltage together side gate edge, low voltage leads to more electrons in the quantum well. At the side gate edge, high voltage leads to fewer electrons
in the quantum well. Gradual Channel approximation is valid under the gate region and when the device operates in saturation region IFZ under gate splits and SCL zone and CDZ zone emerges. Because of the geometry and gate length of our device under discussion, expansion of SCL zone is quite negligible as long as length of IFZ is concerned.
Zone division illustrated over simulated electron density contour of an AlN/GaN/AlGaN DHFET working under (a) triode operatio
(b)
(d)
ofile under (a) gate bias 0 V for 0% Al in AlGaN buffer (GaN buffer), (b) gate bias 0 V for 18% Al in AlGaN buffer, (c) gate bias 0.5 V for 0% Al in AlGaN buffer (GaN buffer), (d) gate bias 0.5 V for 18% Al in AlGaN buffer.
in the quantum well. Gradual Channel approximation is n and when the device operates in saturation region IFZ under gate splits and SCL zone and CDZ zone emerges. Because of the geometry and gate length of our device under discussion, expansion of SCL is quite negligible as long as length of IFZ is
Zone division illustrated over simulated electron density contour of an AlN/GaN/AlGaN DHFET working under (a) triode operation and (b)
(b)
(d)
Journal of Electrical and Electronic Engineering 2013; 1(5): 114-122 117
As for now we have ensured that the region beneath the gate shows the behaviour similar to an intrinsic FET which consists of epitaxial layers of AlN, GaN and AlGaN, we intend to bring the fact in light that there is a great similarity in between the charge control mechanism of this IFZ and traditional HEMT. The basic structure for a high electron mobility transistor (HEMT) consists of two layers in which the material with the wider bandgap energy (in this case AlN) is doped and that with the narrow bandgap energy (in this case GaN) is undoped. Owing to the difference in the electron affinity of the two layers, the electrons of the ionized donors will transfer into the GaN to form a conducting layer. The potential well formed at the interface is usually narrow enough to have well defined quantized energy levels in the direction perpendicular to the heterointerface, and in many cases the electronic system can be treated as a two-dimensional electron gas (2DEG) as mentioned in [13]. But in reality, the source of 2DEG in heterointerface is polarization which reduce impurity scattering, increase carrier mobility and enhance other characters of the device [14]. In the DHFET structure thick Al0.18Ga0.82N buffer layer favors the electron channel confinement and enables enhancing the device breakdown voltage as compared to the commonly used GaN buffer [15].
Fig. 3, shows the conduction band diagrams and charge profile of the DHFET structure and of the conventional AlN/GaN HEMT in gate biased condition. As we have checked both of the devices in different bias conditions, no significant difference was observed in the nature of variation of 2DEG with gate bias. In case of conventional AlN/GaN HEMT, sheet charge density was a little fraction of a decade higher than that of the DHFET device. To maintain charge neutrality due to polarization in AlN, charge is accumulated in the AlN/GaN interface which comes from the GaN buffer. In the DHFET structure AlGaN is used as a buffer as a result, bulk GaN expansion is reduced causing reduction of 2DEG. But this reduction of 2DEG can easily be ignored for the GaN channel in DHFET device, because width of GaN in this device is good enough to supply charge required for polarization in AlN. DHFET structure is a promising concept for high-voltage device application due to their superior channel confinement enabling higher vertical breakdown voltage and reducing leakage current [16]. Finally, from this discussion we can assume that charge control mechanism for AlN/GaN/AlGaN DHFET will not be significantly different from that of the conventional HEMT charge control mechanism.
4. Model Description
Double heterojunction devices are becoming very promising candidates for high-speed and high-power applications. These devices offer advantages such as high breakdown voltage, high charge density, and good electron
mobility [16]. The formation of the 2-D electron gas (2DEG) in these devices is the heart of the device operation and has been studied in great detail in the literature. For accurate and fast simulation of circuits based on these devices, an analytical expression for 2DEG density ns is greatly important. To the best of our knowledge, none of the currently available literature on analytical models has specifically mentioned DHFET devices and most of the models for ns are primarily based on numerical calculations, semi-empirical model expressions, or simplifying approximations [17]–[23]. In this article we have argued and showed the similarity between DHFET and conventional HEMT surface charge control mechanism.
In 1982, Delagebeaudeuf first suggested that if we want to model the electron gas charge density at the interface, the simultaneous solution of the electrostatics equation in the wide band-gap semiconductor and the Schrodinger equation for the quantum well at the interface are needed. Through a triangular well approximation, and assuming two subbands in the GaAs, it can be shown that the carrier density ns is given by [24],
* ln +,1 exp 1256314 7 ,1 exp 1256318 79 (6)
where, D is the interface density of states, T is the temperature, EF is the Fermi level, :; <; *= >⁄ and
: < *= >⁄ are the positions of the first two allowed energy levels in the triangular well. An important limiting feature of this model was that the accuracy of the model is not so good because of Fermi-level variation with electron density in the quantum well was neglected in order to get an analytical style. From then on, a series of approximations for Fermi level EF with sheet carrier density ns were made and a number of expressions were proposed, and these expressions were helpful in the development of an improved analytical model for the HEMT. What is more, in the present papers, we can also find that the charge control model is also playing a very important role in the research of HEMTs. So, we will pay more attention to the research of charge control model. In this paper, we have proposed a new expression of ns versus EF, which is shown to be more accurate than others that proposed before from voltage ranging after subthreshold to high conduction. And we get a analytical charge control model for AlN/GaN/AlGaN DHFET based on our new expression on ns versus EF. For an AlN/GaN/AlGaN DHFET system, the solutions of our expression on ns versus VG are compared with that numerical data and shown to be in good agreement over a wide range of bias conditions.
4.1. Relation between Fermi Level and Surface Charge Density
voltage VG is developed. Necessary figures will be presented to illustrate the superiority of our model.
Since the early 1980s, various linear analytical models as well as non-linear expressions for Fermi level variation with 2DEG sheet charge density have been proposed in the area of device modeling. In 1982, Drummond et al. [25], proposed a linear approximation to model the EF versus ns relation. In the year 1988, Kola [26] putted forward a non-linear approximation which can be expressed as
:@ A A= * A> B= (7) For best fit with our data set, K1 = -0.0938, K2= 2.5348 × 10⁻⁸, and K3 = -0.25136. In the year 1988, Shey [27] and Ku [28] made another approximation and proposed the non-linear expression as
:@ :@; < = >B (8) Where EF0 = -0.0125 eV and < = 5.735 × 10⁻¹¹ eVm4/3. Unless the device is operated in the deep subthreshold region, this approximation is appropriate because in the subthreshold region quantization effect is not important as the potential well broadens notably and the subbands are closely spaced.
Particularly, in 1993, DasGupta [29] proposed a good non-linear approximation which can be expressed by:
:@ A A= * =B A> * (9) For better result we used values for K1= 0.1635, K2= -4.017×10⁻⁹ and K3= 4.722×10⁻⁶.
In 2002, Rashmi [30] deduced some approximate expression from equation (6) appropriating for different region of operation which obviously, is not convenient for application. Although the approximation has improved a lot, but all of above analytical expressions for EF versus ns have been proposed so far have disadvantages more or less, such as can not appropriate for a large range of values of ns, the results are not accurate enough for modeling and so on.
In our model, a new approximation for EF versus ns has been formulated and it can be expressed by the polynomial:
:@ A A= *= B= A> * (10) where K1, K2 and K3 are undetermined parameters. It is evident that EF has to be computed for three different values on ns to get the values of K1, K2 and K3. Through solving equation (6), we can have the following:
* ln C DEF= GH1 IJK L3JEKM N =
B
1OP (11)
where
Q exp R: S , U exp R; : S , V exp H * N
In our formulation, EF was calculated for ns= 7.84×10¹³, 8.43×10¹⁴ and 1.95×1015 cm-2, these particular values of ns
were chosen in order to cover the operation of the device after the subthreshold to high conduction. Here, we must notice that the interpolation point of our model can be chosen more freely but if we consider DasGupta’s model we need to choose selective points for better output. For these values of ns, we can get corresponding values of EF from eq. (6).
After rearranging equation (10), we can get that:
:@ A> = A A= = (12)
:@ A> = = A A= == (13)
:@ A> > = A A= = (14) Then, to solve the simultaneous equations (12)-(14), we can get that:
A> (15)
where
& :>= := >
= =
=
= = W :== :=
2 :> > : 2 := = : W >
= =
=
= =
when the value K3 is obtained, substituting the value of K3 in eqn. (12) and (13) we can easily solve them for K1 and K2. Finally, we can use eqs (7), (8), (9), (10) to figure the curves ns versus EF of all the models have been introduced above.
4.2. Analysis of Surface Charge Control
The DHFET device consists of a metal, AlN polarizer and barrier layer, undoped GaN channel, undoped AlGaN buffer layer grown on a silicon substrate. A two-dimensional electron gas is formed at the AlN/GaN interface due to spontaneous and piezoelectric polarization [31]. To fulfill the requirement of charge neutrality, negative charge carrier electron gas is induced in the interface of GaN channel which is equal to the positive polarization charge induced in AlN.
To obtain an exact charge control formulation of the 2DEG channel in DHFET structures, 1D Poisson’s equation and Schrodinger’s equation would need to be self-consistently solved in the low longitudinal field region with the applied gate-to-source bias VGS [21]. Expression for surface charge density:
* Y Z[ Z\]] :@ (16)
where ' is the permittivity, d is the total thickness of the AlN layer and Voff is the threshold voltage of the DHFET, given by:
Journal of Electrical and Electronic Engineering 2013; 1(5): 114-122 119
in which ^_ is the barrier of the Schottky gate, :` is the conduction band discontinuity at the heterojunction, and a is the polarization sheet charge density of heterojunction AlN/GaN/AlGaN. In our structures, we use a Ni Schottky barrier contact at the surface; for the physical properties of AlN and GaN in our calculations we used [32]. According to [9], polarization in AlN (wurtzite materials) is characterized by two components, spontaneous polarization, Psp, and piezoelectric polarization, Ppi. Therefore, the total polarization a is given by:
a b* b $ (18)
where
b$ 2c*c c; ; Rd>
e >
e>>d>>S
where e31 and e33 are piezoelectric constants, and c13 and c33 are elastic constants all specified in [9]. The a0 parameter is the lattice constant of the material layer in question and the as parameter is the average value of the lattice constants of the layers directly above and below the layer in question. From equation (10) and (16), we can have:
, Y A>7 * Z[ Z\]] A A= *= B= (19)
Taking square for equation (19) on both sides, we can get:
+, Y A>7 * Z[ Z\]] 9 =
A A= *= (20)
which can be expanded as:
, Y A>7 =
*= Z= 2 H Y A>N Z * A A= *= (21)
and equation (21) can be written as
fQ= A
=g *= 2Q *Z Z= A 0 (22)
where
Z Z[ Z\]]
and
Q ' A>
Equation (22) is a standard quadratic equation, solving which we can have:
* DiE jDMiMD3 DM3kM3kM M iM3k8 (23)
which can be simplified to
* DiE jDMDk8MEk3kMMiM3k8kM (24)
Equation (24) provides an analytical expression for the variation of the sheet carrier concentration in the 2DEG as a function of the applied gate voltage. Under the Model Description section, subsection 1 presented that Gupta’s model for 2DEG versus Fermi level is the best except our model. Hence, we will make a comparison between our charge control model and DasGupta’s [29]. Both of them are based the expression of Fermi level versus 2DEG themselves. And, the discussion will be made in next section.
5. Results and Discussion
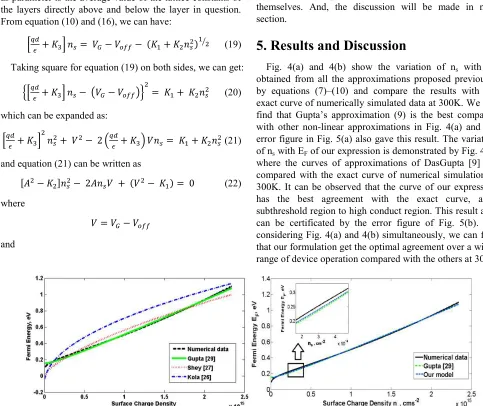
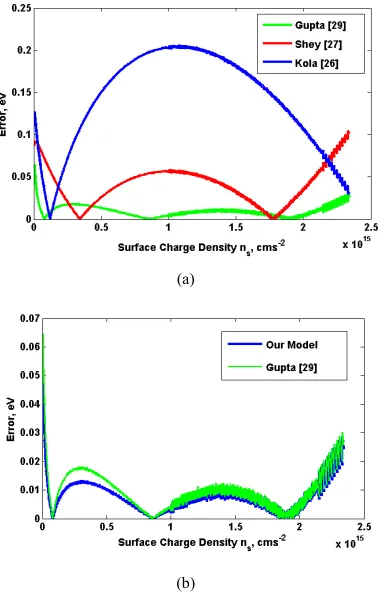
Fig. 4(a) and 4(b) show the variation of ns with EF obtained from all the approximations proposed previously by equations (7)–(10) and compare the results with the exact curve of numerically simulated data at 300K. We can find that Gupta’s approximation (9) is the best compared with other non-linear approximations in Fig. 4(a) and the error figure in Fig. 5(a) also gave this result. The variation of ns with EF of our expression is demonstrated by Fig. 4(b) where the curves of approximations of DasGupta [9] are compared with the exact curve of numerical simulation at 300K. It can be observed that the curve of our expression has the best agreement with the exact curve, after subthreshold region to high conduct region. This result also can be certificated by the error figure of Fig. 5(b). So, considering Fig. 4(a) and 4(b) simultaneously, we can find that our formulation get the optimal agreement over a wider range of device operation compared with the others at 300K.
The calculated ns versus VG from our model in equation (24), is compared with those from the numerical data, as illustrated in Fig. 6. It can be seen that, our curve almost covers the exact curve and our results are very accurate from low voltage bias to very high bias except for in the subthreshold region. To get better fit of Eqn. (24) in the subthreshold region the values of K1, K
modified. This is because the surface Fermi level variation in the subthreshold region is different from that of the region we have considered. In that case the region
operation has to be divided into two different regions, one with the subthreshold region and the other with voltage range above subthreshold region with two different sets of K1, K2 and K3 coefficients for proper modelling of surface charge concentration using Eqn. (24).
(a)
(b)
Fig 5. Error for different space charge density model approximation proposed by different authors.
The comparison of our results with numerical data certifies the validity of our model and the usefulness of equation (24) strongly, which provides an analytical expression for the variation of the surface charge density in the 2DEG as a function of the applied gate voltage. are numerous example of analytical model implementation in modeling high frequency response a
application [33], device simulation [34] behavior [35] and in many other aspects. analytical expression is not complicated, it
useful for improving the analytical models and be also helpful for studying of other characteristics of AlN/GaN/AlGaN DHFETs.
from our model in equation is compared with those from the numerical data, as illustrated in Fig. 6. It can be seen that, our curve almost covers the exact curve and our results are very accurate from low voltage bias to very high bias except for in the etter fit of Eqn. (24) in the K2 and K3 have to be modified. This is because the surface Fermi level variation in the subthreshold region is different from that of the region we have considered. In that case the region of device operation has to be divided into two different regions, one with the subthreshold region and the other with voltage range above subthreshold region with two different sets of modelling of surface
Error for different space charge density model approximation
The comparison of our results with numerical data certifies the validity of our model and the usefulness of 24) strongly, which provides an analytical expression for the variation of the surface charge density in the 2DEG as a function of the applied gate voltage. There are numerous example of analytical model implementation in modeling high frequency response and switching device simulation [34], predicting device aspects. As our formulated xpression is not complicated, it will be very useful for improving the analytical models and be also studying of other characteristics of
Fig 6. Surface charge density versus the gate bias for both simulated numerical data and our proposed model.
6. Conclusion
In conclusion, a new non-linear expression for the Fermi level variation with sheet carrier concentration of the dimensional electron gas has been presented. The expression gives a very good fit to the exact numerical solution at 300K and is much better than all the conventional approximations. Based on our expression, an analytical expression for the variation of the sheet carrier concentration with the applied gate voltage has been developed. It is found that our expression is more accurate than others proposed previously for analytical modeling of DHFETs. Besides, further certification is made by the comparison of our results
expression of Fermi level versus analytical charge control model, will modeling other characteristics of DHFETs degree of accuracy.
Acknowledgment
The author gratefully acknowledge Prof. M. A. Choudhury, Mr. Gaffar Ali, Anwar Siraji and Mr. Enamul
and valuable advices throughout
References
[1] Y.-F. Wu, M. Moore, A. Saxler, T. Wisleder, and P. Parikh, 40-W/mm double field-plated GaN HEMTs, in Proc. 64th Device Res. Conf. State College, PA, 2006, pp. 151
[2] J. P. Ibbetson, P. T. Fini, K. D. Ness, S. P. DenBaars, J. S. Speck, and U.K. Mishra, Polariz
and the source of electrons in AlGaN/GaN heterostructure field effect transistors, Appl. Phys. Lett. 77, 250 (2000)
[3] Y. Uemoto, M. Hikita, H. Ueno, H. Matsuo, H. Ishida, M. Yanagihara, T. Ueda, T. Tanaka, and D. Ueda, Gate injection transistor (GIT) A normally
power transistor using conductivity modulation, IEEE Trans. Electron Devices, vol. 54, no. 12, pp. 3393
Surface charge density versus the gate bias for both simulated numerical data and our proposed model.
linear expression for the Fermi n with sheet carrier concentration of the two-dimensional electron gas has been presented. The expression gives a very good fit to the exact numerical solution at 300K and is much better than all the approximations. Based on our expression, an expression for the variation of the sheet carrier with the applied gate voltage has been that our expression is more accurate previously for analytical modeling of er certification is made by the with numerical data. Our expression of Fermi level versus 2DEG, as well as our analytical charge control model, will be very helpful in modeling other characteristics of DHFETs for their higher
gratefully acknowledges the contributions of Mr. Gaffar Ali, Mr. Ashfaqul Anwar Siraji and Mr. Enamul Haque for their kind support and valuable advices throughout the work.
Wu, M. Moore, A. Saxler, T. Wisleder, and P. Parikh, plated GaN HEMTs, in Proc. 64th College, PA, 2006, pp. 151–152.
J. P. Ibbetson, P. T. Fini, K. D. Ness, S. P. DenBaars, J. S. Speck, and U.K. Mishra, Polarization effects, surface states, and the source of electrons in AlGaN/GaN heterostructure field effect transistors, Appl. Phys. Lett. 77, 250 (2000).
Journal of Electrical and Electronic Engineering 2013; 1(5): 114-122 121
[4] N. Ikeda, Y. Niiyama, H. Kambayashi, Y. Sato, T. Nomura, S. Kato, and S. Yoshida, GaN power transistors on Si substrates for switching applications, Proc. IEEE, vol. 98, no. 6, pp. 1–11, Jun. 2010.
[5] F. Medjdoub, M. Alomari, J.-F. Carlin, M. Gonschorek, E. Feltin, M. A. Py, N. Grandjean, and E. Kohn,Barrier layer scaling of InAIN/GaN HEMTs, IEEE Electron Device Lett., vol. 29, no. 5, pp. 422–425, May 2008.
[6] F. Medjdoub, J. Derluyn, K. Cheng, M. Leys, S. Degroote, D. Marcon, D. Visalli, M. Van Hove, M. Germain, and G. Borghs,Low on resistance high breakdown normally-off AIN/GaN/AlGaN DHFET on Si substrate, IEEE Electron Device Lett., vol. 31, no. 2, pp. 111–113, Feb. 2010.
[7] L. Shen, S. Heikman, B. Moran, R. Coffie, N.-Q. Zhang, D. Buttari, I.P. Smorchkova, S. Keller, S. P. Den Baars, U. K. Mishra, AlGaN/AlN/GaN high-power microwave HEMT, IEEE Electron Device Lett., Vol. 22, no. 10, pp. 457–459.
[8] Pinto M.R., Conor S. Rafferty, and Robert W. Dutton, PISCES2-Poisson and Continuity Equation Solver, Stanford Electronics Laboratory Technical Report, Stanford University, September 1984.
[9] Bernardini, F., and V. Fiorentini, Spontaneous Polarization and Piezoelectric Constants of III-V Nitrides, Phys. Rev. B, Vol. 56, No. 16, 15.(Oct. 1997): R10024–R10027.
[10] Law, M.E. et. al., Self-Consistent Model of Minority-Carrier Lifetime, Diffusion Length, and Mobility, IEEE Electron Device Letters, Vol. 12, No. 8, 1991.
[11] Caughey, D.M., and R.E. Thomas, Carrier Mobilities in Silicon Empirically Related to Doping and Field, in Proc. IEEE, (1967): 2192–2193.
[12] Danqiong Hou, Griff L. Bilbro, and Robert J. Trew, Analytic Model for Conduction Current in AlGaN/GaN DHFETs/HEMTs, Active and Passive Electronic Components, vol. 2012, Article ID 806253, 11 pages, 2012.
[13] H.K. Ahn and M. E. Nokali, An Analytical Model for High Electron Mobility Transistors, IEEE Transactions on Electron Devices, Vol. 41, No. 6, pp. 874-878, 1994.
[14] T. Zimmermann, D. Deen, Yu Cao, J. Simon, P. Fay, D. Jena, H.G. Xing,AlN/GaN Insulated-Gate HEMTs With 2.3 A/mm Output Current and 480 mS/mm Transconductance, IEEE Electron Device Lett., vol.29, no.7, pp.661-664, July 2008.
[15] M. Micovic, P. Hashimoto, M. Hu, I. Milosavljevic, J. Duvall, P. J. Willadsen, W.-S. Wong, A. M. Conway, A. Kurdoghlian, P. W. Deelman, J.-S. Moon, A. Schmitz, and M. J. Delaney, GaN double heterojunction field effect transistor for microwave and millimeterwave power applica-tions, in IEDM Tech. Dig., 2004, pp. 807–810.
[16] Bahat-Treidel, E. and Hilt, O. and Brunner, F. and Wurfl, J. and Trankle, G.,Punchthrough-Voltage Enhancement of AlGaN/GaN HEMTs Using AlGaN Double-Heterojunction Confinement, IEEE Electron Device Lett., vol. 55, no. 12, pp. 3354–3359, Dec. 2008.
[17] C. Q. Chen, J. P. Zhang, V. Adivarahan, A. Koudymov, H. Fatima, G. Simin, J. Yang, and M. Asif Khan, AlGaN/GaN/AlGaN double heterostructure for high-power III-N field-effect transistors, Appl. Phys. Lett., 82, 4593 (2003).
[18] X. Cheng and Y. Wang, A surface-potential-based compact model for AlGaN/GaN MODFETs, IEEE Trans. Electron Devices, vol. 58, no. 2, pp. 448–454, Feb. 2011.
[19] S. Kola, J. M. Golio, and G. N. Maracas, An analytical expression for Fermi level versus sheet carrier concentration for HEMT modeling, IEEE Electron Device Lett., vol. 9, no. 3, pp. 136138, Mar. 1988.
[20] I. Angelov, H. Zirath, and N. Rorsman, A new empirical non-linear model for HEMT and MESFET devices, IEEE Trans. Microw. Theory Tech., vol. 40, no. 12, pp. 22582266, Dec. 1992.
[21] K. Lee, M. Shur, T. J. Drummond, and H. Morkoc,Current– voltage and capacitance–voltage characteristics of modulation doped field transistors, IEEE Trans. Electron Devices, vol. ED-30, no. 3, pp. 207-212, Mar. 1983.
[22] M. Li and Y. Wang, 2-D analytical model for currentvoltage characteristics and transconductance of AlGaN/GaN MODFETs, IEEE Trans. Electron Devices, vol. 55, no. 1, pp. 261-267, Jan. 2008.
[23] X. Cheng, M. Li, and Y. Wang, Physics based compact model for AlGaN/GaN MODFET with closed form I-V and C-V characteristics, IEEE Trans. Electron Devices, vol. 56, no. 12, pp. 2881–2887, Dec. 2009.
[24] D. Delagebcaudeuf and NT Linh, Metal–(n) AlGaAs-GaAs two dimen-sional electron gas FET, IEEE Trans. Electron Devices, ED- 29, pp. 955, 1982.
[25] T.J. Drummond, H. Morkoc, K. Lee, M. Shur, Model for modulation-doped field-effect transistor, IEEE Electron. Dev. Lett., EDL- 3, pp. 338, 1982.
[26] S. Kola, J.M. Golio, G.N. Maracas, An analytic expression for Fermi level versus sheet carrier concentration for HEMT modeling, IEEE Electron. Dev. Lett., vol. 9, pp. 136, 1988.
[27] A.J. Shey, W.H. Ku, On the charge control of the two- dimensional electron gar for analytic modeling of HEMT’s, IEEE Electron. Dev. Lett., vol. 9, pp. 624, 1988.
[28] A.J. Shey, W.H. Ku, An analytic current-voltage characteristics model for high electron mobility transistors based on nonlinear charge-control formulation, IEEE Electron. Dev. Lett., vol. 36, pp. 2299, 1989.
[29] N. DasGupta, A. DasGupta, An analytical expression for sheet carrier concentration versus gate voltage for HEMT modeling, Solid-State Electron., 36, 201 (1993).
[30] Rashmi, A. Kranti, S. Haldar, An accurate charge control model for spontaneous and piezoelectric polarization dependent two-dimensional electron gas (2-DEG) sheet charge density of lattice mismatched Al-GaN/GaN HEMTs, Solid-State Electronics, vol. 46, no. 5, pp. 621-630, 2002.
[31] E. T. Yu, X. Z. Dang, P. M. Asbeck, S. S. Lau, G. J. Sullivan, Spontaneous and piezoelectric polarization effects in III–V nitride heterostructures, Journal of Vacuum Science and Technology B: Microelectronics and Nanometer Structures, vol.17, no.4, pp. 1742–1749, Jul 1999.
[33] Bhagat, A. (2012). Simulation of optically controlled SiC (Silicon Carbide) using analytical modeling of high frequency response and switching applications (Doctoral dissertation, CALIFORNIA STATE UNIVERSITY).
[34] Hatakeyama, T.; Fukuda, K.; Okumura, H., "Physical Models for SiC and Their Application to Device Simulations of SiC Insulated-Gate Bipolar Transistors," IEEE
Transactions on Electron Devices, vol.60, no.2, pp.613,621, Feb. 2013.
![Fig 1. Conventional structure of (a) AlN/GaN/AlGaN DHFET and (b) AlGaAs/GaAs HEMT. (c) Transfer characteristics obtained from numerical simulation of DHFET device which fits the experimental data obtained in [6]](https://thumb-us.123doks.com/thumbv2/123dok_us/9873426.1974810/2.595.87.521.350.454/conventional-structure-transfer-characteristics-numerical-simulation-experimental-obtained.webp)