12
Nutrient Release Pattern of Different Boron
Fractions in Maize Growing Sandy Loam Soils
M. Naveen Saviour* and P. Stalin
Department of Soil Science and Agricultural Chemistry, Tamil Nadu Agricultural University, Coimbatore-641 003, Tamil Nadu, INDIA.
*Corresponding author: [email protected]
Paper No. 236 Received: May 21, 2014 Accepted: July 17, 2014 Published: September 5, 2014
Abstract
An understanding of soil boron occurring in various forms and their release behaviour in soils needs to be examined extensively in major soil series. A laboratory incubatios study was conducted to study the release pattern of boron fractions under maize growing sandy loam B deficit soils with different levels of B as 0, 0.5, 1.0, 1.5 and 2.0 kg ha-1 were replicated thrice in a completely randomized design. The soils were incubated at field capacity for a month (30 days) period and destructive sampling was done at intervals viz., 0, 7, 15, 21 and 30 days after incubation. B fractions viz., specifically adsorbed, oxide bound, organically bound and residual B in soil were determined. The results revealed that with applied boron, the non-specifically adsorbed B fraction was higher next to residual form when compared to other forms of boron. Applied B converted to soluble form and attained peak values at 21 days after incubation in the treatment with application of 2 kg B ha-1 and thereafter a decrease was noted. Irrespective of location, the plant available form of B includes non- specifically adsorbed B fraction which was considerably higher (1.03 and 1.0 mg kg-1 mg kg-1) on 21st day after incubation (contributed towards 0.02 and 0.01% of total B) which coincides with the high demand for B by maize crop during vegetative phase. The data’s also revealed that the contribution of residual boron to total boron was the highest among the B fractions.
Highlights
• Non-specifically adsorbed B fraction was higher next to residual form in a coarse textured B deficit soil with graded dosage of applied boron.
• Irrespective of location, the plant available form of B which includes non-specifically adsorbed B fraction was considerably higher at three weeks after incubation.
Keywords: Boron, B levels, fractions, field capacity, maize
Boron is an essential micronutrient, when at elevated concentrations in the soil can become toxic to plants. Boron in soils can exist as labile species in the soil solution and less labile forms such as non-specifically adsorbed B on phyllosilicate clays (Goldberg et al.,
1993), specifically adsorbed B on variable charge oxides
onto mineral and humic particles and by forming insoluble precipitates (Goldberg and Glaubig, 1985; Evans, 1987). The mobility, transport and partitioning of B in soils are dependent on various soil chemical properties that include soil pH, the type and contents of clay minerals, and the contents of Al and Fe oxides and (oxy) hydroxides, carbonates and organic matter (Keren and Bingham, 1985). To assess the agricultural impact of B, it is necessary to understand and quantify the different forms of B in soil intensively cultivable soils. Boron is found in soils in various forms. However, the contribution of various B fractions towards B availability in soils has not been examined extensively (Datta et al.,
2002; Chaudhary and Shukla, 2004). In almost every soil, readily soluble B represented only a small proportion of the total B content, regardless of the extraction method used. Most soil B existed in the residual or occluded form, which accounted for between 92 and 99%, with an average of 97%, of the total soil B. The concentration of organically bound B was higher than that of oxide bound B and specifically adsorbed B, irrespective of the readily soluble B extracting solution with the average of 97%, of the total soil. The major portion of soil B (92–99%) existed in the residual fraction. Since boron are significantly involved in reproduction process of maize crop (Li and Lang, 1997) and their deficiency may occur simultaneously in intensively cultivated soils (Agarwala and Sharma, 1979) an incubation study was contemplated to understand better on the B distribution among different fractions, the objectives of this research were to determine the B fractions of soils treated with mineral fertilizer (borax), to evaluate the release pattern of B fractions by adopting the standard sequential procedure. Thus. knowledge regarding distribution of B in different fractions is essential to understand soil chemistry and B-nutrition for obtaining reliable information about the need of zinc to plant at critical growth stages.
Materials and Methods
A laboratory incubation study was conducted to study the release pattern of boron fractions from micronutrient fertilizer Borax under maize growing sandy loam soils of
two different locations from Pudukkottai district, Tamil Nadu during 2012-13.
Soil initial analysis
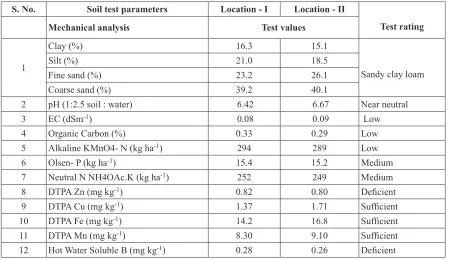
A composite sample was prepared from the randomly collected surface soil samples (0-15 cm) from two different locations before the commencement of the incubation study using stainless steel materials. The soil samples were processed and stored in polythene container to study various soil properties. The initial physico-chemical properties of the collected soil are given in Table 1. The collected soils comes under the dominant soil series viz., Pattukkotai (Pkt) and Madukkur (Mdk) series covering about 30,991 (48.7% area) and 20,699 ha (32.5% area) respectively in Alangudi taluk of Pudukkottai district. Except slight variation in its colour, hardness and drainage, both the soil series are found to be similar in their properties. Both the soils are sandy loam in texture and the soils of Pattukkotai (Pkt) series are light yellowish brown (10 YR 6/4 m) and well drained because of their hardness and friable nature than Madukkur (Mdk) series which are brown in colour (10 YR 5/3 m), poor drained and friable. The USDA taxonomical classification for the collected soils under Pattukkotai (Pkt) and Madukkur (Mdk) series is fine loamy hyperthermic Udic Haplustalfs and fine loamy hyperthermic Ultic Haplustalfs respectively. The bulk density (1.39 and 1.42 Mg m-3), particle density (2.35
and 2.42 Mg m-3) and pore space (40.86 and 41.33%)
were determined in the soils of 2 locations.
Treatments structure
A known weight of soil sample was taken (100 g) in a plastic container and imposed with different levels B. The treatment structure comprised of graded levels of borax as 0, 0.5, 1.0, 1.5 and 2.0 kg ha-1 were replicated
The various boron fractions were estimated in the soil and the results are presented hereunder.
Results and Discussion
Boron exists in different forms and distinguished in many categories. Soil B, as adsorbed by clay minerals, organic matter, Al and Fe oxides and calcium carbonate can be stored or removed depending on changes of boron concentration in soil solution. The various boron fractions studied were also illustrated graphically in fig. 1 and 2.
Physicochemical Properties of initial soil (Table 1) The soils of the study location varied in their soil properties, where the pH of both the location was almost near neutral (6.42 and 6.67). The Electrical Conductivity (EC) of the soils was 0.08 and 0.09 (dSm-1). Based on
the soil test data, both the soil samples were found low in organic carbon (OC) with 0.33 and 0.29. Regarding B, the soil available B were 0.28 and 0.26 mg kg-1 respectively
which showed deficient in both the locations.
Boron fractions
The different boron fractions showed an increased trend with graded levels of boron at field capacity during the incubation period in the soils of both the locations Among all the boron fractions, the contribution of the residual boron to the total boron content was the highest among all the boron fractions estimated.
Non specifically adsorbed boron (Tables 2 and 3) Among the different fractions, non specifically adsorbed boron fraction showed an increasing trend for added levels of boron compared to control in both soils. At 21 days of incubation, the non specifically adsorbed boron in soils reached a maximum content (0.62, 0.65, 0.91, 1.03, 1.01 and 0.59, 0.62, 0.88, 1.00, 0.98 mg kg-1 respectively in both the locations) at B @ 2.0 kg
ha-1. The highest content of this fraction to total boron
(58.76 and 56.30 and mg kg-1) reached a peak with
1.03 and 1.0 mg kg-1 and contributed towards 0.02 and
0.01% of total B, respectively at B @ 2.0 kg ha-1 in
both locations. At 30 days after incubation, the release pattern of this fraction with the application of B @ 2.0 kg ha-1 showed a decreasing trend with a value of 1.01 and
0.98 mg kg-1 in both the locations. During the incubation
period, the non specifically adsorbed boron in soils of both the locations ranged from 0.13-1.03 and 0.1 - 1.0
mg kg-1 and reached the maximum at B @2.0 kg ha-1
0.00 0.40 0.80 1.20
0 1 2 0 1 2 0 1 2 0 1 2 0 1 2
Fr
act
io
ns
(m
g kg
-1)
B Levels (kg ha-1)
A B C D
A.Non specifically adsorbed B, B. Specifically adsorbed B, C. Oxide bound B, D. Organically bound B,
Fig. 1. Distribution of different forms of boron (mg kg-1) in soils of the incubation study – Location I
Table 1. Physico chemical characteristics of initial soil
S. No. Soil test parameters Location - I Location - II
Test rating
Mechanical analysis Test values
1
Clay (%) 16.3 15.1
Sandy clay loam
Silt (%) 21.0 18.5
Fine sand (%) 23.2 26.1
Coarse sand (%) 39.2 40.1
2 pH (1:2.5 soil : water) 6.42 6.67 Near neutral
3 EC (dSm-1) 0.08 0.09 Low
4 Organic Carbon (%) 0.33 0.29 Low
5 Alkaline KMnO4- N (kg ha-1) 294 289 Low
6 Olsen- P (kg ha-1) 15.4 15.2 Medium
7 Neutral N NH4OAc.K (kg ha-1) 252 249 Medium
8 DTPA Zn (mg kg-1) 0.82 0.80 Deficient
9 DTPA Cu (mg kg-1) 1.37 1.71 Sufficient
10 DTPA Fe (mg kg-1) 14.2 16.8 Sufficient
11 DTPA Mn (mg kg-1) 8.30 9.10 Sufficient
0.00 0.40 0.80 1.20
0 1 2 0 1 2 0 1 2 0 1 2 0 1 2
Fr
act
io
ns
(m
g kg
-1)
B Levels (kg ha-1)
A B C D
A.Non specifically adsorbed B, B. Specifically adsorbed B, C. Oxide bound B, D. Organically bound B,
Fig.2. Distribution of different forms of boron (mg kg-1) in soils of the incubation study – Location II
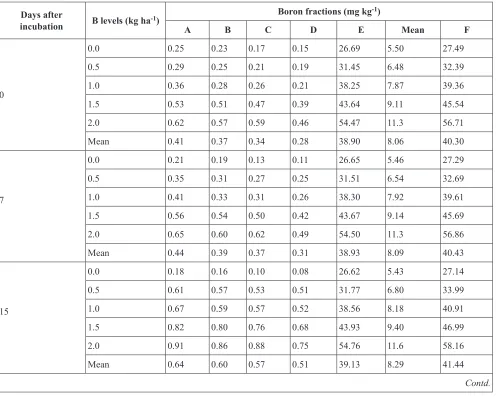
Table 2. Distribution of different forms of boron (mg kg-1) in soils of the incubation study (Location-1)
Days after
incubation B levels (kg ha-1)
Boron fractions (mg kg-1)
A B C D E Mean F
0
0.0 0.25 0.23 0.17 0.15 26.69 5.50 27.49
0.5 0.29 0.25 0.21 0.19 31.45 6.48 32.39
1.0 0.36 0.28 0.26 0.21 38.25 7.87 39.36
1.5 0.53 0.51 0.47 0.39 43.64 9.11 45.54
2.0 0.62 0.57 0.59 0.46 54.47 11.3 56.71
Mean 0.41 0.37 0.34 0.28 38.90 8.06 40.30
7
0.0 0.21 0.19 0.13 0.11 26.65 5.46 27.29
0.5 0.35 0.31 0.27 0.25 31.51 6.54 32.69
1.0 0.41 0.33 0.31 0.26 38.30 7.92 39.61
1.5 0.56 0.54 0.50 0.42 43.67 9.14 45.69
2.0 0.65 0.60 0.62 0.49 54.50 11.3 56.86
Mean 0.44 0.39 0.37 0.31 38.93 8.09 40.43
15
0.0 0.18 0.16 0.10 0.08 26.62 5.43 27.14
0.5 0.61 0.57 0.53 0.51 31.77 6.80 33.99
1.0 0.67 0.59 0.57 0.52 38.56 8.18 40.91
1.5 0.82 0.80 0.76 0.68 43.93 9.40 46.99
2.0 0.91 0.86 0.88 0.75 54.76 11.6 58.16
21
0.0 0.15 0.13 0.07 0.05 26.59 5.40 26.99
0.5 0.73 0.69 0.65 0.63 31.89 6.92 34.59
1.0 0.79 0.71 0.69 0.64 38.68 8.30 41.51
1.5 0.94 0.92 0.88 0.80 44.05 9.52 47.59
2.0 1.03 0.98 1.00 0.87 54.88 11.7 58.76
Mean 0.73 0.69 0.66 0.60 39.22 8.38 41.89
30
0.0 0.13 0.11 0.05 0.03 26.57 5.38 26.89
0.5 0.71 0.67 0.63 0.61 31.87 6.90 34.49
1.0 0.77 0.69 0.67 0.62 38.66 8.28 41.41
1.5 0.92 0.90 0.86 0.78 44.03 9.50 47.49
2.0 1.01 0.96 0.98 0.85 54.86 11.7 58.66
Mean 0.71 0.67 0.64 0.58 39.20 8.36 41.79
Forms A B C D E Mean F
Overall
range 0.13-1.03 0.11-0.98 0.05-1.00 0.03-0.81 26.57-54.28 5.38-11.75 26.89-58.76
Overall
mean 0.59 0.54 0.52 0.46 39.08 8.24 41.17
CV% 48.74 51.61 57.81 59.11 25.51 26.32 26.34
A. Non specifically adsorbed B, B. Specifically adsorbed B, C. Oxide bound B, D. Organically bound B, E. Residual B, F. Total B Specifically adsorbed boron (Tables 2 and 3)
The specifically adsorbed boron fraction in soils of both the locations increased with levels of boron application and
reached a peak on 21st day of incubation. The boron level at @ 2.0 kg ha-1 had increased the specifically adsorbed
boron content at 0, 7, 15, 21 and 30 days after incubation (0.57, 0.60, 0.86, 0.98, 0.96 and 0.55, 0.58, 0.84, 0.96, 0.94 mg kg-1 respectively in both the locations). From
the beginning to end of the incubation period, both soils recorded the highest specifically adsorbed boron content with 0.98 and 0.96 mg kg-1 due to application of B @
2.0 kg ha-1. Boron @ 2.0 kg ha-1 level had increased the
specifically adsorbed boron content with 0.98 and 0.96 mg kg-1 and contributed 0.02 and 0.02 per cent respectively
to total boron at 21 days of incubation. In general, increasing levels of boron increased their concentration in the soils. With respect to their contribution to total boron, the released fraction was found to be minimum ranging from 0.11-0.98 and 0.09-0.96 mg kg-1 which
might probably be due to the specifically adsorbed boron originates from weak binding sites of both organic and inorganic constituents, as confirmed with the findings of Hoe et al., (1994).
Oxide bound boron (Tables 2 and 3)
The oxide bound boron fraction in soils of both the locations increased with increasing levels of boron application and maximum release was found on 21st day of incubation. The effect of different boron at @ 2.0 kg ha-1 levels had increased the content at 0, 7, 15, 21
and 30 days after incubation (0.59. 0.62, 0.88, 1.00 and 0.98 mg kg-1 and 0.56, 0.59, 0.85, 0.97, 0.95 mg kg-1
respectively in both the locations). From the beginning to end of the incubation period, both soils recorded the highest boron content of 1.0 and 0.97 mg kg-1 on 21st
day of incubation. During the period of this incubation experiment, the oxide bound form of boron ranged from 0.05-1.00 and 0.02-0.97 mg kg-1. The level of boron
at @ 2.0 kg ha-1 had increased the oxide bound boron
content with 1.0 and 0.97 mg kg-1 and contributed 0.02
Table 3. Distribution of different forms of boron (mg kg-1) in soils of the incubation study (Location-1I)
Days after
incubation (kg haB levels -1) Boron fractions (mg kg
-1)
A B C D E Mean F
0
0.0 0.22 0.21 0.14 0.12 24.34 5.01 25.03
0.5 0.26 0.23 0.18 0.16 29.10 5.99 29.93
1.0 0.33 0.26 0.23 0.18 35.90 7.38 36.90
1.5 0.50 0.49 0.44 0.36 41.29 8.62 43.08
2.0 0.59 0.55 0.56 0.43 52.12 10.8 54.25
Mean 0.38 0.35 0.31 0.25 36.55 7.57 37.84
7
0.0 0.18 0.17 0.10 0.08 24.30 4.97 24.83
0.5 0.32 0.29 0.24 0.22 29.16 6.05 30.23
1.0 0.38 0.31 0.28 0.23 35.95 7.43 37.15
1.5 0.53 0.52 0.47 0.39 41.32 8.65 43.23
2.0 0.62 0.58 0.59 0.46 52.15 10.8 54.40
Mean 0.41 0.37 0.34 0.28 36.58 7.59 37.97
15
0.0 0.15 0.14 0.07 0.05 24.27 4.94 24.68
0.5 0.58 0.55 0.50 0.48 29.42 6.31 31.53
1.0 0.64 0.57 0.54 0.49 36.21 7.69 38.45
1.5 0.79 0.78 0.73 0.65 41.58 8.91 44.53
2.0 0.88 0.84 0.85 0.72 52.41 11.1 55.70
Mean 0.61 0.58 0.54 0.48 36.78 7.80 38.98
21
0.0 0.12 0.11 0.04 0.02 24.24 4.12 24.53
0.5 0.70 0.67 0.62 0.60 29.54 5.48 32.13
1.0 0.76 0.69 0.66 0.61 36.33 6.64 39.05
1.5 0.91 0.90 0.85 0.77 41.70 7.68 45.13
2.0 1.00 0.96 0.97 0.84 52.53 9.56 56.30
Mean 0.70 0.67 0.63 0.57 36.87 6.70 39.43
30
0.0 0.10 0.09 0.02 0.02 24.22 4.10 24.43
0.5 0.68 0.65 0.60 0.58 29.52 5.46 32.03
1.0 0.74 0.67 0.64 0.59 36.31 6.62 38.95
1.5 0.89 0.88 0.83 0.75 41.68 7.66 45.03
2.0 0.98 0.94 0.95 0.82 52.51 9.54 56.20
Mean 0.68 0.65 0.61 0.55 36.85 6.68 39.33
Forms A B C D E Mean F
Overall
range 0.1-1.0 0.09-0.96 0.02-0.97 0.02-0.84 24.22-52.53 4.1-9.56 24.43-56.30
Overall
mean 0.56 0.52 0.49 0.43 36.73 7.27 38.71
CV% 51.38 53.59 61.39 63.29 27.14 28.83 28.02
at mineral surfaces as well as B that has isomorphously replaced Al or Fe within the octahedral sheet of the minerals. The results also corroborate with earlier findings of Hoe et al., (1994).
Organically bound boron (Tables 2 and 3)
The boron level at @ 2.0 kg ha-1 had increased the
organically bound boron content at 0, 7, 15, 21 and 30 days after incubation (0.46, 0.49, 0.75, 0.87, 0.85 and 0.43, 0.46, 0.72, 0.84, 0.82 mg kg-1 respectively in both
the locations. The organically bound boron fraction in soils increased with levels of boron application. From the beginning to end of the incubation period, both soils recorded the highest organically bound boron fraction content with 0.87 and 0.84 mg kg-1 on 21st day of
incubation due to application of B @ 2.0 kg ha-1. The
level of boron at @ 2.0 kg ha-1 increased the organically
boron which ranged from 0.03-0.81 and 0.02-0.84 mg kg-1 with higher content of 0.87 and 0.84 mg kg-1 on 21st
day and contributed to 0.02 and 0.01 per cent of total boron respectively in both the locations due to application of B @ 2.0 kg ha-1. This form of boron increased with
increasing levels of boron which solely depend on the organic carbon content of the soil (Karthikeyan and Shukla, 2011).
Residual boron (Tables 2 and 3)
The residual boron fraction in soils of both the locations increased with different levels of boron application. Boron level @ 2.0 kg ha-1 had increased the residual
boron content at 0, 7, 15, 21 and 30 days after incubation (54.47, 54.50, 54.76, 54.88, 54.86 and 52.12, 52.15, 52.41, 52.53, 52.51 mg kg-1 respectively in both the
locations). From the beginning to end of the incubation period, both soils recorded the residual boron fraction with 54.88 and 52.53 mg kg-1 on 21st day of incubation
due to application of B @ 2.0 kg ha-1 which was the
highest among all the boron fractions. The residual boron found in larger amount ranged from 26.57 - 54.28 and 24.22 -52.53 mg kg-1 increased with a mean of 54.88 and
52.53 mg kg-1 at the B level @ 2.0 kg ha-1 and contributed
to 93.4 and 93.3 percent to total boron respectively in both the locations due to application of B @ 2.0 kg
ha-1. The highest amounts of soil boron originated from
residual form, generally ranged from 70 to 99% of total soil B (Raza et al., 2002). This form of boron accounted major contribution to total boron among all other boron fractions (Karthikeyan and Shukla, 2011).
Conclusion
From the incubation experiment, it was inferred that with applied boron, the non - specifically adsorbed B fraction was higher next to residual form when compared to other forms of boron. Applied B converted to this soluble form and attained peak values (1.03 and 1.0 mg kg-1 mg kg-1) at
21 days after incubation in the treatment with application of 2 kg B ha-1 and thereafter a decrease was noted.
The plant available form of B includes non-specifically adsorbed B fraction which was considerably higher on 21st day after incubation which coincides with the high demand for B by maize crop during vegetative phase.
Acknowledgments
The author acknowledges the chairman and the advisory committee members who provide their valuable guidance to conduct this incubation experiment.
References
Agarwala, S.C. and Sharma. C.P. 1979. Recognizing Micronutrient Disorders of crop plants on the basis of visual symptoms and plant analysis. Department of Botany, Lucknow University, Lucknow.
Chaudhary, D.R and Shukla L.M. 2004. Boron forms and their relationships with characteristics of arid soils of Western Rajasthan. Journal of the Indian Society of Soil Science
52 (2): 197-199.
Datta., S.P., R.K. Rattan, K. Suribabu and Datta. S.C. 2002. Fractionation and colorimetric determination of boron in soils. Journal of Plant Nutrition and Soil Science 165: 179-184.
Evans, L. J. 1987. The retention ofboron by Ontario soils. Can Journal of Soil Science 67:3!42.
Goldberg, S. and Forster, 1991. H. S. Boron sorption on calcareous soils and reference calcites. Soil Science 152: 304110.
Goldberg, S., Forster, H. S. and Heick, E. L. 1993. Boron adsorption mechanisms on oxides, clay minerals, and soils infened from ionic strength effects. Soil Science Society of American Journal 57: 70- 708.
Gu, B. and Lowe, L. E. 1990. Studies on the adsorption of boron on humic acid. Canadian Journal of Soil Science
70: 305-311.
Hingston, F, J. 1964. Reactions between boron and clays. Australian Journal of Soil Research 2: 8-95.
Hoe, J., L.J Evans and Spiers. J. 1994. Boron fractionation in soils. Comm. Soil Science Plant Analysis 25: 1841-1853. Karthikeyan, K and Shukla. M. 2011. Different forms of boron
and sulphur and their effect on B and S contents in mustard (Brassica juncea L.). Agropedology 21(1): 28-34.
Keren, R. and Bingham, F. T. 1985. Boron in water, soils and plants. Advances in Soil Science l:229-276.
Li, Y. and Liang. H. 1997. Soil Boron Content and the Effects of Boron application on Yields of Maize, Soybean, Rice and Sugar Beet in Heilonjian Province, P.R. China. In: Boron in Soils and Plants, Beli, R.W. and B. Rerkasem (Eds.). Kluwer Academic Publishers, the Netherlands, pp: 17-21.
Raza, M., A.R. Mermut, J.J. Schoenau, and Malhi. S.S. 2012. Boron fractionation in some Saskatchewan soils. Canadian Journal of Soil Science 173-179.