Intra-individual variation in urinary
iodine concentration: effect of statistical
correction on population distribution
using seasonal three-consecutive-day
spot urine in children
Xiaohong Ji, Peng Liu, Zhenqi Sun, Xiaohui Su, Wei Wang, Yanhui Gao, Dianjun Sun
To cite:Ji XH, Liu P, Sun ZQ, et al. Intra-individual variation in urinary iodine
concentration: effect of statistical correction on population distribution using seasonal three-consecutive-day spot urine in children. BMJ Open2016;6:e010217. doi:10.1136/bmjopen-2015-010217
▸ Prepublication history for this paper is available online. To view these files please visit the journal online (http://dx.doi.org/10.1136/ bmjopen-2015-010217).
XHJ and PL are first authors and contributed equally.
Received 8 October 2015 Revised 1 February 2016 Accepted 2 February 2016
For numbered affiliations see end of article.
Correspondence to Dr Dianjun Sun; [email protected]
ABSTRACT
Objective:To determine the effect of statistical correction for intra-individual variation on estimated urinary iodine concentration (UIC) by sampling on 3 consecutive days in four seasons in children. Setting:School-aged children from urban and rural primary schools in Harbin, Heilongjiang, China. Participants:748 and 640 children aged 8–11 years were recruited from urban and rural schools, respectively, in Harbin.
Primary and secondary outcome measures:The spot urine samples were collected once a day for 3 consecutive days in each season over 1 year. The UIC of the first day was corrected by two statistical correction methods: the average correction method (average of days 1, 2; average of days 1, 2 and 3) and the variance correction method (UIC of day 1 corrected by two replicates and by three replicates). The variance correction method determined the SD between subjects (Sb) and within subjects (Sw), and calculated
the correction coefficient (Fi), Fi=Sb/(Sb+Sw/di), where
diwas the number of observations. The UIC of day 1
was then corrected using the following equation:
corrected UIC¼all children0s UIC mean for day 1þFi ðchild0s UIC mean for two or three times all children0s UIC mean for day 1Þ:
Results:The variance correction methods showed the overall Fiwas 0.742 for 2 days’correction and 0.829
for 3 days’correction; the values for the seasons spring, summer, autumn and winter were 0.730, 0.684, 0.706 and 0.703 for 2 days’correction and 0.809, 0.742, 0.796 and 0.804 for 3 days’correction, respectively. After removal of the individual effect, the correlation coefficient between consecutive days was 0.224, and between non-consecutive days 0.050. Conclusions:The variance correction method is effective for correcting intra-individual variation in estimated UIC following sampling on 3 consecutive days in four seasons in children. The method varies
little between ages, sexes and urban or rural setting, but does vary between seasons.
INTRODUCTION
Iodine is an essential component of thyroid hormone synthesis.1–3 Children with inad-equate thyroid hormone production have an increased risk of developing neurological dis-orders and mental retardation.4 5 Over the last two decades, the prevalence of iodine deficiency disorders has decreased worldwide due to the implementation of universal salt iodisation.6 However, there are 246 million school-aged children globally with insuffi -cient iodine intake.7 In China, iodine
Strengths and limitations of this study
▪ Children’s urinary iodine concentration (UIC) results were corrected using the variance correc-tion method, indicating this method could be used for different populations.
▪ The correcting coefficient (Fi) within seasons,
ages, sexes and setting (urban or rural) was compared to the cut-off value, which demon-strated that except for seasons, there were no obvious differences between ages, sexes and settings.
▪ The correlation coefficient (r) of urinary iodine between non-consecutive and consecutive days was weak after the individual effect was removed from the measurements.
▪ More tests of adults, pregnant women, lactating women and infants should be conducted in the future.
▪ Whether the UIC corrected by two or three repli-cates is able to represent individual iodine nutri-tion level should be further tested.
on September 22, 2020 by guest. Protected by copyright.
deficiency disorders are still a public health problem in remote areas.8 Urinary iodine concentrations (UIC) are measured to assess the iodine nutrition status of popula-tions; children are the preferred subjects because of their easier access.9 10The median UIC is considered to be a valid biomarker of a population’s iodine status. However, defining iodine status at an individual level remains challenging as UIC varies between days and from hour to hour.11The UIC measured in a single spot urine sample varies greatly from day to day within indivi-duals. This variation increases the spread of the distribu-tion such that it does not reflect the range of long-term or ‘usual’ iodine status around the median in a population.12 13 Previous research investigated the intra-individual variation of UIC in older non-Indigenous Australians living in an urban iodine-deficient area. The report concluded that ‘the addition of information about intra-individual variability has potential for increasing the interpretability of UIC data collected to monitor the iodine status of a population’.14 Older residents were investigated in that study, but they are not a population usually surveyed in the field com-pared to children as studied in this report. Besides, in this study, three spot urine samples collected separately on three consecutive days were obtained in four seasons to determine the effect of statistical correction for intra-individual variation on estimated UIC in children. In addition, the differences between seasons, ages, sexes and settings (rural or urban) were also examined.
METHODS Subjects
Research approval was obtained from the Ethics Committee of Harbin Medical University. Written consent was obtained from the children’s parents. Shangzhi primary school was selected as the Harbin urban survey location. Three other primary schools in Dancheng village, Zhoujia village and Xinxing village affiliated to Shuangcheng county of Harbin city were chosen as the rural survey locations. Harbin is a geo-logically low-iodine district of China where more than 80% of the residents’ iodine intake comes from iodised salt.15 The research recruited healthy children aged 8– 11 years with no recent use of iodine-containing multivi-tamins, food supplements or medicines before the survey. For each type of location, urban or rural, at least 500 students were required as the variation in median UIC will be less than 5% when the sample size is above 485.12 From June 2011 to March 2012, the school-based investigations in the four survey locations were con-ducted in each season of the year (in June, September and December 2011 as well as in March 2012). The spot urine samples were collected from all participants once a day for 3 consecutive days. Individuals were excluded if they did not provide urine samples for 3 consecutive days in one season.
Assays
Urine samples were kept in disposable polyethylene tubes and stored in deep freezers until analysis. UIC was measured by the modified acid digestion method by As3+−Ce4+ catalytic spectrophotometry based on the Sandel-Kolthoff reaction.16 17A standard substance with a known concentration from the National Iodine Deficiency Disorders Reference Laboratory was used for quality control.
Statistical analysis
SPSS software (V.21.0) was used for statistical analysis. The UIC data were transformed using the square root to improve normality. The UIC was presented first as the UIC of day 1 followed by the results of two correction methods: the average correction method (average of days 1, 2 and average of days 1, 2 and 3) and the vari-ance correction method (UIC of day 1 corrected by two replicates and UIC of day 1 corrected by three repli-cates). The average correction method was used to cal-culate the average UIC for days 1, 2 and days 1, 2 and 3. The variance correction method had a conceptual underpinning: the variance of the observed UIC could be divided into two parts, that is, Vobserved=Vbetween+Vwithin. The Vobserved was the
distribu-tion of UIC for a group based on 2 or 3 days of UIC data, which included Vbetween (variance between
sub-jects) and Vwithin (variance between two or three
repeated measurements within a subject). The correc-tion coefficient (Fi) for each child was computed as:
Fi¼Sb=ðSbþSw=diÞ; ð1Þ
where Sb is the SD between subjects, Sw is the SD within
subjects, and di is the number of observations available
for each subject (two or three).
For each child, the corrected urinary iodine value was computed as:
CorrectedUIC¼all children'sUICmean forday 1
þFi
ðchild'sUICmean for two or three times
allchildren'sUICmean forday 1Þ:
ð2Þ
Each group of UIC data was calculated for the 5th, 10th, 25th (lower quartile), 50th (median), 75th (upper quartile) and 95th percentiles. All p values were two-sided and significance was defined as p<0.05. The raw correlation coefficient (r) was calculated between different days. The correlation results after removal of the individual effect of the measurements are more meaningful. Supposing that Yij denotes
the observed UIC for the ith child on the jth spot sample, and suppose that m denotes the overall mean
on September 22, 2020 by guest. Protected by copyright.
and ai is the effect of the ith child, it can be assumed
that
Yij¼mþaiþeij;
eijN 0 0 0 2 6 4
3 7 5;
1 r r2
r 1 r
r2 r 1
2 6 4
3 7 5s2 0
B @
1 C
A: ð3Þ
In the equation, ρ denotes the correlation of iodine values between consecutive days, after removal of the effect of the child. The model assumes that the correl-ation between non-consecutive days is ρ2. Next, two linear contrasts can be defined:
L1i¼Yi1Yi3
L2i¼Yi12Yi2þYi3: ð4Þ
To estimate ρ under the model, a direct estimate can be obtained by solving for ρ using the equation below with the two variances by the empirical estimates:
VarðL1Þ½VarðL2Þ1¼1þr
3r: ð5Þ
Evaluation standard
The iodine nutrition criteria recommended by the WHO for children are as follows: deficient, median UIC of <100μg/L; adequate, median UIC of 100–199μg/L; more than adequate, median UIC of 200–299μg/L; and excessive, median UIC of≥300μg/L.17 As Fi was varied
from 0 to 1 and there was no standard available to evalu-ate Fi, we adopted the cut-off value of correlation coeffi
-cient (<0.4, weak correlation; 0.4–0.7, medium correlation; >0.7 strong correlation) to evaluate Fi.
RESULTS
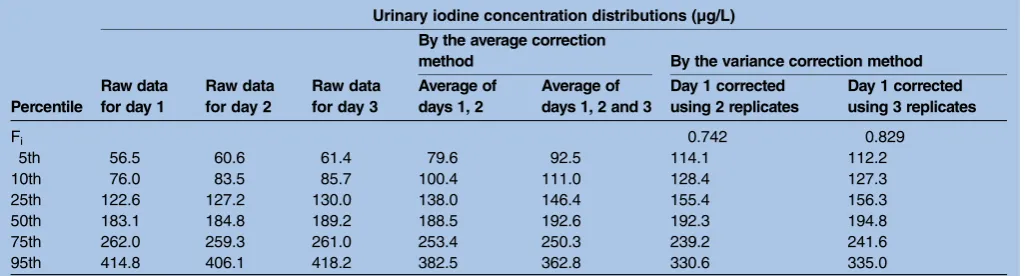
Children who had recently consumed iodine-containing multivitamins, food supplements or medicines before the survey were excluded from the analysis. In total, 1388 children aged 8–11 years were selected for the study, consisting of 748 from the urban setting and 640 from rural settings. A total of 1296 children were enrolled in the study after the exclusion of urinary samples from students who were absent for one or more of the 3 consecutive days in one season. Of these chil-dren, 716 lived in an urban area and 580 in rural areas. There were 667 boys and 629 girls of whom 234, 462, 391 and 209 were aged 8, 9, 10 and 11 years old, respect-ively. Urine samples were collected from 1199, 897, 984 and 928 children in June, September and December 2011 and March 2012, respectively. The distribution of UIC and the corrected results are shown infigure 1and
table 1.
The median UIC (range quartile) for day 1 was 183.1 µg/L (122.6–262.0 µg/L); when corrected using the average correction method, it was 188.5 µg/L
(138.0–253.4 µg/L) for days 1, 2 and 192.6 µg/L (146.4– 250.3 µg/L) for days 1, 2 and 3. When corrected by the variance correction method, Fi was 0.742 by two
repli-cates and 0.829 by three replirepli-cates, and the median UIC was 192.3 µg/L (155.4–239.2 µg/L) and 194.8 µg/L (156.3–241.6 µg/L), respectively. Although Fi was
differ-ent between two and three replicates, the median UIC was very similar. These findings showed that the iodine intake of the children was adequate based on the WHO iodine nutrition criteria (100–199 µg/L) and the median UIC increased with the number of corrected days for both correction methods.
The raw correlation coefficient (r) of UIC for differ-ent days was analysed. For day 1 and day 2, r=0.347; day 1 and day 3, r=0.233; day 2 and day 3, r=0.308. For day 1 and the average of days 1, 2, r=0.831; day 1 and the average of days 1, 2 and 3, r=0.729; day 2 and the average of days 1, 2, r=0.810; day 2 and the average of days 1, 2 and 3, r=0.746; day 3 and the average of days 1, 2, r=0.326; day 3 and the average of days 1, 2 and 3, r=0.711. The correlation between day 1 and day 1 cor-rected by two replicates was r=0.833; the correlation between day 1 and day 1 corrected by three replicates was r=0.729. These results described a weak correlation between different days, and a strong correlation between day 1 and the average data, and between day 1 and vari-ance corrected data. Furthermore, after removing the individual effect from the measurements, according to equation 5, ρ=0.224, ρ2=0.050, that is, the r of UIC between consecutive days was 0.224, while the r of UIC between non-consecutive days was 0.050, and both were in weak correlation and lower than the r of raw correl-ation, demonstrating that the individual effect existed but was rather weak.
From the distribution of UIC in figure 1, compared with the raw data, it can be seen that the distribution of UIC after correction by the different methods was changed. The curve transformed from a right-skewed distribution to an approximately normal distribution, and was smoother. When corrected by two or three repli-cates, the shape of the two curves was closer to being normalised. For correction by three replicates, the skew-ness of the curve was smaller (1.127) compared to day 1 (1.545), and the kurtosis was also smaller (2.392) than for day 1 (4.348).
Different seasons
The UIC medians (day 1 and two correction methods) for different seasons were all at an adequate level except that for autumn, which was above adequate as shown in
table 2.
Fi was different in different seasons. In spring,
summer, autumn and winter, the values were 0.730, 0.684, 0.706 and 0.703 for two replicates, and 0.809, 0.784, 0.796 and 0.804 for three replicates, respectively. Summer had the lowest Fi, and spring had the highest.
Based on the cut-off value (0.7), summer had different F for two replicates compared to the other seasons. In
on September 22, 2020 by guest. Protected by copyright.
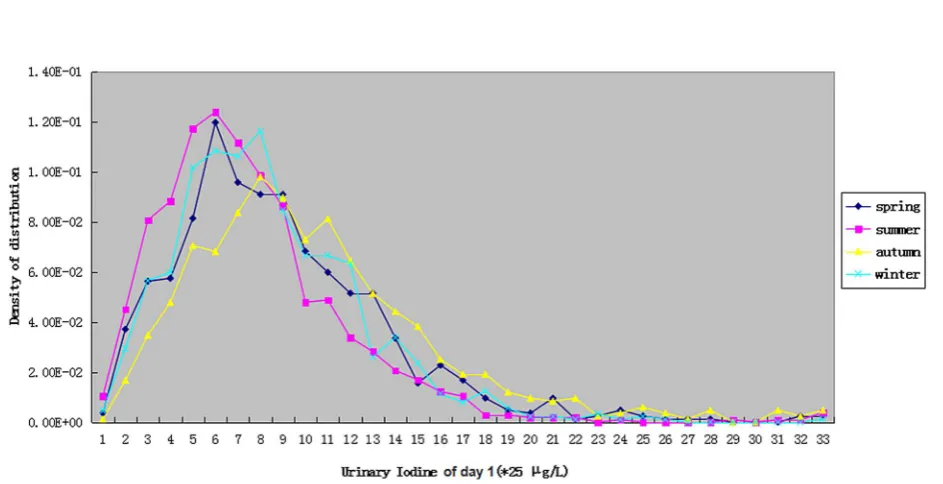
figure 2, the distribution of UIC for day 1 is presented by each of the four seasons: spring was similar to summer, and autumn was similar to winter concerning the shape of the curve, while summer had the smallest UIC median compared to the other seasons.
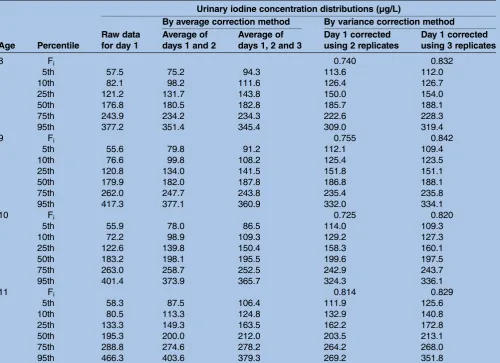
Different ages
The median UIC was adequate for the different age groups, except for the 11-year-old group, which the various correction methods showed had a level slightly above 200 µg/L (table 3).
Fi did not differ much among children aged 8, 9, 10
and 11: calculated by two replicates and three replicates, for children aged 8, it was 0.740 and 0.832; for children aged 9, 0.755 and 0.842; for children aged 10, 0.725 and 0.820; and for children aged 11, 0.814 and 0.829,
respectively. Based on the evaluation standard, all Fi
values were above 0.7, with no difference found between them.
Different sexes
For different sexes of the children, the medians of dif-ferent groups were all at adequate levels (table 4).
The median UIC of boys was near the upper limit of the adequate level. Fi values did not vary much as all
were above 0.7, and were 0.749 and 0.839 for boys and 0.739 and 0.830 for girls, for two and three replicates, respectively.
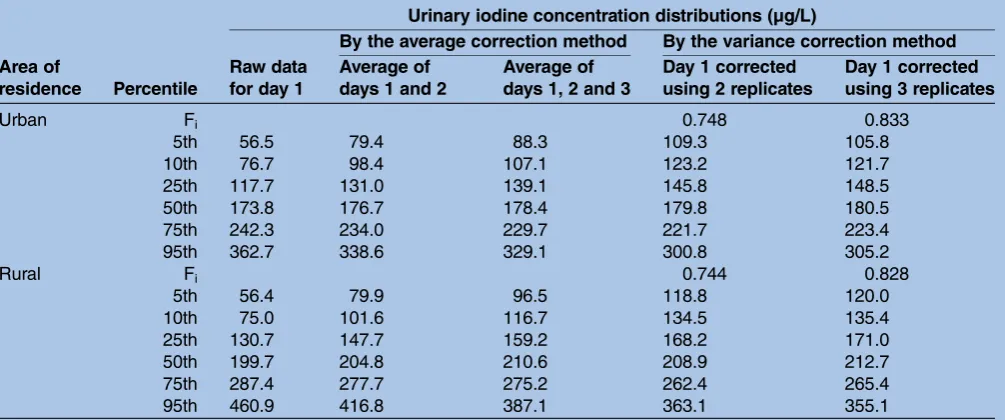
Different settings
The UIC medians of children calculated using different correction methods were different for different settings Figure 1 Population distribution of urinary iodine, according to the number of days of spot urine collection. Ave12, UIC (urinary iodine concentration) of day 1 corrected by average of days 1, 2; Ave123, UIC of day 1 corrected by average of days 1,2,3; Corr12, UIC of day 1 corrected by two replicates; Corr123, UIC of day 1 corrected by three replicates.
Table 1 Urinary iodine concentration distribution of raw data for days 1, 2 and 3, and for day 1 corrected by the average correction method and by the variance correction method
Urinary iodine concentration distributions (µg/L)
Raw data for day 1
Raw data for day 2
Raw data for day 3
By the average correction
method By the variance correction method
Percentile
Average of days 1, 2
Average of days 1, 2 and 3
Day 1 corrected using 2 replicates
Day 1 corrected using 3 replicates
Fi 0.742 0.829
5th 56.5 60.6 61.4 79.6 92.5 114.1 112.2
10th 76.0 83.5 85.7 100.4 111.0 128.4 127.3
25th 122.6 127.2 130.0 138.0 146.4 155.4 156.3
50th 183.1 184.8 189.2 188.5 192.6 192.3 194.8
75th 262.0 259.3 261.0 253.4 250.3 239.2 241.6
95th 414.8 406.1 418.2 382.5 362.8 330.6 335.0
Fi=Sb/(Sb+Sw/di), where Sbis the SD between subjects, Swis the SD within subjects, and diis the number of observations available for each
subject.
on September 22, 2020 by guest. Protected by copyright.
Table 2 Urinary iodine seasonal distribution: raw data for day 1, and for day 1 corrected by the average correction method and by the variance correction method
Season Percentile
Urinary iodine concentration distributions (µg/L)
Raw data for day 1
By the average correction method By the variance correction method
Average of days 1 and 2
Average of days 1, 2 and 3
Day 1 corrected using 2 replicates
Day 1 corrected using 3 replicates
Spring Fi 0.730 0.809
5th 53.0 83.0 99.2 117.6 119.5
10th 75.9 105.7 114.4 134.3 132.5
25th 127.4 143.4 153.1 160.8 163.4
50th 186.1 194.2 199.8 198.2 202.0
75th 267.8 259.9 258.9 246.8 250.1
95th 418.2 388.9 359.1 342.6 331.3
Summer Fi 0.684 0.784
5th 48.0 72.8 89.2 109.0 110.4
10th 66.3 92.6 105.9 119.8 122.0
25th 104.2 124.0 137.6 141.5 146.4
50th 158.6 171.6 179.2 174.1 178.9
75th 222.6 227.3 230.5 211.2 219.1
95th 360.6 344.8 348.6 284.5 312.3
Autumn Fi 0.706 0.796
5th 72.7 92.8 102.7 139.6 131.6
10th 99.4 114.6 123.0 154.0 148.7
25th 153.4 161.0 163.4 186.2 180.3
50th 222.3 216.1 212.8 223.8 218.7
75th 307.8 287.3 276.9 271.3 269.6
95th 513.2 450.3 401.4 385.5 364.7
Winter Fi 0.703 0.804
5th 60.2 75.3 84.9 112.5 107.2
10th 78.4 95.8 106.8 127.6 124.9
25th 123.8 135.4 140.0 153.8 151.7
50th 180.5 185.7 183.3 187.1 185.3
75th 253.5 240.4 237.6 225.3 228.0
95th 378.6 350.5 336.7 302.1 304.6
Fi=Sb/(Sb+Sw/di), where Sbis the SD between subjects, Swis the SD within subjects, and diis the number of observations available for each
subject.
Figure 2 The children’s urinary iodine distribution on day 1 for different seasons.
on September 22, 2020 by guest. Protected by copyright.
(urban and rural). For the rural group, most of the UIC medians were above adequate, while for the urban group, values were all adequate (table 5).
No obvious difference between different groups was found for Fi in the urban (0.748 and 0.833) compared
to the rural (0.744 and 0.828) groups.
DISCUSSION
In previous research, samples were taken once a week over 3 weeks,14 while in our study, samples were taken on three consecutive days. Obviously, subject attend-ance rate will be better using our method compared to sampling over 3 weeks because parents usually know their child’s iodine intake (iodine-containing vitamins, food iodine supplementation and medicine) before the investigation and their child’s school attendance in the coming 3 days. In addition, an investigation over 3 days is easier to conduct regarding preparation, investiga-tors’ travel and accommodation needs, and sample preservation. Comparing to three weeks’ correction, the
3 days’ variance correction method also had satisfied correction effect compared to the 3-week method. However, the children’s iodine intake may have been influenced by the survey, particularly as urine iodine is determined by food consumption during the previous 24–36 h. If the results were independent, appropriate correction would be carried out using the subset of children with either two or three replicates and estimat-ing the within and between sample variance. In this study, a similar analysis method which was slightly dif-ferent from the former approach14 was used to compare the results. In the previous study, the authors investigated community-dwelling older adults in New South Wales, Australia.14 In our study, the UIC of chil-dren in Harbin in China was tested to see if it could be adjusted by this method, which would indicate that the method was feasible and could be used in different populations. Although children are the most surveyed subjects in iodine deficiency disorder monitoring due to their accessibility, their food needs differ from those of older adults.18 Instead of the log transformation Table 3 Urinary iodine distribution by age: raw data for day 1, and for day 1 corrected by the average correction method and by the variance correction method
Age Percentile
Urinary iodine concentration distributions (µg/L)
Raw data for day 1
By average correction method By variance correction method
Average of days 1 and 2
Average of days 1, 2 and 3
Day 1 corrected using 2 replicates
Day 1 corrected using 3 replicates
8 Fi 0.740 0.832
5th 57.5 75.2 94.3 113.6 112.0
10th 82.1 98.2 111.6 126.4 126.7
25th 121.2 131.7 143.8 150.0 154.0
50th 176.8 180.5 182.8 185.7 188.1
75th 243.9 234.2 234.3 222.6 228.3
95th 377.2 351.4 345.4 309.0 319.4
9 Fi 0.755 0.842
5th 55.6 79.8 91.2 112.1 109.4
10th 76.6 99.8 108.2 125.4 123.5
25th 120.8 134.0 141.5 151.8 151.1
50th 179.9 182.0 187.8 186.8 188.1
75th 262.0 247.7 243.8 235.4 235.8
95th 417.3 377.1 360.9 332.0 334.1
10 Fi 0.725 0.820
5th 55.9 78.0 86.5 114.0 109.3
10th 72.2 98.9 109.3 129.2 127.3
25th 122.6 139.8 150.4 158.3 160.1
50th 183.2 198.1 195.5 199.6 197.5
75th 263.0 258.7 252.5 242.9 243.7
95th 401.4 373.9 365.7 324.3 336.1
11 Fi 0.814 0.829
5th 58.3 87.5 106.4 111.9 125.6
10th 80.5 113.3 124.8 132.9 140.8
25th 133.3 149.3 163.5 162.2 172.8
50th 195.3 200.0 212.0 203.5 213.1
75th 288.8 274.6 278.2 264.2 268.0
95th 466.3 403.6 379.3 269.2 351.8
Fi=Sb/(Sb+Sw/di), where Sbis the SD between subjects, Swis the SD within subjects, and diis the number of observations available for each
subject.
on September 22, 2020 by guest. Protected by copyright.
method,14 we adopted a square root transformation method to guarantee the normality of UIC distribution in children. The Fi of our research was 0.742 and
0.829, similar to their results of 0.79 and 0.83; the dif-ference was small and might have been caused by population differences. If Fiapproaches 1, then the
cor-rected UIC for 1 day (day 1) is near the long-term UIC tendency.19 20 Our study included the Fi of different
seasons, ages, sexes and settings to determine if it was different for various population subsets. The results
showed that age, sex and setting subsets make little dif-ference, whereas season has an important influence on Fi. In the previous publication, the median UIC of
dif-ferent seasons was also difdif-ferent.21 22 In summer, fruits and vegetables are more abundant and the diet is more diverse, which may reduce the consumption of food cooked with iodised salt, and cause a decrease in urinary iodine. In addition, physical activity, water con-sumption and sweat production are all increased, which reduces UIC and decreases Fi, that is, the 1-day UIC is Table 4 Urinary iodine distribution by sex: raw data for day 1, and for day 1 corrected by the average correction method and by the variance correction method
Sex Percentile
Urinary iodine concentration distributions (µg/L)
Raw data for day 1
By the average correction method By the variance correction method
Average of days 1 and 2
Average of days 1, 2 and 3
Day 1 corrected using 2 replicates
Day 1 corrected using 3 replicates
M Fi 0.749 0.839
5th 62.0 86.5 98.0 119.6 117.0
10th 83.1 105.4 115.5 133.2 131.7
25th 130.2 144.1 151.5 161.8 161.2
50th 188.9 195.4 197.4 199.2 199.2
75th 269.6 260.7 257.8 247.2 249.2
95th 429.7 402.5 379.0 349.6 346.3
F Fi 0.739 0.830
5th 50.3 71.4 86.5 107.4 105.1
10th 70.4 92.8 106.0 121.3 122.0
25th 114.6 129.9 141.5 147.7 151.0
50th 176.4 181.3 187.0 185.0 189.2
75th 252.4 244.5 243.0 230.4 234.1
95th 390.1 363.8 345.1 319.2 320.6
Fi=Sb/(Sb+Sw/di), where Sbis the SD between subjects, and Swis the SD within subjects, and diis the number of observations available for
each subject.
Table 5 Urinary iodine distribution by city or village, raw data for day 1, and for day 1 corrected by the average correction method and by the variance correction method
Area of
residence Percentile
Urinary iodine concentration distributions (µg/L)
Raw data for day 1
By the average correction method By the variance correction method
Average of days 1 and 2
Average of days 1, 2 and 3
Day 1 corrected using 2 replicates
Day 1 corrected using 3 replicates
Urban Fi 0.748 0.833
5th 56.5 79.4 88.3 109.3 105.8
10th 76.7 98.4 107.1 123.2 121.7
25th 117.7 131.0 139.1 145.8 148.5
50th 173.8 176.7 178.4 179.8 180.5
75th 242.3 234.0 229.7 221.7 223.4
95th 362.7 338.6 329.1 300.8 305.2
Rural Fi 0.744 0.828
5th 56.4 79.9 96.5 118.8 120.0
10th 75.0 101.6 116.7 134.5 135.4
25th 130.7 147.7 159.2 168.2 171.0
50th 199.7 204.8 210.6 208.9 212.7
75th 287.4 277.7 275.2 262.4 265.4
95th 460.9 416.8 387.1 363.1 355.1
Fi=Sb/(Sb+Sw/di), where Sbis the SD between subjects, Swis SD within subjects, and diis the number of observations available for each
subject.
on September 22, 2020 by guest. Protected by copyright.
less representative of the long-term tendency. In con-trast to the above-mentioned study, the distribution curve of the UIC corrected by 3 days had a lower peak than when corrected by 2 days, and from the results, the 3 days’ correction was similar to the 2 days’ correc-tion. This suggests that the two corrections differ little, which could be explained by the correlation coeffi -cients of UIC between non-consecutive days and con-secutive days obtained after removing the individual variances, being both just weakly correlated. According to the reference, when the sample size is above 485, the median UIC of the population will have a precision of above 95% compared to a 24 h urinary iodine deter-mination.12 As our sample size was above 485, the error of the median UIC would be below 10 µg/L, which fit well with the difference between the median UIC of day 1 and the median UIC of the corrected groups.
Although this study improved a previous method and applied it to a different population, more tests of other populations should be carried out in the future. These populations should include adults, pregnant women, lac-tating women and infants. Our method corrects the population distribution of the UIC, so whether it can determine individual iodine nutrition should be tested. One study suggested that 10 spot urine samples or 24 h urine samples were necessary to assess individual iodine status with 20% precision.23 Another reported showed that in a non-fasting state, the middle-morning UIC was more stable from day to day in a single subject, depend-ing on their eatdepend-ing habits, than in various subjects. Thus, a single urine sample even in the non-fasting state may provide rough information about an individual’s iodine status.24 Spot samples would likely be preferable because of their ease of collection. However, the large number of repeated urine samples needed to estimate individual iodine status is a major limitation and empha-sises the necessity of further investigation on more prac-tical bio-markers for measuring individual iodine status. In the future, 24 h urinary iodine should be sampled simultaneously to confirm this variance correction method.
CONCLUSION
In conclusion, the variance correction method can be used in children, who are the most accessible subjects for iodine deficiency disorder surveys. There are small differences between ages, sexes and urban or rural populations, but large difference between seasons. Compared to sampling three spot urines, each 1 week apart, sampling on 3 consecutive days is more feasible for a field survey as the attendance rate will be higher. For children’s UIC, the square root transformation shows better normality than log transformation. Concerning the variance correction method, the UIC of day 1 corrected using two replicates differs little from that corrected using three replicates.
Author affiliations
Key Laboratory of Etiology and Epidemiology, Education Bureau of Heilongjiang Province and Ministry of Health, Center for Endemic Disease Control, Chinese Center for Disease Control and Prevention, Harbin Medical University, Harbin, People’s Republic of China
Acknowledgements The participation of all children in the study is gratefully acknowledged. We also thank the staff of Harbin Center for Disease Control and Prevention for their field work.
Contributors PL and XHJ wrote the manuscript, XHS and YHG designed the study and organised the field survey, ZQS and WW determined the iodine in urinary samples, and DJS had primary responsibility for final content. All authors have read and approved the final manuscript.
Funding This work was supported by grants from the Technology and Education Department of the Ministry of Health, China, grant number 201202012.
Competing interests None declared. Patient consent Obtained.
Ethics approval The Ethics Committee of Harbin Medical University approved this study.
Provenance and peer review Not commissioned; externally peer reviewed. Data sharing statement No additional data are available.
Open Access This is an Open Access article distributed in accordance with the Creative Commons Attribution Non Commercial (CC BY-NC 4.0) license, which permits others to distribute, remix, adapt, build upon this work non-commercially, and license their derivative works on different terms, provided the original work is properly cited and the use is non-commercial. See: http:// creativecommons.org/licenses/by-nc/4.0/
REFERENCES
1. Chan S, Kilby MD. Thyroid hormone and central nervous system
development.J Endocrinol2000;165:1–8.
2. Bernal J. Thyroid hormones and brain development.Vitam Horm
2005;71:95–122.
3. Koibuchi N, Chin WW. Thyroid hormone action and brain
development.Trends Endocrinol Metab2000;11:123–8.
4. Glinoer D, Delange F. The potential repercussions of maternal, fetal,
and neonatal hypothyroxinemia on the progeny.Thyroid
2000;10:871–87.
5. Delange F. Iodine deficiency as a cause of brain damage.Postgrad
Med J2001;77:217–20.
6. Zimmermann MB, Jooste PL, Pandav CS. Iodine-deficiency
disorders.Lancet2008;372:1251–62.
7. Zimmermann MB, Andersson M. Update on iodine status worldwide.
Curr Opin Endocrinol Diabetes Obes2012;19:382–7.
8. Lewis K. Iodine deficiency disorders still prevalent in China.CMAJ
2009;181:E151–2.
9. Erdogan G, Erdogan MF, Emral R,et al. Iodine status and goiter
prevalence in Turkey before mandatory iodization.J Endocrinol
Invest2002;25:224–8.
10. Alsanosy RM, Gaffar AM, Khalafalla HE,et al. Current iodine
nutrition status and progress toward elimination of iodine deficiency
disorders in Jazan, Saudi Arabia.BMC Public Health2012;12:1006.
11. Rasmussen LB, Ovesen L, Christiansen E. Day-to-day and within-day
variation in urinary iodine excretion.Eur J Clin Nutr1999;53:401–7.
12. Andersen S, Karmisholt J, Pedersen KM,et al. Reliability of studies
of iodine intake and recommendations for number of samples in
groups and in individuals.Br J Nutr2008;99:813–18.
13. Emily W, Bruce KA, Rodolfo S. Principles of exposure measurement
in epidemiology: Collecting, Evaluating, and Improving Measures of Disease Risk Factors. Oxford Scholarship Online. 2009. http://www. oxfordscholarship.com/view/10.1093/acprof:oso/9780198509851. 001.0001/acprof-9780198509851 (accessed 17 Nov 2015).
14. Charlton KE, Batterham MJ, Buchanan LM,et al. Intraindividual
variation in urinary iodine concentration: effect of adjustment on population distribution using two and three repeated spot urine
collections.BMJ Open2014;4:e003799.
15. Jianbin C, Xiaoli G, Feifei W,et al. Survey and evaluation of iodine
nutritional status of different populations in Harbin city in 2011.Chin
J Endemiol2012;31:311–14.
on September 22, 2020 by guest. Protected by copyright.
16. Dunn JT, Crutchfield HE, Gutekunst R,et al.Methods for measuring iodine in urine. The Netherlands: ICCIDD, 1993.
17. ICCIDD, UNICEF, WHO.Assessment of iodine deficiency disorders
and monitoring their elimination: a guide for programme managers. World Health Organization, 2007.
18. Australia Government, Department of Health and Aging, National
Health and Medical Research Council. Food for health, dietary guideline for Australians, a guide for healthy eating. 2005, p10.
19. National Research Council.Dietary reference intakes: applications in
dietary planning. Washington DC: The National Academies Press, 2003.
20. Baines J, Cunningham J, Leemhuis C,et al. Risk assessment to
underpin food regulatory decisions: an example of public health
nutritional epidemiology.Nutrients2011;3:164–85.
21. Schulze KJ, West KP, Gautschi LA, et al. Seasonality in urinary
and household salt iodine content among pregnant and
lactating women of the plains of Nepal.Eur J Clin Nutr
2003;57:969–76.
22. Moreno-Reyes R, Carpentier YA, Macours P,et al. Seasons but not
ethnicity influence urinary iodine concentrations in Belgian adults. Eur J Nutr2011;50:285–90.
23. König F, Andersson M, Hotz K,et al. Ten repeat collections for
urinary iodine from spot samples or 24-hour samples are needed to
reliably estimate individual iodine status in women.J Nutr
2011;141:2049–54.
24. Busnardo B, Nacamulli D, Zambonin, L,et al. Restricted
intraindividual urinary iodine concentration variability in nonfasting
subjects.Eur J Clin Nutr2006;60:421–5.
on September 22, 2020 by guest. Protected by copyright.