3(2), Summer 2011, Ser. 63/4
(Previously Journal of Social Sciences & Humanities)
An Acoustic Study of Emotivity-Prosody Interface in Persian Speech Using the Tilt Model
B. Alinezhad Assistant Professor Isfahan University, Isfahan email: [email protected]
E. Vaysi Ph.D Student, linguistics Ferdowsi University, Mashhad
email: [email protected]
Abstract
This paper aims to explore some acoustic properties (i.e. duration and pitch amplitude of speech) associated with three different emotions: anger, sadness and joy against neutrality as a reference point, all being intentionally expressed by six Persian speakers. The primary purpose of this study is to find out if there is any correspondence between the given emotions and prosody patterning in Persian. Such a study considers articulation and perception in the context of spoken communication. For this purpose, the Tilt Model (Taylor 1998, 2000 and 2009) is used to describe the detailed acoustic knowledge of how an utterance is modulated when a Persian speaker’s emotion deviates from neutral to certain emotional and attitudinal states. The results of our statistical analysis indicate that there exists a rather strict acoustic correlation between sadness and neutrality on the one hand, and between anger and joy, on the other. The noticeable acoustic feature which changes as a function of emotion is pitch amplitude, while duration is involved to a lesser degree.
Keywords: emotion, acoustic properties, prosodic patterning, attitudinal states, tilt model, spectral parameters
–––––––––––––––––––––––––––––––––––––––– Received: 01/04/2011 Accepted: 05/15/2011
1. Introduction
At the outset, it would be well to point out what communication is about. To quote Lyons (1995:97): "Communication is not merely an exchange of words. Linguistic, paralinguistic and non-verbal communication elements such as co-speech gestures and non-speech sounds are part of the communication and all convey meaning." Moreover, in a natural communication situation, emotional arousal is a quite complex phenomenon. In this respect, acoustic parameters of speech and prosodic cues such as variation in pitch, intensity, speech rate, duration of vowel and rhythm may be manipulated —exaggerated, diminished, sped up, slowed down— to convey emotions and attitudes. As Laver (1995) said:
prosodic features are available to speaker and listener in order to encode and decode the full emotional speech. Prosodic cues can also provide paralinguistic information such as the speaker’s view, emotion and attitude toward the dialogue partner and the situation. Indeed, all the information contained in speech contributes to the interpretation of the message.
The issue as to which acoustic parameters contribute much more in conveying emotion is a hotly debated topic in several disciplines. However, a more specific study of emotional speech, especially speech technology, seems to enhance the interdisciplinary aspect of this kind of study. This can be considered as a meeting point of diverse disciplines such as linguistics, psychology, phonetics, neuro- psychology and acoustics.
hence a reference point) expressed by six speakers (3 males and 3 females) is obtained. For this purpose, statistic estimations are used in order to investigate the meaningful differences in the acoustic features associated with the four emotions. Such a discriminant analysis is performed in order to investigate the effectiveness of these parameters in emotion categorization in Persian based on the intonation model of the research, i.e. the tilt model. This study can also be viewed as an attempt to shed light on the type of contribution proposed by the tradition of intonation study to the investigation of emotion in speech technology in general, and in speech synthesis, in particular. The advantage of the present research is that language teaching can be benefited from the contrastive study of the phonetic systems of the two languages involved.
In this research, the production aspect is supplemented by the perception one, in view of the fact that the complementarity of the production and the perception processes is the basis of the spoken communication process, and thus firmly establishes the communicative importance of the parameters being studied.
In what follows, we present the main research efforts made by Persian and non-Persian scholars in the field of the newly established discipline designated phonopragmatics.
2. Previous Empirical Studies
The acoustic investigation of emotionally oriented paralinguistic information expressed in speech has received increasing attention over the past years. Williams and Stevens (1972) conducted research to demonstrate the importance of intonation as a medium of expressing emotion in speech. They emphasized the importance of supplementing production studies with perception studies.
emotion in speech were selected as speech samples. This selection was made on the basis of the perception test. An acoustic analysis was carried out on the subset of fourteen utterances (1 speaker × 2 sentences × 7 emotions × 1 trial) successfully conveying the emotion categories, involving the global measures, pitch range, pitch level and speech rate. The pitch curve in all individual utterances was described in terms of the IPA model known as Intonation Perceptual Analysis. The measurements obtained in the study were used as a source of inspiration for speech manipulations. In a series of experiments, Mozziconacci found that pitch level, pitch range and speech rate were systematically varied per emotion around the values found for these parameters in the original speech.
Ladd, Silverman, Bergman, and Scherer (1985) conducted different experiments on the relationship between prosodic cues and emotional states. It was shown that not only fundamental frequency (F0) variation (pitch range) and voice quality had strong effects on listener’s influences of the arousal-related state of the speaker (relaxed, hurried), but also on the inference of cognitively related attitudes and emotions communicated by speech. The result they obtained was that voice quality is a primary means by which speakers project their identity, and their social characteristics (personality, occupation, education and regional origin). They also came to the conclusion that three prosodic cues: F0 range, voice quality and type of pitch contour function independently of each other in conveying emotions and attitudes in speech.
Tickle (1990) addressed methodological issues surrounding cross-cultural studies of speech conveying emotion. She distinguished the influences of biological factors, leading to the expectation of universal expression of emotions across cultures, from those of culturally determined factors, leading to expectations of emotions between cultures.
Laver (1995) emphasized that the prosodic function of conveying the expression of emotion seems to involve both a linguistic and a paralinguistic component, and that it is frequently considered a paralinguistic function, despite the doubts expressed on the subject. He said that the choice of contour would be more related to the type of sentence, while the pitch level and excursion size of the pitch movements would be more related to the speaker’s emotional state.
The pertinence of intonation contour to conveying emotional states and meaning was also demonstrated in Grabe , Gussenhoven , Hann and Post (1997). In their study, an orthogonal design was used, combining high and low preheads with three Dutch pitch accents: H*L, H*LH and L*H, which resulted in six experimental intonation contours. A perceptual experiment was conducted in order to test which of the contours would best convey friendliness, aloofness, irritation, uncertainty and politeness.
Higuchi, Hirari and Sagiska (1997) also carried out an experiment seeking correlation between emotivity and prosodic features such as pitch level, pitch range, and speech rate. The framework of Fujisaki’s model of intonation was used for the analysis, as well as for the synthesis of speech. The results confirmed that utterances produced while conveying different emotions could vary considerably with regards to the prosodic features. The relative height of the pitch accents, and the extent of the final lowering measurements of relative duration of accented and unaccented speech segments were made in order to gain some insights into the internal temporal structure of emotional utterances.
that the prosodic variations of a particular lexical item /bale/ in Persian provides information about their role in the interpretation of different emotions as paralinguistic information. Alinezhad and Vaysi (1386/2007) conducted experimental research seeking various degrees of correspondence between prosodic cues (duration, pitch level and intensity) and paralinguistic information in some samples of speech in Persian. Their analysis demonstrated a noticeable correlation between prosodic features and paralinguistic information in Persian.
Further investigation into the contribution of prosody to emotivity would most probably promise a rich source of information in the investigation of long-term concerns in related fields.
3. Methodology 3.1 Materials and recordings
To collect the speech samples of this research, two different stages, production and perception, were adopted. First, at the production stage, six participants (3 males and 3 females) among the students at the Shahid Chamran University in Ahvaz were asked to produce the utterances. They had no voice pathologies or abnormalities. Nor were they dialect-conscious. Participants' age ranged from 18 to 28. The major source of data for this research project came from dialogues in daily conversations and movies. Five selected utterances were spoken several times, first in a neutral voice and then in an emotive one involving with the feigned emotions of anger, joy and sadness. To achieve a realistic portrayal of emotion, the speakers were instructed to imagine a situational context in which the utterances could appear. They were also asked to act out the different emotions and then express them. The speakers produced the utterances with the four different emotional states until we were satisfied with the expression of the given emotions.
without semantical inconsistency. It must be pointed out that the samples analyzed in this study were uttered with each of the four emotions, i.e. anger, joy, sadness and neutrality. Naturally, using only one speaker puts a restriction on a general interpretation of the results because there can be variations in the expression of emotions depending, for example, on age, sex and idiosyncrasies of the speaker.
The disadvantage of this method, however, is that using it for constructing data may appear to have some unnatural consequences. Thus, the most natural samples are selected out of a big number of utterances which carry the given emotions.
To avoid the unnaturalness of the data, the utterances produced by each speaker were played to some listeners in separate sessions at the second stage. The listener group consisted of 40 undergraduate students who were native speakers of Persian. They were of varying ages and sexes. The listeners were instructed to mark any utterance that sounded as acted or emphasized as unnatural in the questionnaire. The emotional content was evaluated using 5 categories: neutrality, joy, sadness, anger and unnatural or not recognizable emotional content. Only the utterances that were recognized by at least 80% of all listeners were used for our acoustic analysis. These utterances were evaluated as natural and their emotional content was treated as being unambiguous.
3.2 Acoustic parameters and measurements
Considering the model of intonation in the present study, namely the Tilt model, such parameters as pitch range and duration were measured from the corresponding label files.
done and Linear Regression was used to test the correlation between emotions (i.e. neutral, sadness, joy and anger) as independent variables and acoustic features (i.e. duration and pitch amplitude of speech) as dependent variables to test the hypothesis that there exist some significant differences between the emotions expressed and the acoustic cues used by the speakers.
Since this research is conducted in the framework of a model of intonation, it is appropriate to provide a brief description of the Tilt model which we appealed to as the basis of this research.
4. Framework of the Tilt Model of Intonation
Intonation models constitute a tool for representing and interpreting relevant data. They serve to structure the data, facilitate controlling the parameters and the generalization of the results. Conducting research within such a model of intonation enhances the systematic aspect of procedures and also allows for testing whether the specific model can be considered adequate for processing emotional speech. If a piece of research is conducted in the framework of such a model, its results can lead to confirming the usefulness of the corresponding approach of intonation or to refuting assumptions underlying the model in question. Moreover, considering intonation data concerning emotional speech within the theoretical framework of approaches to intonation helps us to understand which parameters, as mentioned in section 3.2, have a prominent role in conveying emotions in speech.
4.1 The Tilt model
The Tilt intonation model is designed to facilitate automatic intonational processing for speech technology applicants. The model represents intonation at a phonetic level as a sequence of parameterized intonational events. From such a representation, it is possible to encode the linguistically relevant information in F0 contours, and then recreate the original F0 from this coding.
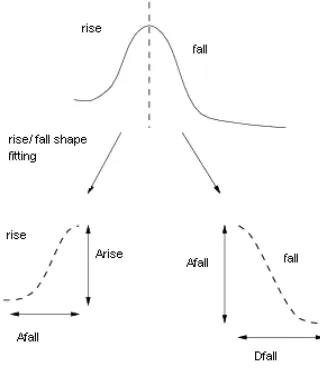
In the Tilt model, intonation is characterized by a sequence of phonetic intonational events shown in Figure 1. There are two kinds of pitch accent: "a", and the boundary tones, "b" .Each event has a rise and fall component which can vary in size, while some events have a zero rise or zero fall component indicating that they only have a fall or a rise respectively. The middle of the event is defined as the end of the rise component or the start of the fall component. Each event is characterized by Tilt parameters which describe its F0 shape. In this model both pitch accent and boundary tones are characterized using the same set of parameters.
In the present investigation, the acoustic parameters of the first three peaks, or events, of the five utterances representing rise and fall components were measured. Intonational events are represented in Figure1.
The Tilt model has been previously used and tested on English, Korean and Japanese databases. As mentioned, the Tilt model facilitates automatic intonational processing. It follows up different stages. The first stage in automatic analysis is to find the events from the waveform. Waveforms are parameterized into F0 and energy. The Tilt parameters for each of the events are then derived. This stage uses an algorithm which examines each event and fits rise or fall shapes by minimizing the error between the original contour and the fitted shape. The result of this process is that each event is now described as a rise shape, a fall shape or a rise followed by a fall shape. This parameterization produces a representation in terms of an underlying model known as the rise/fall connection (RFC model). The Tilt model can be thought of as a further stage to the RFC model, in that it takes RFC parameters and produces a compact intonational representation from them. The RFC model is more fully described in Taylor (1993, 1995).
Figure 2: A pitch accent with marked parameters
A further set of transformations are used to produce an F0 contour by first converting them back into RFC parameters and then using mathematical equations to generate actual contours. The equations are thoroughly given in Taylor (2000) and those that are used in the present study to analyze the data are as follows:
Since the Tilt model is found to be a more appropriate and powerful model for both automatic and hand speech processing, hand speech processing was used to analyze the data in the present study.
5. Data Analysis
What is noteworthy here is that the main concern of this study is to find out the acoustic correlates of the three emotions (i.e. joy, anger and sadness) compared with neutrality as a baseline. For this purpose, descriptive statistics were employed to enable us to have access to the significance level of each acoustic variable with the intended emotions. Thus, Linear Regression Test (LRT) was carried out to analyze the differences significantly.
Each utterance was analyzed in terms of the sex and emotions of the participants as independent variables, and peaks and the rise / fall half of each peak as dependent variables. The null hypothesis and the counterhypothesis were considered with regard to the correlation between the given two variables supported by descriptive and inferential statistics. The significance level given in different tables will determine the sort of the hypothesis under discussion. The significance level is set to be less than 0.05 (p < 0.05). A diagram of the average of each parameter in both halves of the same peak is also shown.
We restricted our work to presenting descriptive and inferential statistical results of the given variables in the first peak of one utterance (i.e. the fourth one). For limitations of space we confined our work to the results obtained for other peaks in the given utterances. It is extremely important to bear in mind that, as far as our investigation is concerned, only the first event (E1) of each utterance was measured and compared.
Notice the following sample utterances:
(1) [d eddi migi! ?az ?u da:vat be k r kardan] You’re kidding! He was called to a job. (2) [V Ge?an! ?emruz mehmun d rim]
Really! We have guests today! (3) [be sal mat! Fard mibinamet]
Bye! See you tomorrow.
Come in! everybody’s been waiting for you. (5) [javad ?az safar barga t xune!]
Javad returned home from a trip!
In the following figures, the spectrographs of the first peak of the sample 4 for three emotions (i.e. joy , anger and sadness), compared with neutral expressions as a baseline, are given:
Figure 3: The spectrograph of the first peak [befarm ?id] for a neutral utterance of sample 4.
Figure 5: The spectrograph of the first peak [befarm ?id] for the expression of anger in sample 4.
Figure 6: The spectrograph of the first peak [befarm ?id] for the expression of joy in sample 4.
In what follows, the correlation between ‘duration’, ‘pitch range’ and ‘tilt’ on the one hand, and the intended emotions on the other hand are examined separately.
5.1 Duration and its correlation with the emotions
As was mentioned in section 5, for limitations of space, we will confine our work to presenting the statistical results of the variables of one peak in the same (i.e. the fourth) utterance for all intended emotions. Then, the total results of all samples will be graphically presented.
emotions (i.e. sadness, joy and anger) in males and females showed no significant difference.
The counterhypothesis: the duration in the first peak (first / second half) of the same utterance related to the specified emotions in both sexes showed a significant difference.
The descriptive statistics of the duration in the first peak of the fourth utterance [befarm ?id! hame montazere om budim] is given in the table below.
Table 1: Descriptive statistics of duration and its correlation with intended emotions in the first peak of the utterance 4:
h al f se x n eu tr al em ot io n es ti m at io n of co ef fi ci en t va ri an ce of es ti m at io n st an d ar di ze d co ef fi ci en t st at is ti ca l h yp ot h es is si gn if ic an ce le ve l fi rs t h al
f Female .620
sadness - .226 .063 - .587 - 3.559 .007 Joy - .302 .063 - .785 - 4.761 .001 anger - .423 .063 - 1.098 - 6.656 .000
Male .557
sadness - .170 .178 - .325 - .957 .366 joy - .239 .178 - .457 - 1.348 .215 anger - .392 .178 - .749 - 2.210 .058
se co n d h al
f Female .130
sadness .342 .103 .810 3.326 .010
joy .386 .103 .915 3.754 .006
anger .192 .103 .454 1.864 .099
Male .706
sadness - .410 .182 - . 725 - 2.259 .054 joy - .327 .182 - .578 - 1.800 .110 anger - .382 .182 - .675 - 2.101 .069
As can be seen in Table 1, considering the level of significance, the following total result can be made:
Figures 7 & 8 show the average of duration in the fourth utterance.
The findings summarized in Table 2 illustrate the general results of the significant correlation between the two given variables.
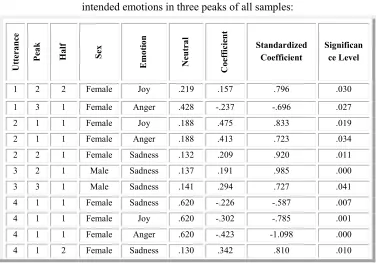
Table 2: Statistics of the total significant correlation between the duration and intended emotions in three peaks of all samples:
U
tt
er
an
ce
P
ea
k
H
al
f
S
ex
E
m
ot
io
n
N
eu
tr
al
C
oe
ff
ic
ie
n
t
Standardized Coefficient
Significan ce Level
1 2 2 Female Joy .219 .157 .796 .030
1 3 1 Female Anger .428 -.237 -.696 .027
2 1 1 Female Joy .188 .475 .833 .019
2 1 1 Female Anger .188 .413 .723 .034
2 2 1 Female Sadness .132 .209 .920 .011
3 2 1 Male Sadness .137 .191 .985 .000
3 3 1 Male Sadness .141 .294 .727 .041
4 1 1 Female Sadness .620 -.226 -.587 .007
4 1 1 Female Joy .620 -.302 -.785 .001
4 1 1 Female Anger .620 -.423 -1.098 .000
4 1 2 Female Sadness .130 .342 .810 .010
Figure 7: Average of the duration of utterance 4, the first half of the first peak
U
tt
er
an
ce
P
ea
k
H
al
f
S
ex
E
m
ot
io
n
N
eu
tr
al
C
oe
ff
ic
ie
n
t
Standardized Coefficient
Significan ce Level
4 1 2 Female Joy .130 .386 .915 .006
4 3 2 Female Sadness .168 .354 .928 .011
5 1 1 Female Anger .188 .224 .997 .004
5 1 1 Male Joy .354 -.057 -.529 .034
5 1 1 Male Anger .354 -.116 -1.070 .001
5 3 2 Male Sadness .213 -.094 -.902 .005
5 3 2 Male Joy .213 -.062 -.600 .032
5 3 2 Male Anger .213 -.093 -.892 .005
As can be observed and according to the test done on the correlation between the duration and the emotions, there is a significant correlation between the two variables in the given samples. So, the null hypothesis was rejected.
The total findings show that the differences statistically considered to be significant are not the same for all utterances. A significant difference was only found for 25% of the related cases which were mostly observable for the emotions of joy and anger in females.
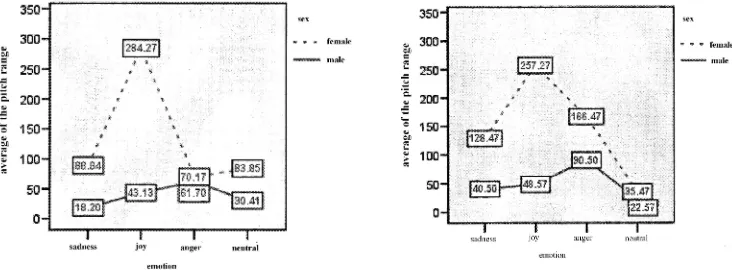
5.2 Pitch range and its correlation with the intended emotions
In what follows the correlation between the pitch range and the given emotions in the fourth utterance will be explored.
The null hypothesis about the pitch range: the pitch range of the utterance in the first peak (first / second half) of the fourth sample expressing emotions (i.e. sadness, joy and anger) in males and females showed no significant differences.
The following table shows the descriptive statistics of the pitch range and its correlation with the intended emotions in the first peak of utterance 4.
Table 3: Descriptive statistics of the pitch range and its correlation with the intended emotions in the first peak of utterance 4:
h al f se x n eu tr al em ot io n es ti m at io n of co ef fi ci en t va ri an ce of es ti m at io n st an d ar di ze d co ef fi ci en t st at is ti ca l h yp ot h es is si gn if ic an ce le ve l fi rs t h al
f Female 83.850
sadness 4.985 29.331 .023 .170 .869 Joy 200.417 29.331 .933 6.833 .000 Anger -13.683 29.331 -.064 -.467 .653
Male 30.405
sadness -12.205 11.400 -.268 -1.071 .316
Joy 12.728 11.400 .279 1.116 .297
Anger 31.295 11.400 .687 2.745 .025
se co n d h al
f Female 35.467
Sadness 93.000 66.543 .388 1.398 .200
Joy 221.800 66.543 .926 3.333 .010 Anger 131.000 66.543 .547 1.969 .085
Male 22.567
sadness 17.933 13.404 .274 1.338 .218
Joy 26.000 13.404 .398 1.940 .088
Anger 67.933 13.404 1.040 5.068 .001
The results summarized in Table 4, attached as Appendix, reveal
some further cases of correlation between the pitch range and the intended emotions in the three peaks of all given samples.
As can be seen in Table 4, in contrast to duration differences, the pitch range parameter is significant in most cases of intended emotions. The results summarized in the table indicate that the emotional changes significantly affect the pitch range parameter. More importantly, a statistically significant effect was found for females in expressing the intended emotions. The total results indicate that there are at least 90% of cases which show statistically significant differences between the two variables in females. So, the null hypothesis is rejected and hence the counterhypothesis is confirmed.
In contrast to sadness, anger and joy showed more statistically significant difference with the pitch range. There exists a significant correlation between anger and the given parameter in 25% of the samples. Most cases of anger were indicated in males.
5.3 Tilt and its correlation with the emotions
We have previously stated in section 5 how the Tilt parameters for each of the events are derived and calculated.
The null hypothesis about the tilt: the tilt of utterance in the first peak (first / second half) of the fourth sample bound to emotions (i.e. Figure 9: Average of the pitch range of
sample 4, the first half of the first peak
sadness, joy and anger) in males and females showed no significant difference.
The counterhypothesis: the tilt in the first peak (first / second half) of the same utterance related to the emotions sadness, joy and anger in males and females showed significant difference.
The following table shows the descriptive statistics of the tilt and its effect on the intended emotions.
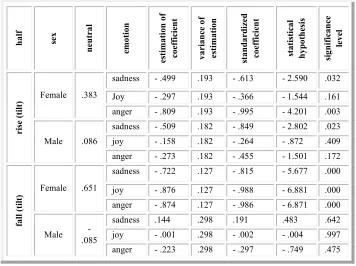
Table 5: Descriptive statistics of the tilt (rise/fall) and its significant correlation with emotions in the first peak of the utterance 4:
h al f se x n eu tr al em ot io n es ti m at io n of co ef fi ci en t va ri an ce of es ti m at io n st an d ar di ze d co ef fi ci en t st at is ti ca l h yp ot h es is si gn if ic an ce le ve l ri se (t il
t) Female .383
sadness - .499 .193 - .613 - 2.590 .032
Joy - .297 .193 - .366 - 1.544 .161 anger - .809 .193 - .995 - 4.201 .003
Male .086
sadness - .509 .182 - .849 - 2.802 .023 joy - .158 .182 - .264 - .872 .409 anger - .273 .182 - .455 - 1.501 .172
fa
ll
(t
il
t) Female .651
sadness - .722 .127 - .815 - 5.677 .000
joy - .876 .127 - .988 - 6.881 .000 anger - .874 .127 - .986 - 6.871 .000
Male .085
-sadness .144 .298 .191 .483 .642 joy - .001 .298 - .002 - .004 .997 anger - .223 .298 - .297 - .749 .475
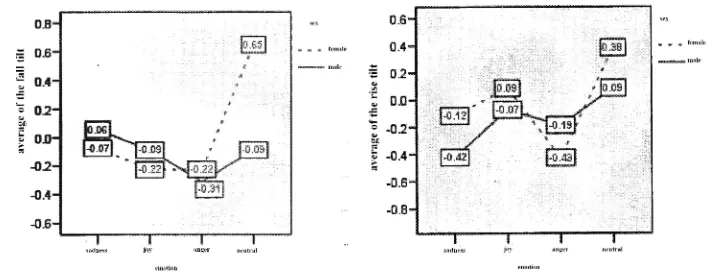
Figure 11: Average of the tilt of sample 4 in the rise half of the first peak
Figure 12: Average of the tilt of sample 4 in the fall half of the first peak The average of the tilt and its correlation with the given emotions in sample 4 is represented in the Figures 11 and 12 below.
The given figures show the deviation from neutrality toward the intended emotions (i.e. anger, joy and sadness) in the fall and rise halves of the first peak in sample 4. The total findings in Table 6 show more cases of correlation between the tilt and the intended emotions.
Table 6: Statistics of the total significant correlation between the tilt and the emotions: sadness, joy and anger in all samples:
U tt er an ce P ea k T il t S ex E m ot io n N eu tr al V ar ia n ce of C oe ff ic ie n t S ta n da rd iz ed C oe ff ic ie n t S ig n if ic an ce L ev el
1 1 Rising Female Sadness .576 -.564 -.734 .041
1 1 Rising Female Anger .576 -.581 -.755 .037
1 3 Rising Female Sadness .407 -.572 -1.000 .002
1 3 Rising Female Anger .407 -.402 -.703 .016
U tt er an ce P ea k T il t S ex E m ot io n N eu tr al V ar ia n ce of C oe ff ic ie n t S ta n da rd iz ed C oe ff ic ie n t S ig n if ic an ce L ev el
3 1 Rising Female Joy -.888 .838 .870 .010
3 1 Rising Female Anger -.888 .653 .678 .032
3 1 Rising Male Sadness -.574 .934 .712 .044
3 1 Rising Male Anger -.574 1.058 .806 .027
3 3 Rising Female Sadness -.534 .568 .909 .009
3 3 Rising Female Joy -.534 .452 .723 .026
4 1 Rising Female Sadness .383 -.499 -.613 .032
4 1 Rising Female Anger .383 -.809 -.995 .003
4 1 Rising Male Sadness .086 -.509 -.849 .023
4 1 Falling Female Sadness .651 -.722 -.815 .000
4 1 Falling Female Joy .651 -.876 -.988 .000
4 1 Falling Female Anger .651 -.874 -.986 .000
4 3 Rising Male Sadness -.127 -.374 -.537 .004
4 3 Rising Male Joy -.127 .342 .491 .006
4 3 Rising Male Anger -.127 .303 .435 .011
5 1 Falling Female Anger -.396 .634 .731 .048
5 2 Rising Female Joy .308 -.356 -.798 .019
5 2 Rising Female Anger .308 -.379 -.850 .014
was generally observable for the intended emotions (i.e.. sadness, joy and anger). As can be seen in Table 6, there exists a significant correlation between the tilt (rise), rather than the tilt (fall) and the given emotions in all samples. Hence, the null hypothesis is rejected. In 64% of the other related cases no statistically significant difference was found between the tilt (rise/fall) and the intended emotions.
6. Results and Discussion
The study revealed that pitch range conveys substantial information about intended emotional states (i.e. joy and anger) and that this parameter is more important than duration and tilt. Thus, among the given prosodic features, pitch range is shown to be pivotal in that it introduces the function of these features as a kind of paralinguistic behavior. In the overwhelming majority of cases (90%), the pitch range parameter was statistically meaningful in the sense that it deviated from neutral emotion toward joy and anger. The duration in 25% and the tilt in 26% of the cases showed significant difference with the intended emotions in this research. These results are partly in accordance with the results of Mozziconacci (1995) and Scherer (1990), which showed that joy and anger correlated with a higher pitch range in emotional speech in Dutch and Hungarian.
Turning to the results and total findings of the present study, it can therefore be concluded that among the prosodic features, pitch range and tilt, respectively, and, to a lesser extent, duration showed statistically significant difference with the intended emotions.
The results of the study also showed that anger and joy on the one hand, and sadness and neutrality on the other hand, have similar acoustic cues.
signal. Rather, it is acoustic features that play a key role in emotional speech.
References
Alinezhad, B. (2010). A study of the relationship between acoustic
features of "bæle" and the paralinguistic information, Journal of
Teaching Language Skills. Shiraz, 2 (1), pp. 1-23.
Alinezhad, B. and Vaysi, A. (1386/2007). Bæræsi-ye rabbet-ye beyn-e vizhegihay-e avashenakhti væ bæyane ævatef dær farsi: motale?-ye mowredi. (Investigating the relationship between applied acoustic features and the expression of emotions in Persian: A case study),In the 7th Linguistics Conference, Iran, 143-165.
Boersma, P., and Weenink, D., (2006). "Praat speech processing software. Institute of phonetic science of the University of Amsterdam. http://www.praat.org
Grabe, E., Gussenhoven, C., Hann, J., Marsi, E., and Post, B. (1997).
Preaccentual pitch and speaker attitude in Dutch, Language and
Speech, 41, 64-86.
Higuchi, N., Hirai, T., and Sagiska, Y. (1997). Effects of speaking style
on Parameters of Fo contours. Springer-Verslag, Newyork,
415-438.
Ladd, D.R., Silverman, K.E.A., Tolkmitt, F., Bergman, G., and Scherer, K.R. (1985). Evidence for the independent function of Intonation Contour type, voice quality and Fo range in signaling speaker affect. Journal of the Acoustical Society of America, 78, 436-445.
Laver, J. (1995), "The Phonetic description of paralinguistic phenomena,
Proceeding of the XIIIth International Congress on Phonetic
Sciences. Stockholm, Sweden, 144-153.
Lyons, J. (1995). Linguistic semantics: An introduction. London:
Cambridge University Press.
Mozziconacci, J.L. (1984). "Prosody and emotion. The Netherland:
Mozziconacci, J.L. (1995). Pitch variations and emotion in speech.
Proceeding of the XIIIth International Congress on Phonetic
Sciences, Stockholm, Sweden, 1, 178-182.
Scherer, K.R. (1990). Emotional expression in speech and music,
London: MacMillan.
Scherer, K.R. (1995) . Expression of emotion in voice and music, Journal of Voice, 9, 234-49.
Taylor, A.P. (1992). A phonetic model of English intonation: A thesis
submitted for the degree of Doctor of Philosophy, UK: University of Edinburg.
Taylor, A.P. (1993). Acoustic recognition of intonation from Fo Contours
using the rise/fall connection model. In the Processing of Euro
speech, Berlin, 164-178.
Taylor, A.P. (1995). The rise/fall connection model of intonation. Speech
Communication, 1, 168-187.
Taylor, A.P. (1998). The tilt intonation model. Centre for speech
Technology Research. University of Edinburg, UK.
Taylor, A.P. (2000). Analysis and synthesis of intonation using the tilt
model. Journal of the Acoustical Society of America, 107 (3),
1703-1718.
Taylor, A.P. (2009). Text to speech synthesis. Cambridge: Cambridge
University Press.
Tickle, A. (1990). Cross-language vocalization of emotion,
methodological issues. Proceedings of ICPHS 99. San Francisco,
USA, 305-308.
Williams, S.C.E, and Stevens, K. N. (1972). Emotion and speech: Some
acoustical factors. Journal of the Acoustical Society of America, 52,
Appendix
Table 4: Statistics of the total significant correlation between the pitch range and the intended emotions in all given samples:
U tt er an ce P ea k H al f S ex E m ot io n N eu tr al V ar ia n ce of C oe ff ic ie n t S ta n da rd iz ed C oe ff ic ie n t S ig n if ic an ce L ev el
1 1 1 Female Joy 127.567 207.657 .738 .015
1 1 2 Female Joy 29.133 280.567 .906 .007
1 2 1 Female Joy 44.481 198.219 .932 .003
1 2 1 Male Anger 16.250 62.350 .909 .006
1 2 2 Female Joy 63.867 180.867 .742 .020
1 2 2 Female Anger 63.867 158.467 .650 .035
1 2 2 Male Anger 23.100 82.333 .765 .023
1 3 1 Male Anger 19.450 79.083 .988 .000
1 3 2 Male Anger 21.800 31.667 .740 .027
2 1 1 Female Joy 45.443 137.157 .809 .003
2 1 1 Female Anger 45.443 152.190 .897 .002
2 1 1 Male Anger 44.115 53.852 .782 .046
2 1 2 Female Joy 26.467 153.067 .943 .000
2 1 2 Female Anger 26.467 123.283 .760 .001
2 1 2 Male Anger 23.067 47.000 .835 .028
2 2 1 Female Sadness 35.199 77.035 .523 .033
2 2 1 Female Joy 35.199 156.168 1.061 .001
2 2 1 Female Anger 35.199 103.068 .700 .009
2 3 1 Female Joy 25.667 154.600 .724 .039
2 3 1 Female Anger 25.667 175.567 .822 .023
2 3 2 Female Joy 22.867 139.833 .731 .034
2 3 2 Female Anger 22.867 161.833 .846 .018
2 3 2 Male Anger 20.633 71.100 .896 .008
3 1 1 Female Joy 10.100 55.433 .915 .005
3 1 1 Male Joy 6.733 24.133 .715 .012
U tt er an ce P ea k H al f S ex E m ot io n N eu tr al V ar ia n ce of C oe ff ic ie n t S ta n da rd iz ed C oe ff ic ie n t S ig n if ic an ce L ev el
3 2 2 Female Joy 29.433 136.467 .738 .047
3 3 1 Female Sadness 9.150 96.950 .430 .037
3 3 1 Female Joy 9.150 241.783 1.073 .000
3 3 2 Female Joy 33.933 263.233 1.069 .000
4 1 1 Female Joy 83.850 200.417 .933 .000
4 1 1 Male Anger 30.405 31.295 .687 .025
4 1 2 Female Joy 35.467 221.800 .926 .010
4 1 2 Male Anger 22.567 67.933 1.040 .001
4 2 1 Female Joy 69.788 142.645 .772 .042
4 3 1 Female Sadness 32.350 81.750 .623 .030
4 3 1 Female Joy 32.350 133.150 1.014 .003
4 3 2 Female Joy 16.933 155.000 .995 .004
5 1 1 Female Joy 21.900 118.967 .998 .001
5 1 1 Male Joy 36.343 65.120 .991 .000
5 2 1 Female Joy 38.678 101.089 .918 .009
5 2 2 Female Joy 20.500 124.800 1.042 .001
5 2 2 Female Anger 20.500 77.300 .646 .011
5 3 1 Female Joy 25.367 89.567 .914 .005
5 3 2 Female Joy 20.733 73.567 .946 .003

![Figure 3: The spectrograph of the first peak [befarmΑ?id] for a neutral](https://thumb-us.123doks.com/thumbv2/123dok_us/525299.2052352/13.595.156.475.510.648/figure-spectrograph-peak-befarma-id-neutral.webp)
![Figure 5: The spectrograph of the first peak [befarmΑ?id] for the expression of](https://thumb-us.123doks.com/thumbv2/123dok_us/525299.2052352/14.595.157.478.378.502/figure-spectrograph-peak-befarma-id-expression.webp)