Original Article
Spatial Analysis and Source Identification of PM
10Particle
Matter in Yazd
Mohammad Miri1, Sara Jamshidi1, Zahra Derakhshan1, Abdolmajid Gholizade1, Hossein Karimi1,Mohsen Yazdani Aval2, Shabnam Amanalikhani1, Seyed Yaser Hashemi3
1.
Department of Environmental Health Engineering, Faculty of Public Health, Shahid Sadoughi University of Medical Sciences, Yazd, Iran.
2.
Department of Occupational Health Engineering, Faculty of Medical Sciences, Tarbiat Modares University, Tehran, Iran.
3.
Department of Environmental Health Engineering, School of Public Health, Tehran University of Medical Sciences, Tehran, Iran.
Received: 2015/11/12 Accepted: 2016/02/15
Abstract
Introduction: This study aimed to spatially analyze PM10 concentrations in the ambient air in Yazd during two
seasons, and mapping by the using Kriging interpolation method. Moreover, different factors affecting the concentrations of PM10were marked and standards were also investigated.
Materials and Methods: Measurement of PM10 particulates was performed by the monitoring device HAZ-DUST
EPAM 5000. In the present study, 13 sampling stations were identified in various areas of the city in order to take samples of PM10 in winter and spring in 2013. Eventually, Arc GIS software, kriging interpolation method and
spatial autocorrelation were used for PM10 spatial distribution.
Results: The spring seasonal mean of PM10 (155μg/m3) was reported to be higher than its amount in winter
(27.87μg/m3
). At 11 stations (out of 13 stations), PM10concentrations were higher than the WHO standards in
winter. Seasonal mean of PM10 concentrations in spring exceeded WHO standards in all stations. Particulate matter
levels were higher in high-traffic and old areas compared to other regions. RMSE index was reported 45.493 and 56.525 in winter and spring, respectively.
Conclusion: PM10 concentration revealed the random spatial pattern in the two seasons. This study revealed traffic
and historical places affecting the PM10 concentration. Key words: GIS; kriging; Particulate matters;
Corresponding author: Tel: +989194488548 Email: [email protected]
Introduction
Regarding the cities expansion and population
increase, every year, thousands of mortalities are
fixed by the acute effects of air pollution. The
major cause of this pollution can be excessive
traffic and vehicles used in the industrial
development, which can lead to increased
consumption of fossil fuels and consequently,
the impure air will be ascending. Despite the fact
that the presence of very low concentrations of
air pollutants within the standard ranges should
not have adverse effects on human health, it can
be harmful to the sensitive groups [1]. However,
pollution due to fuel combustion process in the
developed countries has significantly decreased
during recent years and the new air pollutants
have newly emerged as the greatest health
concerns in the urban areas such as ozone, NO2,
as well as changes in the distribution and size of
particulate matters. Some of these particles are
produced by the incomplete combustion of fossil
fuels which can pollute the soil through
precipitation after emitting into the atmosphere.
On the other hand, environmental pollution
caused by industrial activities, such as
Petrochemical, Oil and similar industries occur
in the soil [2]. Epidemiological studies show that
air pollution in cities in the past two decades has
led to breathing problems, heart disease, chronic
bronchitis and even mortality [3]. Results of
different studies indicate biological mechanisms
of pollutants that affect human health, have not
been yet clearly identified, which are likely to be
the result of pollutants oxidation potential from
two directions: the direct effects on the cellular
components of the airways and the oxidation of
the activated intracellular routes[4]. WHO's
reports show that particulates smaller than 10
microns and SO2 can cause respiratory and
cardiovascular diseases such as asthma,
bronchitis, heart attacks, lung function
interference and even mortality, as mortality
caused by particulate matters smaller than 10
microns in some cities in Europe consequently
causes an increase of 6% in mortality [5]because
of an increase in the concentration of 10
micrograms per cubic meter. Different methods
have been introduced in order to estimate air
pollution, among which integrating air pollution
monitoring station data by spatial analysis
methods can be mentioned[6]. Kriging model can
be placed among the most commonly used
methods of spatial analysis. This interpolation
method is based on regression, which not only
focuses on the distance between the measured
points, but it also focuses on the correlation
between the measured points [7, 8]. In a study
conducted on air quality in Mashhad, Akbari et
al.[7], using IDW interpolation method based on
the PSI index,proposed that the air quality was
very unhealthy and dangerous in Spring 2008,
and the unhealthy situation was generally
reported in all the seasons. In the present study,
particulate matters and carbon monoxide were
used to determine the PSI index. In another
study conducted by Jahanshiri in Mashhad in
2008 [9], the concentration of carbon monoxide
and particulate matters were reported higher
than the other pollutants. In fact,This study was
aimed to do a spatial analysis of PM10
concentrations in the ambient air of Yazd in the
winter and spring and mapping via using
Kriging interpolation method. Finally, different
factors affecting the concentrations of PM10have
been marked and some standards have been
investigated.
Materials and Methods
The Study Area
Yazd is the most populous city as well as the
political and administrative capital of Yazd
province which is located at latitude of 54º and
longitude of 31º in the center of Iran. The
population in Yazd is 560,000, of which,
500,000 people live in the urban areas and the
rural population is about 60,000. The climate is
hot and dry with a desert situation and the
annual rainfall is 50 mm. Figure 1 shows the
area under investigation and the sampling points.
Figure(1) Study area and sampling location
Data collection
Measurement of PM10 was performed by the
monitoring device HAZ-DUST EPAM 5000.
This device has the capability to quickly respond
and record the information related to harmful
particles that can affect respiratory system.
Regarding weight studies, according to EPA and
TEOM, this device measured individual
particles to measure the particulate separator
with 47 mm filters, measured in two ways: light
and weighting. Display of measured data and the
ability to transfer information directly, graphic
profiles of measured data and set up in less than
15 seconds can be named as the advantages of
the device. The sampled air is passed through an
optical sensor, and then the sampled air passes
through a 7 mm weighted filter that installed
exactly after the optimal sensor. The filter is
designed according to EPA standards. Using the
device is really simple, which can be quickly set
up used to measure PM1, PM2.5, PM10, and TSP.
Thirteen sampling stations were selected done in
the open air, according to EPA standards at a
distance of 20 meters from the street and other
sources of pollution at an elevation of 15 meters
above the ground level. Sampling locations were
selected based on proximity to the industrial
areas, a low-traffic area, an area with continuous
traffic, high traffic area and suburb. In the winter
and spring of 2013, the samples were taken
randomly for one week per month and finally
the seasonal mean of PM10 was used in regard
with modeling and spatial analysis.
Spatial Analysis
To analyze spatial data related to the
PM10concentrationin the air, Yazd software Arc
GIS 10.1 was used produced by ESRI Company.
To assess the arrangement of PM10
concentration data in space, to see whether their
distribution is arbitrary or not, and to show the
correlation between points and spatial
changeability of the studied phenomena (air
quality), autocorrelation analysis (Moran’s
index) of the model was utilized.
Kriging Method
Kriging is an interpolation technique in which
the surrounding measured values are weighted to
derive a predicted value for an unmeasured
location. The weights are based on the distance
between the measured points, the prediction
locations, and the overall spatial arrangement
among the measured points. Kriging is regarded
unique among the interpolation methods in that
it provides an easy method for characterizing the
variance, or the precision of predictions. As a
matter of fact, it is based on the regionalized
variable theory, which assumes that the spatial
variation in the data being modeled is
homogeneous across the surface. That is, the
same pattern of variation can be observed at all
locations on the surface [10]. In general, the
success of this method in the interpolation of
variables, totally depends on the chosen model
with semivariogram experimental data. If the
chosen model is not sufficiently accurate,
interpolation results cannot be appropriate. In
some cases, due to such reasons as lack of
spatial harmonic general structure, low accuracy
of data and spatial heterogeneity of the data, the
results of this approach are not sufficiently
accurate. To investigate the changes in the
spatial and temporal concentration of PM10 in
the air of Yazd, ordinary kriging method was
used, which uses spatial correlation phenomena
structure for estimating spatial distribution. The
ordinary kriging method can be considered in
regard with interpolation of each point in the
specified range of points. It should be noted that
coordinates of the points are sampled in the
UTM system. General equation is as follows:
(1) ( ) ∑ ( )
Where Z*(xi) is grade estimation, iλ is weight or
importance relative units of i and z (xi) is the
value of measured variable.
Evaluating the Correctness of Used Model
and Variogram
Model validation was performed using the
following evaluation criteria (11):
(2) √ ∑ ( )
(3) ( )
Where n is the number of data, qi is the
measured value, qˆi is the value predicted by the
model and μ is the mean of each factor being
measured. The RMSE (Root Mean Square Error)
can be applied in optimal estimation or in a case
where both the estimated and measured values
are equal to zero. The smaller the RMSE, the
safer the predictive interpolation method will be.
Since RMSE is sensitive to outlier data,
RMSE% can be used. Acceptable RMSE% is 40
and RMSE% higher than 70% is a sign of
uncertainty in estimating the large variations
between the estimated and measured values (12).
Results
PM10 Concentration
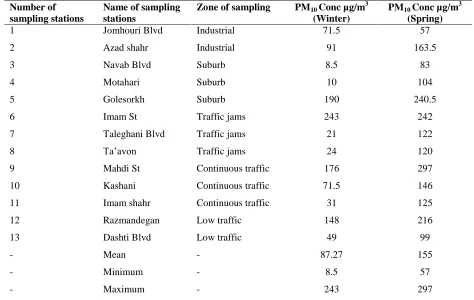
A statistical summary of the sampling sites in
Yazd is given in Table 1. Based on the
information given in this Table, PM10 seasonal
average concentration in spring (155μg/m3) is
more than its amount in winter (27.87μg/m3).
The maximum concentration of pollutants was
observed at the Station No. 9 (297μg/m3) in the
spring, whereas the lowest concentration of
PM10 was at the Station No. 3 in winter (μg/
m35. 8).
Table 1: Summary statistics for PM10 air sampling stations in Yazd Number of
sampling stations
Name of sampling stations
Zone of sampling PM10 Conc µg/m 3
(Winter)
PM10 Conc µg/m 3
(Spring)
1 Jomhouri Blvd Industrial 71.5 57
2 Azad shahr Industrial 91 163.5
3 Navab Blvd Suburb 8.5 83
4 Motahari Suburb 10 104
5 Golesorkh Suburb 190 240.5
6 Imam St Traffic jams 243 242
7 Taleghani Blvd Traffic jams 21 122
8 Ta’avon Traffic jams 24 120
9 Mahdi St Continuous traffic 176 297
10 Kashani Continuous traffic 71.5 146
11 Imam shahr Continuous traffic 31 125
12 Razmandegan Low traffic 148 216
13 Dashti Blvd Low traffic 49 99
- Mean - 87.27 155
- Minimum - 8.5 57
- Maximum - 243 297
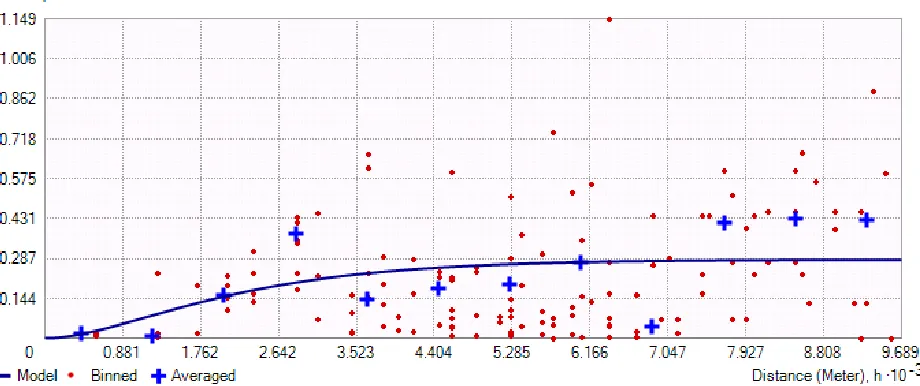
Spatial Distribution
Various semivariograms, two logarithmic
methods and Box-Cox were used to normalize
the data through spatial analysis and PM10
mapping via kriging method. Finally, based on
the lowest RMSE, hole-effect semivariogram
was applied for the data related to the winter
(figure 2) and K-Bessel semivariogram along
with Box-Cox normalization method was used
for the data related to the spring (figure 3).
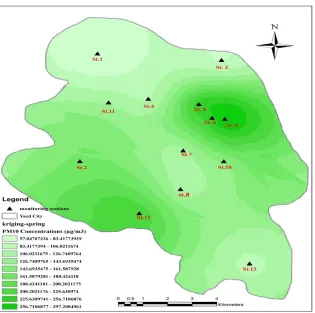
Figures 4 and 5 demonstrate mapping of PM10
concentrations in winter and spring,
respectively. Due to the ring road along the
northwest to the southwest as well as the
presence of industrial estates the city has a
higher concentration of particulate matters in
West and South West in winter. In spring, in
addition to the West and South West, Eastern
region also has high concentrations of PM10
pollutants. Northeast (sampling stations 5, 6 and
9) is located in the historical context that can
raise the amount of pollution in this area in
addition to a heavy traffic at Imam Street
(Station 6).
Figure (2) Hole-effect semivariogram for mapping PM10 concentration in the winter
Figure (3) K-Bessel semivariogram for mapping PM10 concentration in the spring
Figure (4). The mapping of PM10 concentrations via kriging method in winter
Figure (5). The mapping of PM10 concentrations via kriging method in spring
To study the efficiency of Kriging model for
zoning PM10 in Yazd, two RMSE and RMSE%
indicators were also applied. RMSE values in
winter and spring were reported 45.493 and
56.525, respectively. Due to lower data means in
sampling sites and the absence of outliers,
RMSE values seem to be smaller in the winter.
RMSE% values were 52% in the winter and
36% in the spring that indicates an average
efficiency of the kriging model with respect to
zoning the particulate matter in winter and
spring . The nugget to sill ratio was equal to zero
for the two seasons.
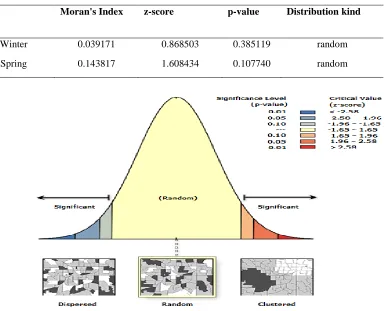
Spatial Autocorrelations
In the present study, Moran's correlation was
utilized. This factor demonstrates that the spatial
pattern of the data is cluster-like, disperse,
and/or random (See Table 2). Based on this
statistical test, PM10 was concluded to have a
random spatial pattern in winter and summer.
Figures 6 and 7 illustrate the graphical Z value
range for dispersed (z-score < -1.65), random
(-1.65<z-score < 1.65), and clustered (z-score
>1.65) spatial distribution patterns in winter and
spring, respectively. Hence, the main source of
PM10 concentration in Yazd seems to be mobile
sources. On the other hand, the exhaust
emissions might be taken into consideration as
the main sources.
Table 2: Spatial autocorrelation (Moran's index) of PM10 concentration in Yazd
Moran's Index z-score p-value Distribution kind
Winter 0.039171 0.868503 0.385119 random
Spring 0.143817 1.608434 0.107740 random
Figure (7) Spatial distribution pattern of PM10 concentration in spring
Discussion
Spatial analysis and PM10concentration were
studied in winter, in 2013 and in spring in 2014
in Yazd. The study samples were taken from
different parts of the city and eventually, zoning
was done using Kriging interpolation method.
The mean concentration of PM10 in the spring
was more than its concentration in the winter.
Moreover, contaminant concentrations in the
areas with heavy traffic and in the historical
context of the city, as well as the areas close to
the ring road, were held to be higher than the
amounts in other areas. PM10 concentrations
were higher than the WHO standards (20μg/m3 )
[13]
in winter at 11 stations out of 13 stations.
Seasonal mean of concentrations in spring were
exceeding WHO standards in all the stations. At
station No.9, the concentration was 14.8 times
higher than WHO standards in the spring.
Shahsavani et al. [14] analyzed the dust input of
the Khoozestan province and realized that the
particulate concentration in dusty days increased
to 16.5 times more than the standard level in
Ahvaz. Hoseinzade et al. (2013) [15] in a study in
Hamedan, reported that the mean concentrations
of the total suspended particles (TSP), PM10 and
PM2.5 were 16, 7.72 and 4.7 times greater than
the World Health Organization (WHO) air
quality standard, respectively. Naddafi et al.[16],
in a study conducted on the particulate matters
in Yazd in 2007, proposed that the
concentration of particulates in spring is higher
than other seasons of the year that is in
accordance with the findings of present study.
Jamshidi et al. [17] in a study in 2005 also
reported that the amount of particulate matter in
February and April was reported to be higher
than the amounts in the other months of the year.
Due to %RMSE, Kringing model had a good
performance in zoning PM10 in the ambient air.
Several studies have revealed that Kringing
model has a better performance in air pollution
zoning compared to other interpolation methods.
It has been demonstrated in a study conducted
by Noorpour et al. [18] in Tehran, the spatial and
temporal variations of sulfur dioxide, nitrogen
dioxide and particulate matter were determined
via applying GIS techniques. It is worth
mentioning that capability of the ordinary
kriging model among different models is much
higher than other methods which is used for
zoning the air pollution at the conditions where
spherical semivaroigram with an RMSE of 17.47
is applied. In a study by Berman et al. [19], to
evaluate different models of spatial analysis for
zoning the concentration of ozone in America,
R2 and RMSE for the IDW and kriging model
were 0.74, 8.163 and 0.79, 6.983, respectively.
This study also showed a higher efficiency of
Kriging model than IDW method in zoning the
air pollution.
Conclusion
The present study demonstrated that traffic and
location factors had a significant impact on the
amount of particulate matters in the air. Areas
with heavy traffic and the ones close to the main
streets, as well as historic areas with mud can be
influential in the increase of particles
concentrations. It was also revealed that the
concentration of particles in both winter and
spring is higher than the WHO standards. As a
result, in order to prevent the adverse effects of
these pollutants on the inhabitants of the city,
necessary arrangements such as developing the
public transportation, replacing the old cars,
increasing green areas, restoring historical
context and giving health recommendations to
people, should be taken into consideration
especially on the days with high pollution.
Acknowledgements
The authors are pleased to express their
sincerely gratitude to the laboratories at the
School of Public Health in Shahid Sadoughi
University of Medical Sciences of Yazd and all
those who did not withhold their generous
assistance to this research.
References
1. De Meij A, Thunis P, Bessagnet B, et al. The sensitivity of the CHIMERE model to emissions reduction scenarios on air quality in Northern Italy. Atmospheric Environment. 2009;43(11):1897-907.
2. Downs SH, Schindler C, Liu L-JS, et al. Reduced exposure to PM10 and attenuated age-related decline in lung function. New England Journal of Medicine. 2007;357(23):2338-47.
3. Fattore E, Paiano V, Borgini A, et al. Human health risk in relation to air quality in two municipalities in an industrialized area of Northern Italy. Environmental research. 2011;111(8):1321-7.
4. Glinianaia SV, Rankin J, Bell R, et al. Particulate air pollution and fetal health: a systematic review of the epidemiologic evidence. Epidemiology. 2004;15(1):36-45.
5. Pollution WPMA. how it harms health. Fact sheet EURO/04/05, Berlin, Copenhagen, Rome. 2005;4:14. 6. Erxleben J, Elder K, Davis R. Comparison of spatial interpolation methods for estimating snow distribution in
the Colorado Rocky Mountains. Hydrological Processes. 2002;16(18):3627-49.
7. Akbari E, Mohammadnia M, Mozaffari Zk. Modeling of Air Pollution in Mashhad City using PSI Index by GIS. National Conference on Air Flow and Pollution University of Tehran 2012 [persian].
8. Diggle P, Moyeed R, Rowlingson B, et al. Childhood malaria in the Gambia: a case‐study in model‐based geostatistics. Journal of the Royal Statistical Society: Series C (Applied Statistics). 2002;51(4):493-506. 9. Jahangiri M. survey statically and kinetically of air pollution in Mashhad city. mastery of science dissertation
in climatology School of geographic and environmental science, Hakim University. 2012. (persian).
10. Xu C-y, Gong L, Jiang T, et al. Analysis of spatial distribution and temporal trend of reference evapotranspiration and pan evaporation in Changjiang (Yangtze River) catchment. Journal of Hydrology. 2006;327(1):81-93.
11. Mehrjardi RT, Jahromi MZ, Heidari A. Spatial Distribution of Groundwater Quality with Geostatistics (Case Study: Yazd-Ardakan Plain) World Applied Sciences Journal. 2008;4(1):09-17.
12. Hengl T, Heuvelink GB, Stein A. A generic framework for spatial prediction of soil variables based on regression-kriging. Geoderma. 2004;120(1):75-93.
13. Rodríguez-Cotto RI, Ortiz-Martínez MG, Rivera-Ramírez E, et al. Particle pollution in Rio de Janeiro, Brazil: Increase and decrease of pro-flammatory cytokines IL-6 and IL-8 in human lung cells. Environmental Pollution. 2014;194:112-20.
14. Shahsavani A, Yarmoradi M, Mesdaghinia A, et al. Analysis of Dust Storms Entering Iran with Emphasis on Khuzestan Province. Hakim Research Journal. 2012;15(3):192-202 [persian].
15. Hoseinzadeh E, Samarghandi MR, Ghorbani Shahna F, et al. Isoconcentration mapping of particulate matter in Hamedan intercity bus stations. Water and Environment Journal. 2013;27(3):418-24.
16. Naddafi K, Ehrampush M, Jafari V, et al. Investigation of total suspended particles and its ingredients in the central part of Yazd. Journal of University of Medical Sciences Health Services of Shahid Sadoughi Yazd. 2008;16(4):21-5[persian].
17. Atafar Z, Eslami A, Pirsaheb M, et al. Investigation of suspended particles pollution in Kermanshah air. Journal of Health in the field. 2015;2(1). [persian] Available in http://journals.sbmu.ac.ir/jhf/article/view/5633.
18. Alireza Norpoor, Feyz MA. Determination of locality and time change in concentration of SO2 , NO2 and particle matter by GIS techniques in Tehran city. Environment logy. 2014;40(3):723- 38.
19. Berman JD, Breysse PN, White RH, et al. Evaluating methods for spatial mapping: Applications for estimating ozone concentrations across the contiguous United States. Environmental Technology & Innovation. 2015;3:1-10.