EditorS-in-ChiEf
Børge Obel, Aarhus University, Denmark
Charles C. Snow, Penn State University, United States
ASSoCiAtE EditorS
Richard M. Burton (Point of View Articles), The Fuqua School of Business, Duke University, United States Dorthe Døjbak Håkonsson (Translational Articles), Aarhus University, Denmark
Samina Karim (Research Articles), Boston University, United States Peter Klaas (Translational Articles), Aarhus University, Denmark Phanish Puranam (Research Articles), INSEAD, Singapore
EditoriAl BoArd
Linda Argote, Carnegie Mellon University, United States Carliss Baldwin, Harvard Business School
Michael Beer, Harvard Business School, United States
Julian Birkinshaw, London Business School, United Kingdom Magnus Broundal, VELUX A/S, Denmark
Anne Bøllingtoft, Aarhus University, Denmark
Laura B. Cardinal, C. T. Bauer College of Business, University of Houston, United States Timothy N. Carroll, University of South Carolina, United States
Joe Cheng, Australian School of Business, University of New South Wales, Australia Lex Donaldson, University of New South Wales, Australia
Diem Ho, IBM
George P. Huber, University of Texas, United States
Sirkka Jarvenpaa, University of Texas, USA and Aalto University, Finland Thorbjørn Knudsen, University of Southern Denmark, Denmark
Tobias Kretschmer, Ludwig-Maximilians-Universität München, Germany
Kristina Lauche, Nijmegen School of Management, Radboud University Nijmegen, Netherlands Christopher Lettl, Vienna University, Austria
Zhiang John Lin, University of Texas at Dallas, United States John A. Mathews, Macquarie University, MGSM, Australia
Raymond E. Miles, University of California, Berkeley, United States Georges Romme, Eindhoven University of Technology, Netherlands Henk W. Volberda, Erasmus University, Netherlands
EditoriAl offiCE
Marianne Sejthen, Aarhus University, Denmark
Journal of Organization Design ISSN: 2245-408X
© 2014 by Organizational Design Community
TABLE OF CONTENTS
rESEArCh ArtiClES
The Impact Of Organizational Structure On Internal And External Integration:
An Empirical, Cross-Regional Assessment ...1-17
By Xenophon Koufteros, Xiasong (David) Peng, Guanyi Lu, and Richard Peters
Fit Between Organization Design and Organizational Routines ...18-29
By Constance E. Helfat and Samina Karim
Organization Design for Dynamic Fit: A Review and Projection ...30-42
By Mark Nissen
Point of ViEw ArtiClES
Navigating New Legal Demands for Franchisor Accountability ...43-47
By Carolyn M. Plump and David J. Ketchen, Jr.
CASE Study
How To Design A Triple Bottom Line Organization: A Start-Up Case Study ...48-57
By Bernhard Schroeder and Alex DeNoble
MEMoriAl
Jay R. Galbraith Memorial Project ...58-73
1 Journal of Organization Design
JOD, 3(2): 1-17 (2014)
The ImpaCT Of
OrganIzaTIOnal STruCTure
On InTernal anD exTernal
InTegraTIOn
an empIrICal, CrOSS-regIOnal
aSSeSSmenT
XenOphOn KOufterOs • XiasOng (DaviD) peng guanyi Lu • richarD peters
abstract: We examine the effects of organizational structure on cross-functional integration,
supplier integration, and customer integration, and we assess whether such effects vary by
geographical region. Specifically, we investigate the impact of centralization, formalization,
and complexity on both internal (cross-functional) and external (supplier, customer) integration. relationships are examined across Western and east asian environments using
data collected from 238 manufacturing plants in eight countries. We find that structural
features have differing impacts on cross-functional, supplier, and customer integration, and these effects vary across geographical regions.
Keywords: Supply chain management, supply chain integration, organizational structure,
organization design, cross-cultural research
Over the past two decades, manufacturers have shifted their focus from managing and
improving the efficiency of internal organizational processes to the simultaneous optimization
of both intra- and inter-organizational relationships. This shift in emphasis means that manufacturers today are not only interested in achieving better cross-functional integration but supplier and customer integration as well (frohlich & Westbrook, 2001). In this study,
we first seek to address the question of whether choices about organizational structure
facilitate or impede integration within the plant and with suppliers and customers. We focus on the impact of three key structural variables: centralization, formalization, and complexity.
Furthermore, we examine whether structural influence on internal and external integration varies by geographical region. Specifically, we include in our sample firms in East Asia
(Japan and South Korea) and in the West (united States and europe) in order to determine if cultural and economic factors alter the impact of structure on integration.
theOry anD hypOtheses
Internal and external integration is required for organizational efficiency and effectiveness
Cross-2
Xenophon Koufteros • Xiasong (David) Peng
Guanyi Lu • Richard Peters and External Integration: An empirical, cross-regional The Impact of Organizational Structure on Internal assessment
functional integration enhances a plant’s problem-solving capabilities, while integration of
suppliers and customers allows a plant to combine different capabilities, share fixed costs,
and gain economies of scale (Kanter & myers, 1991).
centralization
Centralization is a fundamental dimension of organizational structure (Weber, 1947). In highly centralized organizations, decision-making authority resides in members at the apex of the organization. however, it is important to distinguish between centralization at the corporate (macro) level and centralization at the plant (micro) level (adler, 2012; aiken & hage, 1966). Corporate-level decisions commonly revolve around the control and coordination of internal efforts to more effectively leverage opportunities created by economies of scale,
synergy, and consolidation. Those decisions not only benefit the entire enterprise but also the plants subsumed within it. Facilitating internal integration typically requires changes
to organizational processes and major investments in information technologies (galbraith, 1973). plant-level functional managers are more likely to support those efforts when they are driven by well-conceived corporate plans, as opposed to those created by a plant-level
planning group. Thus, the benefit of macro centralization to lower-level internal integration is derived from its positive influence on plant coordination and control.
Beyond internal integration, macro centralization may positively benefit external
integration. The adoption and implementation of supplier and customer integration can be perceived as a radical innovation, which demands that the locus of decision making be concentrated at higher levels in order for the innovation to be underwritten and accepted by the entire organization (Koufteros & Vonderembse, 1998). Integration with external
partners requires significant resources, both tangible and intangible, and clout that can
only be authorized and mustered at higher levels of corporate management. for example,
integrating with customers can require the adoption of a new information technology
solution or the effective participation of customers in product development, both potentially
significant shifts from the status quo. Similarly, organizational members may be asked
to share their knowledge and information with suppliers, and suppliers in turn may have active participation in product development. Supplier involvement in product development
requires multi-functional buy-in and, depending on the extent of integration, may lead to a
loss of responsibility by organizational members (Koufteros, Cheng, & lai, 2007). In such instances, suppliers and customers may be perceived as threats, and to replace this mindset with a cooperative one is likely to necessitate legitimate power. The cost, unfamiliarity, and
organizational sacrifices that accompany external integration thus require authority, influence,
and oversight best vested at the organizational apex. Decision makers at the corporate level can take ownership of external integration, overcome barriers to resistance, and push through changes if necessary.
Hypothesis 1a. macro centralization is positively related to cross-functional integration.
Hypothesis 1b. macro centralization is positively related to customer integration.
Hypothesis 1c. macro centralization is positively related to supplier integration.
In contrast to macro centralization, we hypothesize that the centralization of operational decision making at the plant level (micro centralization) can impede information processing and cooperation (galbraith, 1974). In a plant where operational decision rights are highly centralized, employees have to wait for decisions to be made at a point far from where control and coordination problems actually occur. Therefore, their focus is on managing vertical relationships rather than the horizontal relationships associated with internal integration. furthermore, information distortion is likely to occur as information is passed through intermediate supervisors and managers. for these reasons, we expect centralization of operational decision making to be negatively related to internal (cross-functional) integration.
Xenophon Koufteros • Xiasong (David) Peng
Guanyi Lu • Richard Peters and External Integration: An empirical, cross-regional The Impact of Organizational Structure on Internal assessment
plant managers. These employees tend to be the domain experts, and they know whom to talk to and where to gather information to make decisions. for employees who directly interact with suppliers or customers, lack of decision-making authority can discourage them from proactively solving problems. This leads to customers and suppliers feeling isolated
or even forgotten. Thus, at the micro level, any benefit from improved coordination and
control is likely to be outweighed by losses due to lack of trust and cooperation that micro centralization can engender. We expect that micro centralization will be negatively related to cross-functional, customer, and supplier integration:
Hypothesis 2a. micro centralization is negatively related to cross-functional integration.
Hypothesis 2b. micro centralization is negatively related to supplier integration.
Hypothesis 2c. micro centralization is negatively related to customer integration.
formalization
formalization – formal policies and rules – reduces uncertainty and goal incongruence among functional managers (hage 1965; Koufteros & Vonderembse 1998; pugh et al., 1968),
and it helps them to direct their focus, motivation, and energy on what the firm’s strategy
prescribes (adler & Borys, 1996; fredrickson, 1986). By essentially ‘codifying’ strategy (lin & germain, 2003), formalization acts as a catalyst or precursor for internal cooperation and communication. It does so by facilitating the dissemination of plans and objectives to external stakeholders and by enhancing knowledge and information integration internally (grant, 1996). explicitly articulating strategic intent helps organizational members make sense of the strategy, thereby contributing to consistency and unity of direction (Bourgeois & Brodwin, 1984). formalization can also signal to employees what top managers value and care about, thus enabling plant employees to devote their resources toward a common goal.
Similar to centralization, formalization is not itself integration but rather acts as a catalyst
to promote the level, frequency, and quality of communication and cooperation inherent in integration. Those attributes and consequences of formalization may be expected to benefit integration with external partners, especially customers and suppliers. Formalization
can serve as a sense-making process for suppliers and customers alike, allowing them to
harmonize their strategies and processes with those of the focal firm. Knowing explicitly the firm’s goals, intentions, and plans can reduce ambiguity in the minds of both customers and suppliers. However, the benefit of clarity might be outweighed by the loss of intimacy and flexibility a highly formalized structure breeds. As Moorman, Deshpande, and Zaltman
(1993) found, formalization inhibits cooperation and trust, especially when the basis for trust and cooperation is located in the interpersonal relationships between exchange partners such as suppliers and/or customers. Because formalization often compels both managers and employees to comply with written policies and regulations (“do it by the book”), it may
promote rigidity and inflexibility that can hurt integration with external partners (Fox, 1974; Dwyer, Schurr, & Oh, 1987). Much like centralization, suppliers and customers may find themselves interacting with policies rather than their firm partners, which is frustrating, especially in volatile and fluid environments. Thus, while it may promote internal integration,
we hypothesize that formalization will impede external integration:
Hypothesis 3a. formalization is positively related to cross-functional integration.
Hypothesis 3b. formalization is negatively related to customer integration.
Hypothesis 3c. formalization is negatively related to supplier integration.
complexity
Complex organizations are composed of many diverse, interrelated parts. In general, a
4
Xenophon Koufteros • Xiasong (David) Peng
Guanyi Lu • Richard Peters and External Integration: An empirical, cross-regional The Impact of Organizational Structure on Internal assessment
between labor and management, and greater differentiation across functional departments (lawrence & lorsch, 1967). In addition, complexity hinders the ability of organization
members to recognize and act upon issues of strategic significance. Information barriers and
disparate, parochial interests are all potential negative side effects of structural complexity,
and they present significant challenges to the pursuit of collaboration, knowledge sharing, and
consensus in decision making (mintzberg 1979; Koufteros et al., 2007; nahm, Vonderembse, & Koufteros, 2003).
With respect to vertical differentiation, flatness, the number of hierarchical levels in an organization, influences integration. A flatter organizational structure is less complex, as it
contains fewer organizational layers through which information must travel to reach decision makers (Koufteros et al., 2007; nahm et al., 2003), making communication and coordination faster and easier (hull & hage, 1982). flatness also increases the number of actors at each level, thereby increasing the number of potential boundary spanners between an organization and its suppliers and customers (Kostova & roth, 2003; Tushman & Scanlan, 1981). Thus, when a problem must be jointly solved by the focal plant and its partners, the employees responsible for solving the problem can interact directly with those who experience the problem and therefore may have a clearer idea about the nature of the problem. as such, the
flatter organizational structure is expected to facilitate external integration:
Hypothesis 4a. Vertical differentiation as measured by flatness is positively related to
cross-functional integration.
Hypothesis 4b. Vertical differentiation as measured by flatness is positively related to
customer integration.
Hypothesis 4c. Vertical differentiation as measured by flatness is positively related to
supplier integration.
Whereas vertical differentiation is manifested in hierarchical levels of management, horizontal differentiation is characterized by the diversity of functions and specialty skill sets that are spread across an organization. In this study, we focus on horizontal differentiation at both employee and managerial levels. at the employee level, horizontal differentiation promotes variety in employee knowledge and skill sets as well as an appreciation for the multi-functionality of processes and operations. prior research suggests that diverse skill sets and cross-functional awareness enable both information sharing and knowledge creation
(Grant, 1996; Huang, Kristal, & Schroeder, 2010). For instance, multi-skilled shop floor
workers can better diagnose production problems. further, they possess greater technical knowledge and vocabulary that enables them to more effectively interact and cooperate with workers in other production areas.
Similar arguments can also be applied at managerial levels. managers who have a broad
range of experiences and skills are better equipped to collaborate across functional and departmental lines. The exposure to multiple functions within a firm that managers receive
from structural processes, like job rotation, is an important facilitating factor to internal integration. a manager who gains experience in a broad set of organizational units is in a better position to interact with personnel from any organizational unit. Such a manager understands the barriers impeding communication and collaboration internally and externally. further, by working in a variety of functional areas, managers build relationships that garner social capital (adler & Kwon, 2002).
External integration can also benefit from horizontal differentiation and the variety and flexibility it engenders. Customers and suppliers often have needs that transcend functional boundaries and require cross-functional accommodation. Employees and managers who
Xenophon Koufteros • Xiasong (David) Peng
Guanyi Lu • Richard Peters and External Integration: An empirical, cross-regional The Impact of Organizational Structure on Internal assessment
impact external integration.
Hypothesis 5a. horizontal differentiation is positively related to cross-functional integration.
Hypothesis 5b. horizontal differentiation is positively related to customer integration.
Hypothesis 5c. horizontal differentiation is positively related to supplier integration.
Moderating role of geographical region
We expect that employees working in diverse regions will respond differently to integrative elements of organizational design due to fundamental differences in their views of work and community. Both the sociology and international business literatures have examined cross-regional differences and their effects on organizational life (Deal & Kennedy, 1982; hofstede, 1980). Organizational structure is not immune to these effects; regional differences in culture, political systems, and economic development can have pervasive effects on the organization (rhody & Tang, 1995). Since the impact of geographical region on structure and integration is relatively untested, we chose not to specify particular cultural, economic, and/ or institutional factors as possible moderators. Instead, we adopt an exploratory approach and
hypothesize that the relationships depicted in our model will be influenced by differences across firms located in the West and firms located in East Asia:
Hypothesis 6. relationships between organizational structure elements and integration types will differ across plants located in the West and east asia.
MethOD
Our study used secondary data collected as part of the third wave of the high performance manufacturing (hpm) study (Schroeder & flynn, 2001). The hpm study collected data on a broad range of variables related to manufacturing plants’ operating environment, operations strategy, operations management practices, organizational structure, technology, and performance. Data were collected from 2005-07 from 238 manufacturing plants located in eight countries: austria, finland, Sweden, germany, Italy, united States, Japan, and Korea. Three industries are represented in the data set: electronics, machinery, and transportation
equipment and components. These industries were selected because they account for a significant proportion of the manufacturing industries in the countries where the survey was administered. Table 1 presents demographic profiles of the plants.
table 1. Demographic profiles of the manufacturing plants
The research design of the hpm study mitigates common method bias (podsakoff & Organ,
Country
Industry and Country Counts Finland (n=30) Sweden (n=24) Germany (n=41) (n=27) Italy Austria (n=21) Japan (n=35) (n=31) Korea United States (n=29)
Electronics 14 7 9 10 10 10 10 9
Machinery 6 10 13 10 7 12 10 11
Transportation Components 10 7 19 7 4 13 11 9
Demographics by Country Finland Sweden Germany Italy Austria Japan Korea United States
Annual Sales Volume ($000) 33,505 482,374 64,143 30,802 35,005 325,792 369,860 153,097 Median Total # of Employees 509 488 815 354 424 1,485 1,946 1,149 Average Life Cycle of Products
(years) 10.33 9.05 10.05 7.73 8.54 10.56 7.32 4.10 Average % of Customized Products 88.58 88.64 86.79 62.41 83.86 73.13 90.05 45.18
Demographics by Industry Industries Electronics Machinery Across Transportation Equipment
Annual Sales Volume ($000) 82,900 70,000 116,401 92,000 Median Total # of Employees 782 708 608 810 Average Life Cycle of Products
(years) 9.04 7.65 7.71 12.07
6
Xenophon Koufteros • Xiasong (David) Peng
Guanyi Lu • Richard Peters and External Integration: An empirical, cross-regional The Impact of Organizational Structure on Internal assessment
1986; podsakoff et al., 2003). multiple informants scored the measurement items used in this study. The plant manager, plant superintendent, inventory manager, human resource manager,
process engineers, supervisors, and multiple shop-floor workers responded to items measuring
organizational structure variables at each plant. respondents to items related to internal and
external integration at each plant included the plant manager, plant superintendent, quality manager, inventory manager, a process engineer, a supervisor, and multiple shop-floor
workers. pertinent respondents across managerial ranks and labor were targeted in order to generate a comprehensive and accurate depiction of organizational processes. for items with multiple informants, analysis of variance compared the multiple responses within a plant against responses of respondents in other plants. We found that cross-plant differences were
significantly higher than within- plant differences, as evidenced by F-statistics (p<0.01).
These results allowed us to generate aggregate plant-level data for each item by averaging responses from different informants. harman’s one-factor test (podsakoff & Organ, 1986) was also employed to examine potential common method bias. To perform harman’s test, all of the scales were entered into a single exploratory factor analysis to determine if a single factor can account for the majority of the co-variance among the various measures. The results indicate that no single dominant factor emerged.
The literature frequently cites a 60 percent response rate as reasonable assurance against
non-respondent bias (Bailey, 1978). The hpm data has a 65 percent response rate and compares favorably with other recent survey-based studies (e.g., Drnevich & Kriauciunas, 2011; Terziovski, 2010; zhou & Wu, 2010). Thus, non-response bias does not appear to be a major concern.
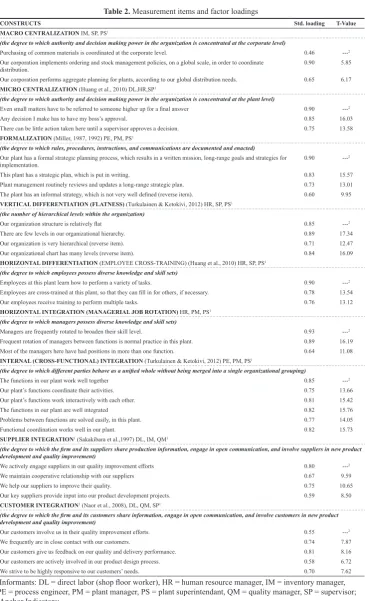
for the organizational structure and integration items, respondents marked the extent to which they agree with the respective statement on a seven-point likert-type scale anchored by (1) strongly disagree and (7) strongly agree. Drawing on the extant literature, we measured dimensions of organizational structure using six multi-item scales. Table 2 presents the
measurement items along with construct definitions. Measures for macro centralization rely
on aiken and hage (1966). The measurement items for micro centralization are identical to those used by huang et al. (2010) to operationalize centralization. formalization is
measured by the explicitness of the firm’s strategy and planning (Miller, 1987, 1992). Vertical differentiation is operationalized by measures of the flatness of organizational structure,
adopting the same items used by Turkulainen and Ketokivi (2012). Our measure of employee cross-training is adopted from huang et al. (2010) who deployed the same data set to examine the effects of organization design on mass customization capability. To our knowledge, the items we use to measure managerial job rotation have not been used in prior studies.
Cross-functional integration is operationalized through six indicators adopted from Turkulainen and Ketokivi (2012). four other indicators are used to address supplier
Xenophon Koufteros • Xiasong (David) Peng
Guanyi Lu • Richard Peters and External Integration: An empirical, cross-regional The Impact of Organizational Structure on Internal assessment
table 2. measurement items and factor loadings
cOnstructs std. loading t-value
MacrO centraLiZatiOn Im, Sp, pS1
(the degree to which authority and decision making power in the organization is concentrated at the corporate level)
purchasing of common materials is coordinated at the corporate level. 0.46 ---2
Our corporation implements ordering and stock management policies, on a global scale, in order to coordinate
distribution. 0.90 5.85
Our corporation performs aggregate planning for plants, according to our global distribution needs. 0.65 6.17
MicrO centraLiZatiOn (huang et al., 2010) Dl,hr,Sp1
(the degree to which authority and decision making power in the organization is concentrated at the plant level)
Even small matters have to be referred to someone higher up for a final answer 0.90 ---2
any decision I make has to have my boss’s approval. 0.85 16.03 There can be little action taken here until a supervisor approves a decision. 0.75 13.58
fOrMaLiZatiOn (miller, 1987, 1992) pe, pm, pS1
(the degree to which rules, procedures, instructions, and communications are documented and enacted)
Our plant has a formal strategic planning process, which results in a written mission, long-range goals and strategies for
implementation. 0.90
---2
This plant has a strategic plan, which is put in writing. 0.83 15.57 plant management routinely reviews and updates a long-range strategic plan. 0.73 13.01
The plant has an informal strategy, which is not very well defined (reverse item). 0.60 9.95
verticaL DifferentiatiOn (fLatness) (Turkulainen & Ketokivi, 2012) hr, Sp, pS1
(the number of hierarchical levels within the organization)
Our organization structure is relatively flat 0.85 ---2
There are few levels in our organizational hierarchy. 0.89 17.34 Our organization is very hierarchical (reverse item). 0.71 12.47 Our organizational chart has many levels (reverse item). 0.84 16.09
hOriZOntaL DifferentiatiOn (emplOYee CrOSS-TraInIng) (huang et al., 2010) hr, Sp, pS1
(the degree to which employees possess diverse knowledge and skill sets)
employees at this plant learn how to perform a variety of tasks. 0.90 ---2
Employees are cross-trained at this plant, so that they can fill in for others, if necessary. 0.78 13.54 Our employees receive training to perform multiple tasks. 0.76 13.12
hOriZOntaL integratiOn (ManageriaL JOB rOtatiOn) hr, pm, pS1
(the degree to which managers possess diverse knowledge and skill sets)
Managers are frequently rotated to broaden their skill level. 0.93 ---2
Frequent rotation of managers between functions is normal practice in this plant. 0.89 16.19 most of the managers here have had positions in more than one function. 0.64 11.08
internaL (crOss-functiOnaL) integratiOn (Turkulainen & Ketokivi, 2012) pe, pm, pS1
(the degree to which different parties behave as a unified whole without being merged into a single organizational grouping)
The functions in our plant work well together 0.85 ---2
Our plant’s functions coordinate their activities. 0.75 13.66 Our plant’s functions work interactively with each other. 0.81 15.42 The functions in our plant are well integrated 0.82 15.76 problems between functions are solved easily, in this plant. 0.77 14.05 functional coordination works well in our plant. 0.82 15.73
suppLier integratiOn1 (Sakakibara et al.,1997) Dl, Im, Qm1
(the degree to which the firm and its suppliers share production information, engage in open communication, and involve suppliers in new product development and quality improvement)
We actively engage suppliers in our quality improvement efforts 0.80 ---2
We maintain cooperative relationship with our suppliers 0.67 9.59
We help our suppliers to improve their quality. 0.75 10.65
Our key suppliers provide input into our product development projects. 0.59 8.50
custOMer integratiOn1 (naor et al., 2008), Dl, Qm, Sp1
(the degree to which the firm and its customers share information, engage in open communication, and involve customers in new product development and quality improvement)
Our customers involve us in their quality improvement efforts. 0.55 ---2
We frequently are in close contact with our customers. 0.74 7.87
Our customers give us feedback on our quality and delivery performance. 0.81 8.16 Our customers are actively involved in our product design process. 0.58 6.72 We strive to be highly responsive to our customers’ needs. 0.70 7.62
1Informants: DL = direct labor (shop floor worker), HR = human resource manager, IM = inventory manager,
PE = process engineer, PM = plant manager, PS = plant superintendant, QM = quality manager, SP = supervisor;
2anchor Indicators;
Fit Indices: Chi-Square (df) = 929.59 (524), Chi-Square/df= 1.77, IFI=0.92, NNFI=.91, CFI=.92, RMSEA=.05,
RMR=.06
resuLts
Using a covariance matrix as input, we specified Confirmatory Factor Analysis (CFA) via
8
Xenophon Koufteros • Xiasong (David) Peng
Guanyi Lu • Richard Peters and External Integration: An empirical, cross-regional The Impact of Organizational Structure on Internal assessment
has acceptable model fit as indicated by the fit statistics (χ2/df =1.77, CfI=.92, IfI=.92,
nnfI=.91, rmSea=.05, rmr=.06). With one exception, all item-factor loadings are greater
than .50 and are significant at the .01 level. We assessed discriminant validity using the χ2
difference test (Bagozzi & Phillips, 1982). A significant χ2 difference indicates the uniqueness
of any two scales being tested. Each pair-wise χ2 difference test is significant at the .01 level,
providing evidence of discriminant validity. each of the composite reliabilities for the focal constructs is greater than the recommended threshold of .70. Overall, the constructs appear to be reliable and valid.
hypothesis tests
We specified a structural model to examine the proposed hypotheses. Model fit was evaluated using LISREL 8.51 via several criteria such as RMSEA, χ2/df, CfI, IfI, and nnfI. Structural
paths were examined for statistical significance based on t-tests and respective p-values.
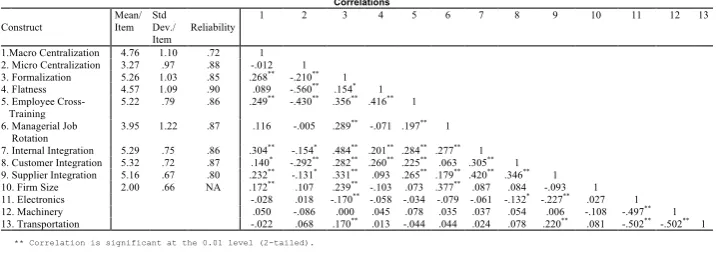
In order to examine whether relationships between organizational structure dimensions and internal/external integration vary by geographical region, we utilized multi-group analysis. Table 3 reports means, standard deviations, and correlations of all variables. Before testing the structural model, we examined the distribution of each variable via measures of kurtosis and skewness, along with visual inspections. each variable appeared to have an approximately normal distribution.
table 3. Descriptive statistics and correlation matrix
figure 1 presents the hypothesized structural model and respective p-values. We controlled
for firm size (dollar sales in current year) as well as industry because the extant literature
posits that variation in our endogenous variables can potentially be attributed to differences
in firm size and industry rather than the effects of focal variables. Table 4 presents completely standardized coefficients along with respective significance levels and t-values. We assessed
the degree of multicollinearity using several diagnostics and failed to identify any worrisome patterns.
Correlations
Construct Mean/ Item Std Dev./
Item Reliability
1 2 3 4 5 6 7 8 9 10 11 12 13
1.Macro Centralization 4.76 1.10 .72 1
2. Micro Centralization 3.27 .97 .88 -.012 1
3. Formalization 5.26 1.03 .85 .268** -.210** 1
4. Flatness 4.57 1.09 .90 .089 -.560** .154* 1
5. Employee Cross-
Training 5.22 .79 .86 .249
** -.430** .356** .416** 1
6. Managerial Job
Rotation 3.95 1.22 .87 .116 -.005 .289
** -.071 .197** 1
7. Internal Integration 5.29 .75 .86 .304** -.154* .484** .201** .284** .277** 1
8. Customer Integration 5.32 .72 .87 .140* -.292** .282** .260** .225** .063 .305** 1
9. Supplier Integration 5.16 .67 .80 .232** -.131* .331** .093 .265** .179** .420** .346** 1
10. Firm Size 2.00 .66 NA .172** .107 .239** -.103 .073 .377** .087 .084 -.093 1
11. Electronics -.028 .018 -.170** -.058 -.034 -.079 -.061 -.132* -.227** .027 1
12. Machinery .050 -.086 .000 .045 .078 .035 .037 .054 .006 -.108 -.497** 1
13. Transportation -.022 .068 .170** .013 -.044 .044 .024 .078 .220** .081 -.502** -.502** 1
Xenophon Koufteros • Xiasong (David) Peng
Guanyi Lu • Richard Peters and External Integration: An empirical, cross-regional The Impact of Organizational Structure on Internal assessment
fig 1. research framework
The fit indices indicate that the structural model exhibits a good data-to-model fit (χ2=1142.99,
df = 664, χ2/df=1.76, CfI=.93, IfI=.93, nnfI=.92, rmSea=.05, rmr=.08). next, we
examined the path coefficients of the structural model for evidence against the hypothesized
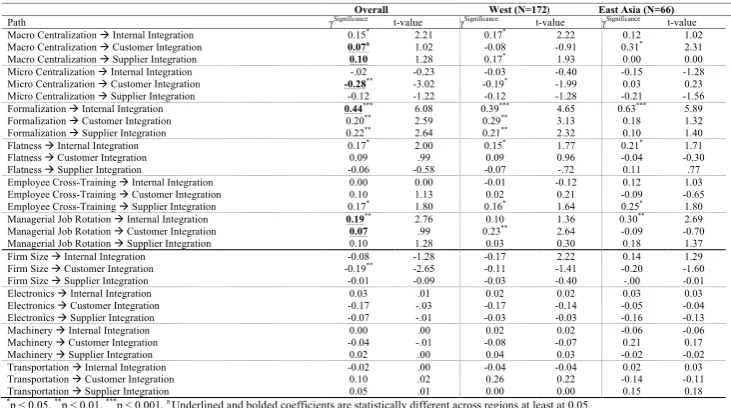
relationships. h1a predicts that macro centralization will have a positive relationship with cross-functional integration, while h1b and h1c suggest positive relationships with customer integration and supplier integration, respectively. The results support only h1a; the evidence indicates that centralization of decision making at the corporate level has a statistically
significant positive relationship with internal integration (H1a, γ=.15, p<0.05). Hypotheses
h2a-c posit that micro centralization will have negative relationships with internal as well as
external integration. We found supporting evidence only for customer integration (H2b, γ=-.28, H1, p<0.01). Said differently, decentralizing decision making to the plant level appears
to be associated with higher levels of customer integration.
table 4. Structural model--overall and by region (Based on multi-group analysis)
Fit Indices for Overall Model: χ2(df)= 1142.99(664), χ2/df= 1.76, IFI=0.93, NNFI=.92, CFI=.93, RMSEA=.05, RMR=.08
Formalization exhibits strong relationships with all three types of integration. Specifically, it is positively related to cross-functional integration (H3a, γ=.44, p<0.001), customer integration
Overall West (N=172 ) East Asia (N=66)
Path Significance t-value Significance t-value Significance t-value
Macro Centralization Internal Integration 0.15* 2.21 0.17* 2.22 0.12 1.02
Macro Centralization Customer Integration 0.07a 1.02 -0.08 -0.91 0.31* 2.31
Macro Centralization Supplier Integration 0.10 1.28 0.17* 1.93 0.00 0.00
Micro Centralization Internal Integration -.02 -0.23 -0.03 -0.40 -0.15 -1.28
Micro Centralization Customer Integration -0.28** -3.02 -0.19* -1.99 0.03 0.23
Micro Centralization Supplier Integration -0.12 -1.22 -0.12 -1.28 -0.21 -1.56
Formalization Internal Integration 0.44*** 6.08 0.39*** 4.65 0.63*** 5.89
Formalization Customer Integration 0.20** 2.59 0.29** 3.13 0.18 1.32
Formalization Supplier Integration 0.22** 2.64 0.21** 2.32 0.10 1.40
Flatness Internal Integration 0.17* 2.00 0.15* 1.77 0.21* 1.71
Flatness Customer Integration 0.09 .99 0.09 0.96 -0.04 -0.30
Flatness Supplier Integration -0.06 -0.58 -0.07 -.72 0.11 .77
Employee Cross-Training Internal Integration 0.00 0.00 -0.01 -0.12 0.12 1.03
Employee Cross-Training Customer Integration 0.10 1.13 0.02 0.21 -0.09 -0.65
Employee Cross-Training Supplier Integration 0.17* 1.80 0.16* 1.64 0.25* 1.80
Managerial Job Rotation Internal Integration 0.19** 2.76 0.10 1.36 0.30** 2.69
Managerial Job Rotation Customer Integration 0.07 .99 0.23** 2.64 -0.09 -0.70
Managerial Job Rotation Supplier Integration 0.10 1.28 0.03 0.30 0.18 1.37
Firm Size Internal Integration -0.08 -1.28 -0.17 2.22 0.14 1.29
Firm Size Customer Integration -0.19** -2.65 -0.11 -1.41 -0.20 -1.60
Firm Size Supplier Integration -0.01 -0.09 -0.03 -0.40 -.00 -0.01
Electronics Internal Integration 0.03 .01 0.02 0.02 0.03 0.03
Electronics Customer Integration -0.17 -.03 -0.17 -0.14 -0.05 -0.04
Electronics Supplier Integration -0.07 -.01 -0.03 -0.03 -0.16 -0.13
Machinery Internal Integration 0.00 .00 0.02 0.02 -0.06 -0.06
Machinery Customer Integration -0.04 -.01 -0.08 -0.07 0.21 0.17
Machinery Supplier Integration 0.02 .00 0.04 0.03 -0.02 -0.02
Transportation Internal Integration -0.02 .00 -0.04 -0.04 0.02 0.03
Transportation Customer Integration 0.10 .02 0.26 0.22 -0.14 -0.11
Transportation Supplier Integration 0.05 .01 0.00 0.00 0.15 0.18
10
Xenophon Koufteros • Xiasong (David) Peng
Guanyi Lu • Richard Peters and External Integration: An empirical, cross-regional The Impact of Organizational Structure on Internal assessment
(H3b, γ=.20, p<0.01), and supplier integration (H3c, γ=.22, p<0.01). It is the only explanatory variable that exhibits statistically significant relationships with all three integration variables.
however, we anticipated that formalization would exhibit negative relationships with
external integration. With respect to vertical differentiation, measured as flatness, we found support only for internal integration (H4a, γ=.17, p<0.05). We operationalized horizontal
differentiation as employee training and managerial job rotation. employee
cross-training demonstrated statistically significant relationships with supplier integration (H5c, γ=.17, p<0.05) while managerial job rotation only related to internal integration (H5a, β=.19, p<0.01).
Finally, firm size and industry were entered as control variables. Firm size has a statistically negative effect on customer integration (γ=-.21, p<0.01) while industry fails to manifest significant relationships with any of the three integration variables.
Hypothesis H6 proposed differential effects across Western and East Asian firms
regarding relationships between elements of organizational structure and integration. The
first relationships that are statistically different between the two groups are for the effect of macro centralization on customer integration (Δχ2 = 25.07, p<0.000) and macro centralization
on supplier integration (Δχ2 = 3.83, p<0.05). Our findings indicate that for firms located in
east asia, macro centralization is more strongly related to customer integration, whereas for
supplier integration Western firms derive more benefit from corporate-level decision making. This is an interesting contrast where the salience of the significance varies for customer
versus supplier integration across the two regions.
The relationship between micro centralization and customer integration also varies by
region (Δχ2 = 8.51, p<0.003), and further analysis {(effect size (γ= -.19 in the West vs. γ=0.03
in east asia; t-value (1.99 in the West vs. 0.23 in east asia)} suggests that the relationship is stronger in the West than in east asia. also, the relationship between formalization and
cross-functional integration is significantly different across the two groups (χ2 = 4.49, p<.036).
Though the relationship coefficients appear to be statistically significant for plants located
both in the West and east asia (t=4.65 in the West vs. t=5.89 in east asia), the effect size
for East Asian plants (γ=.39 in the West vs. γ=.63 in East Asia) is clearly larger, suggesting
that the link between formalization and internal integration is more impactful for companies located in east asia.
finally, the relationship between managerial job rotation and both cross-functional
integration and customer integration varies across the two geographic regions (χ2 = 8.55,
p<.003 and χ2 = 4.46, p<.035, respectively). Interestingly, managerial job rotation is
positively and significantly related to internal integration only for firms located in East Asia (γ=.30, t=2.69) while managerial job rotation is only related to customer integration for firms located in the West (γ=.23, t=2.64). Again, this provides some preliminary evidence that relationships between organizational structure and types of integration are influenced by
regional differences.
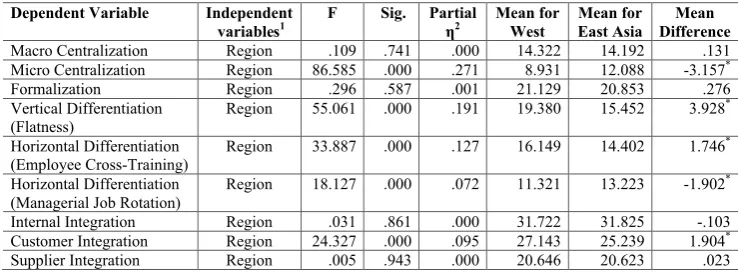
table 5. Differences in means across regions
1Covariates include firm size and industry, *Mean difference is significant at least at the .05 level
Considering the exploratory nature of the investigation of regional differences, we extended our analysis by (a) evaluating the mean differences of all variables (independent
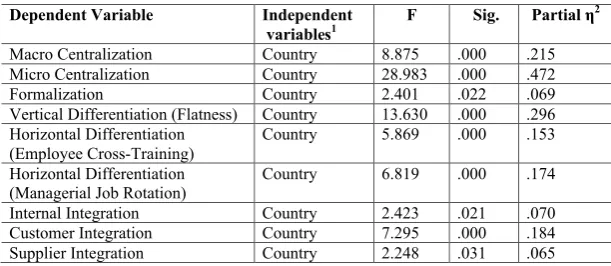
Dependent Variable Independent
variables1 F Sig. Partial 2 Mean for West Mean for East Asia Difference Mean
Macro Centralization Region .109 .741 .000 14.322 14.192 .131
Micro Centralization Region 86.585 .000 .271 8.931 12.088 -3.157*
Formalization Region .296 .587 .001 21.129 20.853 .276
Vertical Differentiation
(Flatness) Region 55.061 .000 .191 19.380 15.452 3.928
*
Horizontal Differentiation
(Employee Cross-Training) Region 33.887 .000 .127 16.149 14.402 1.746
*
Horizontal Differentiation
(Managerial Job Rotation) Region 18.127 .000 .072 11.321 13.223 -1.902
*
Internal Integration Region .031 .861 .000 31.722 31.825 -.103
Customer Integration Region 24.327 .000 .095 27.143 25.239 1.904*
Xenophon Koufteros • Xiasong (David) Peng
Guanyi Lu • Richard Peters and External Integration: An empirical, cross-regional The Impact of Organizational Structure on Internal assessment
and dependent) at the regional level and (b) evaluating mean differences at the country level.
Related to the first post hoc analysis, the results, as shown in Table 5, indicated a pattern.
for the dependent variables, we found no evidence suggesting that either cross-functional or
supplier integration differ across regions. But for customer integration, firms in the West on average scored significantly higher than their East Asian counterparts.
table 6. Differences in means across countries
1Covariates include firm size and industry
Complexity, measured as both vertical and horizontal differentiation, was significantly different across regions. Western firms scored higher than East Asian firms both on flatness and reported levels of employee cross-training. On the other hand, firms in East Asia displayed a higher level of managerial job rotation. Collectively, Western firms are flatter and engage in more employee cross-training while East Asian firms are more diverse with respect to managerial job rotation. Levels of micro centralization were also significantly different, and the results reflect significantly higher scores for firms located in East Asia. There is a tendency for East Asian firms to centralize decisions made at the plant level.
Statistically, the two regions diverge the most when their levels of micro centralization are examined. however, there were no discernible differences in levels of macro centralization or formalization across the two regions.
table 7. means across countries
1Covariates include firm size and industry
With respect to the second post hoc analysis, given the identified differences in mean variable scores across the two regions, we sought to identify whether significant differences
in mean variable scores exist at the country level. Table 6 summarizes the results based
on Univariate General Linear Models and shows that there are statistically significant
differences at the country level for all variables. These differences were more pronounced for micro centralization and vertical differentiation. Table 7 displays the mean scores for all variables across the eight countries used for data analysis. It is evident that, in general, within-region countries exhibit similar means vis-à-vis between-region countries. focusing
on differences in the structural variables, firms in Japan and Korea report the highest scores for
micro centralization and managerial job rotation amongst all countries. They also report the lowest scores for vertical differentiation and employee cross-training. The scores for macro
centralization and formalization in East Asian firms, however, were similar to scores reported for firms located in several Western countries. Furthermore, Tables 7 and 8 suggest that there are significant differences in mean scores amongst firms located in Western countries.
Variable Finland United
States Germany Sweden Italy Austria Japan Korea
Macro Centralization 13.6721 13.836 14.661 13.313 15.216 15.675 12.299 16.053
Micro Centralization 7.130 9.846 8.286 8.772 11.436 8.415 12.073 12.133 Formalization 22.773 20.273 20.630 20.650 20.456 22.741 20.713 20.745 Vertical Differentiation (Flatness) 18.635 17.953 20.664 20.050 17.354 21.473 15.814 15.232 Horizontal Differentiation (Employee
Cross-Training) 15.895 16.346 16.081 16.271 15.576 16.898 14.230 14.645 Horizontal Differentiation (Managerial Job Rotation) 11.954 13.168 11.087 9.573 10.421 11.768 13.465 12.752 Internal Integration 31.890 32.120 31.467 29.391 32.432 33.830 32.141 31.030 Customer Integration 27.757 28.168 26.782 26.348 26.329 27.721 24.268 26.189 Supplier Integration 21.615 20.170 20.543 19.564 21.434 20.803 20.654 20.280
Dependent Variable Independent
variables1 F Sig. Partial
2
Macro Centralization Country 8.875 .000 .215
Micro Centralization Country 28.983 .000 .472
Formalization Country 2.401 .022 .069
Vertical Differentiation (Flatness) Country 13.630 .000 .296
Horizontal Differentiation
(Employee Cross-Training) Country 5.869 .000 .153
Horizontal Differentiation
(Managerial Job Rotation) Country 6.819 .000 .174
Internal Integration Country 2.423 .021 .070
Customer Integration Country 7.295 .000 .184
12
Xenophon Koufteros • Xiasong (David) Peng
Guanyi Lu • Richard Peters and External Integration: An empirical, cross-regional The Impact of Organizational Structure on Internal assessment
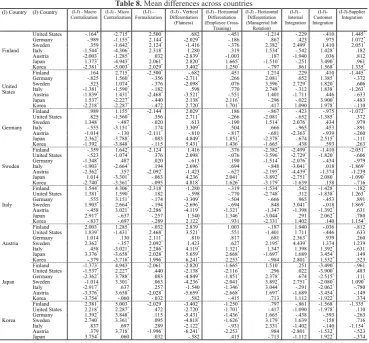
table 8. mean differences across countries
1Covariates include firm size and industry, *Mean difference is significant at least at the .05 level
as far as integration is concerned, austria has the highest score for cross-functional integration
while firms in the United States report the highest scores for customer integration. Firms
in Japan had substantially lower scores for customer integration, even when compared to
Korean firms. Finland and Italy report the highest scores for supplier integration. Companies
located in east asia differed somewhat from companies located in Western countries as far as internal integration and supplier integration are concerned, but there is evidence that there
are similar differences within the sample of firms located in the West (see Tables 7 and 8).
DiscussiOn
as pointed out earlier, there has been little research that tests the effects of internal organizational design on external relationships with suppliers and customers. here we conduct such testing and demonstrate that while certain structural variables might have little effect on internal integration, they may still produce effects on external integration. for example, our results indicate that micro centralization has no effect on cross-functional
integration but has a significant negative effect on customer integration. This result may
seem surprising, but our conjecture is that work formalization serves as a substitute for decision decentralization. That is, the negative effects of centralization at the plant level on internal integration are mitigated by formalization that provides “programmed” cross-functional integration. programmed integration is missing in, or less applicable to, customer integration since customer engagement is often less predictable than internal or even supplier interactions. This example of the inconsistency between internal and external effects suggests
that what might aid the firm’s internal integration might simultaneously detract from its
external integration and vice versa, suggesting that internal organizational design choices matter outside the traditional boundaries of the plant.
A surprising result was that formalization not only benefitted internal integration but
(I) Country (J) Country (I-J) - Macro
Centralization Centralization (I-J) - Micro Formalization (I-J) - (I-J) - Vertical Differentiation (Flatness)
(I-J) - Horizontal Differentiation (Employee
Cross-Training)
(I-J) - Horizontal Differentiation (Managerial Job Rotation) (I-J) - Internal Integration (I-J)-Customer Integration (I-J)-Supplier Integration Finland
United States -.1641 -2.715* 2.500* .682 -.451 -1.214 -.229 -.410 1.445* Germany -.989 -1.155* 2.144* -2.029* -.186 .867 .423 .975 1.072* Sweden .359 -1.642* 2.124* -1.416 -.376 2.382* 2.499* 1.410 2.051* Italy -1.544* -4.306* 2.318* 1.280 .319 1.534* -.542 1.428* .182 Austria -2.003* -1.285* .032 -2.839* -1.003 .187 -1.940 .036 .812 Japan 1.373* -4.943* 2.061* 2.820* 1.665* -1.510* -.251 3.490* .961 Korea -2.381* -5.003* 2.029* 3.402* 1.250* -.797 .861 1.568* 1.335*
United States
Finland .164 2.715* -2.500* -.682 .451 1.214 .229 .410 -1.445* Germany -.825 1.560* -.356 -2.711* .266 2.081* .652 1.385* -.372 Sweden .523 1.074* -.376 -2.098* .076 3.596* 2.729* 1.820* .606 Italy -1.381* -1.590* -.182 .598 .770 2.748* -.312 1.838* -1.263* Austria -1.839* 1.431* -2.468* -3.521* -.551 1.401 -1.711 .446 -.633 Japan 1.537* -2.227* -.440 2.138* 2.116* -.296 -.022 3.900* -.483 Korea -2.218* -2.287* -.472 2.720* 1.701* .417 1.090 1.978* -.110
Germany
Finland .989 1.155* -2.144* 2.029* .186 -.867 -.423 -.975 -1.072* United States .825 -1.560* .356 2.711* -.266 -2.081* -.652 -1.385* .372 Sweden 1.348* -.487 -.020 .613 -.190 1.514* 2.076* .434 .979 Italy -.555 -3.151* .174 3.309* .504 .666 -.965 .453 -.891 Austria -1.014 -.130 -2.111* -.810 -.817 -.681 -2.363* -.939 -.260 Japan 2.362* -3.788* -.083 4.849* 1.851* -2.378* -.674 2.515* -.111 Korea -1.392* -3.848* -.115 5.431* 1.436* -1.665* .438 .593 .263
Sweden
Finland -.359 1.642* -2.124* 1.416 .376 -2.382* -2.499* -1.410 -2.051* United States -.523 -1.074* .376 2.098* -.076 -3.596* -2.729* -1.820* -.606 Germany -1.348* .487 .020 -.613 .190 -1.514* -2.076* -.434 -.979 Italy -1.903* -2.664* .194 2.696* .694 -.848 -3.041* .018 -1.869* Austria -2.362* .357 -2.092* -1.423 -.627 -2.195* -4.439* -1.374 -1.239 Japan 1.014 -3.301* -.063 4.236* 2.041* -3.892* -2.751* 2.080* -1.090* Korea -2.740* -3.361* -.095 4.818* 1.626* -3.179* -1.639 .158 -.716
Italy
Finland 1.544* 4.306* -2.318* -1.280 -.319 -1.534* .542 -1.428* -.182 United States 1.381* 1.590* .182 -.598 -.770 -2.748* .312 -1.838* 1.263* Germany .555 3.151* -.174 -3.309* -.504 -.666 .965 -.453 .891 Sweden 1.903* 2.664* -.194 -2.696* -.694 .848 3.041* -.018 1.869* Austria -.458 3.021* -2.286* -4.119* -1.321* -1.347 -1.398 -1.392* .631 Japan 2.917* -.637 -.257 1.540 1.346* -3.044* .291 2.062* .780 Korea -.837 -.697 -.289 2.122* .931 -2.331* 1.402 .140 1.154*
Austria
Finland 2.003* 1.285* -.032 2.839* 1.003 -.187 1.940 -.036 -.812 United States 1.839* -1.431* 2.468* 3.521* .551 -1.401 1.711 -.446 .633 Germany 1.014 .130 2.111* .810 .817 .681 2.363* .939 .260 Sweden 2.362* -.357 2.092* 1.423 .627 2.195* 4.439* 1.374 1.239 Italy .458 -3.021* 2.286* 4.119* 1.321* 1.347 1.398 1.392* -.631 Japan 3.376* -3.658* 2.028* 5.659* 2.668* -1.697* 1.689 3.454* .149 Korea -.379 -3.718* 1.996* 6.241* 2.253* -.984 2.801* 1.532* .523
Japan
Finland -1.373* 4.943* -2.061* -2.820* -1.665* 1.510* .251 -3.490* -.961 United States -1.537* 2.227* .440 -2.138* -2.116* .296 .022 -3.900* .483 Germany -2.362* 3.788* .083 -4.849* -1.851* 2.378* .674 -2.515* .111 Sweden -1.014 3.301* .063 -4.236* -2.041* 3.892* 2.751* -2.080* 1.090* Italy -2.917* .637 .257 -1.540 -1.346* 3.044* -.291 -2.062* -.780 Austria -3.376* 3.658* -2.028* -5.659* -2.668* 1.697* -1.689 -3.454* -.149 Korea -3.754* -.060 -.032 .582 -.415 .713 1.112 -1.922* .374
Korea
Xenophon Koufteros • Xiasong (David) Peng
Guanyi Lu • Richard Peters and External Integration: An empirical, cross-regional The Impact of Organizational Structure on Internal assessment
external integration as well. We had expected the loss of flexibility and intimacy engendered
by formalized policies and practices to hinder both customer and supplier relationships. This was not corroborated and suggests that the clarity, consistency, and certainty that accompany formalization might be more important to customers and suppliers, at least in our sample of
firms.
Some of our most thought-provoking results were found once we separated the sample based on geography. With respect to the relationships between structural elements and
integration, internal integration in Western firms was positively related to macro centralization, formalization, and complexity as measured by flatness. For supplier integration, macro
centralization, formalization, and complexity as measured by employee cross-training were all positive correlates. formalization and managerial job rotation were found to have a
positive relationship with customer integration. Micro centralization was also a significant
factor, but as predicted, it was negatively related to customer integration.
These findings suggest that formalization may be the dominant structural variable in Western firms, across all types of integration. However, macro centralization, while positively
related to cross-functional and supplier integration, is not statistically related to customer integration. In addition, micro centralization has a negative relationship with customer
integration, which suggests that firms that decentralize decision making to the plant level exhibit higher levels of customer integration. Also, in the Western sample of firms, only one measure of complexity (i.e., flatness for functional integration, employee
cross-training for supplier integration, and managerial job rotation for customer integration) is
significant for each type of integration, respectively. This suggests that while not all three
complexity variables are needed in tandem to engender integration, the structural choice may be contingent on the type of integration.
Considering the firms located in East Asia, formalization, flatness, and managerial job
rotation were strongly and positively related to cross-functional integration. for supplier
integration, only employee cross-training was statistically significant, while for customer integration only macro centralization showed statistical significance. While this profile provides less confirming information than for the Western sample, it does indicate that formalization similarly co-varies with internal integration in East Asian firms. In fact, this
relationship is much stronger in east asia, perhaps indicating that where formalization practices are more common and entrenched, as in east asian business practices like Six Sigma and lean manufacturing, we should expect to see a greater formalization effect. further, the
positive and significant relationship of macro centralization and customer integration may be a testament to the paternalistic cultural influence apparent in East Asia which, as previously
alluded to, values top leaders’ discretion in deciding which entities the plant should embrace. evaluating differences between the geographical regions, managerial job rotation related
statistically to internal integration in East Asian firms and customer integration in Western firms. While separate forces might explain these two findings, they both result in increased
cooperation. In collectivistic cultures, as in east asia, perceptions of in-groups and out-groups are relevant to cooperation (hofstede, 1980). as managers are granted opportunities to rotate to other departments, they become part of in-groups and act less exclusionary to others in
the firm. This then benefits internal integration. In Western firms, managerial rotation may
promote knowledge sharing and decrease functional myopia, both of which are important to supporting customer integration. Thus, the same structural variables can have potentially
different integration effects, depending on the firm’s cultural disposition.
finally, formalization is positively related to both internal and external integration.
However, for firms in East Asia, only internal integration demonstrated this relationship.
The fact that asian cultures often emphasize interpersonal relationships and trust, as well as high contextual communication, might explain why formalization did not relate to external
integration in East Asian firms.
Our post hoc analyses complemented these findings by demonstrating that our study
variables, both dependent and independent, differed at the regional and country levels.
Regionally, we found evidence that Western firms prioritized customer integration more than firms in East Asia. This could be an artifact of collectivist cultural exclusion (Hofstede, 1980)
14
Xenophon Koufteros • Xiasong (David) Peng
Guanyi Lu • Richard Peters and External Integration: An empirical, cross-regional The Impact of Organizational Structure on Internal assessment
attributable to the growing prominence of concepts like Customer relationship management (Crm) in the West which are likely to explicitly impact organizational practices related to customer involvement.
Western firms were also flatter and more horizontally differentiated at the employee level than their East Asian counterparts. Again, this result could be influenced by cultural factors such as the high power distance, paternalistic nature of East Asian firms and their associated
deference to authority. But, similar to customer integration, popular management philosophies
and trends cannot be discounted as possible antecedents to greater Western adoption of flatter
and more differentiated structures for employees.
Our country-level results largely corroborate our regional-level findings, but they indicate that even within regions significant heterogeneity still exists. For example, while the mean
scores on micro centralization for South Korea (12.1) and Japan (12.1) were expectedly
higher than all countries in the West, this difference is smaller in comparison to Italian firms (11.4) than for firms in Finland (7.1). Similarly, customer integration is highest for U.S. firms
(congruent with our regional results), but Japan’s score on this variable (24.3) is smaller than
the mean score for South Korean firms (26.2), which is very similar to scores on customer
integration for Western countries such as Sweden (26.3), Italy (26.3), and germany (26.8).
Also, while macro centralization is not significantly different across regions, interestingly at the country level Japanese firms score the lowest (12.3) while South Koreans firm have the
highest mean scores (16.1). These results suggest that effects on organizational structure and integration can occur at both the country and regional levels. further, they suggest
regional-level findings are best interpreted in conjunction with country-regional-level findings in order to
provide more nuanced insight into the generalizability of both structural and integration constructs.
stuDy LiMitatiOns anD future research
We recognize that there are limitations to our study. One limitation is the omission of interaction terms. This omission was largely motivated by the need for simplicity in our theoretical model as well as the limited size of our sample. Variable interaction may be evident, for example, in the relationship between micro centralization and integration. In
discussing this interesting finding, we suggested that the negative effects we had hypothesized
actually existed but were perhaps masked by the positive effects of formalization. This may well be true, but with no formal modeling or testing of this interaction we cannot state with certainty that our interpretation is valid. nevertheless, this possibility, as well as the fact that organizational structure variables are often considered in tandem (c.f. Burns & Stalker, 1961), suggests that investigating interaction terms is a promising exercise.
Several other limitations are related to our sample and data. The high performance manufacturing data set prevented us from examining a broader set of structural variables. although prior studies have established the reliability and validity of a majority of the measures
used in our study, future studies should develop finer grained measures of organizational
structure in order to extend our research. also, investigations of industry effects might
provide additional insight to our findings. We controlled for industry effects and examined the potential explanatory role of industry affiliation on all endogenous variables. Analysis
of variance demonstrated that industry effects are minimal. however, our sample includes rather progressive manufacturing industries. future research should examine the impact of organizational structure on integration across other industries, especially less sophisticated industries located in emerging economies. furthermore, our data are cross-sectional, and therefore our results are merely correlational rather than causal. future studies should utilize a longitudinal perspective in order to test for causal relationships. In addition, our hypotheses as they pertain to differences in patterns and levels across regions were exploratory due
to the size of the sample. Our findings demonstrated significant differences across regions