Detection of Micro Calcification on Mammogram through Image Classification
Dr.Sreeja Mole S.S.
Professor, Department of ECE, CJITS, Janagon, India. Email: [email protected]
Article Received: 27 May 2018 Article Accepted: 30 August 2018 Article Published: 07 October 2018
1. INTRODUCTION
The early detection of breast cancer is done by a special type of x-ray called mammography. The classification of
calcium deposits into the affected and non-affected categories is a difficult task, which includes the detection of
tumors as suspicious regions with a weak contrast to their background and the extraction of features which
characterize malignant tumors. Moreover the detection of masses in mammograms are too sensitive and so it is
better to use the supervised and unsupervised classification methods in mammography images in order to describe
of various discriminate characteristics of both true and false phenomenon from the areas. So far many researchers
have gone for the mammography image classification. Li, H.D et al (13) proposed a new segmentation technique
called modified Markov Random Field to detect the calcium deposit in digital mammography classification.
Tughar Bhangale et al (14) proposed an unsupervised scheme for detection of microcalcification on mammograms
with the help of K-Means clustering algorithm.
Our aim in this paper is to perform texture analysis on mammogram in both supervised and unsupervised methods.
The comparative analysis have been done in terms of classification accuracy. In addition to the above contribution,
the complete experiments done, that imparts the different similarity measures. In section 2 explains the existing
texture analysis methods and in section 3 describes the segmentation of medical images. The experimental results
are shown in section 4.
2. EXISTING TEXTURE ANALYSIS METHODS
2.1 Texture Spectrum Operator
The local texture for a given pixel and its neighborhood is characterized by the corresponding texture unit and an
image can be characterized by its texture spectrum in statistical approach for texture analysis which is the
A B S T R A C T
Texture analysis has been very much useful in medical image problems as well as related areas such as computer vision and pattern recognition. Among all medical image task detection of micro calcification on mammograms is the most difficult one because breast cancer is the most prevalent cancer that leads to death in women today. More over micro calcification are deposits of calcium that can be seen in mammograms, which is the best way to detect breast cancer in the earliest stage and also to reduce death from breast cancer. Owing to the small size of micro calcification with a diameter of less than 0.5 mm level and are in the form of groups as clusters and in homogeneous back ground it is very difficult to detect. In this paper, we propose to develop a texture mammography technique for both supervised and unsupervised image classification. In the unsupervised method for the detection of micro calcification, the prior information is required and in the case of supervised method information on micro calcification is very much needed for the processing. Previously many methods have been developed for the detection of micro calcification on mammogram. This paper analyses the texture analysis of mammography images using supervised and unsupervised classification methods and the results identifies that the unsupervised method has high accuracy than the supervised methods.
occurrence frequency function of all texture units within the image [2]. In a square raster digital image each pixel is
surrounded by eight neighborhood pixels. The local texture information for a pixel can be extracted from a
neighborhood of 3×3 pixels which is denoted by a set containing nine elements V= {v0,v1……..v8}, Where v0
represents the intensity value of the central pixel and vi{i=1,2,….8} is the intensity value of the neighboring pixel i)
to define the corresponding texture unit by a set containing eight elements. Texture Unit (TU) = {E1, E2,….,E8}
where EI{i=1,2,…8} is determined by the formula in equation 1
Ei = 0 if Vi< Vo
1 if Vi=Vo
2 if Vi>Vo (1)
For i =1,2,…8 and the element Ei occupies the same position as the pixel i. As each element of Texture Unit (TU)
has one of three possible values with the combination of all eight elements results in 38=6561 possible texture units
in total. Since there are three comparison levels (<, =,>) and have called this method as Texture Spectrum Operator.
For N= 3, the combinations of all the elements results in 38=6561 possible texture units. There is no unique way to
label and order the 6561 texture units that are labeled by using the formula in equation.2.
NTU =
8 1
1 3
I
i i
E ……… (2)
Where NTU represents the texture unit number and Ei represents the element of the texture unit set TU= {E1,
E2,…,E8}. For example, if eight elements are ordered clockwise as shown in Figure 1 and the first element may
take eight possible positions from the top left to the middle left and then the 6561 texture units can be labeled by the
above formula under eight different ordering ways from a to h.
FIGURE 1: Eight Clock wise, successive ordering ways of eight element of the texture unit
Neighborhood Texture unit
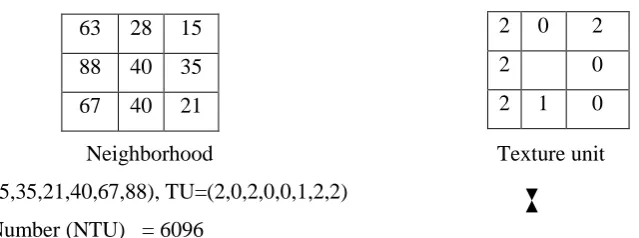
V=(40,63,28,15,35,21,40,67,88), TU=(2,0,2,0,0,1,2,2)
Texture Unit Number (NTU) = 6096
FIGURE 2: Example of transforming a neighborhood to a Texture unit with the Texture Unit Number.
A B C
H D
G F E
63 28 15
88 40 35
67 40 21
2 0 2
2 0
In Figure 2, where the defined set of 6561 texture units describes the local texture aspect of a given pixel and its
neighbors. Thus the statistics of the frequency of occurrence of an image should reveal texture information and
texture spectrum is sensitive to the directional aspect of texture. The undesirable influence of the regional intensity
background is eliminated from the texture spectrum. Here sample images from Mammographic Image Analysis
Society (MIAS) data base have been taken and the optimal window size is selected for the further classification.
2.2 Entropy Based Local Descriptor
Entropy based local descriptor is a measure of information content which measures the randomness of intensity
distribution. The entropy based local descriptor finds the average number of binary symbols needed to code a given
input in terms of probability of that input appearing an a stream.
8
1 log
i i
i
EBLD P P
(3)Such a matrix corresponds to an image in which there are no preferred gray level pairs for the distance vector d.
Entropy based local descriptor is highest when all entries in P [i, j] are of similar magnitude, and small when the
entries in P[i,j] are unequal. Entropy based local descriptor operator described with 28 possible textures and
calculates the entropy of brightness in a local region of the picture.
The entropy value is higher when the brightness in a local region of the picture is low and vice versa resulting the
region seems to be small depending on the entropy value[7][11]. The main objective of Entropy based method is for
the texture measure widely used to quantify the smoothness of image texture since Entropy does not depend on
actual values in texture.
High entropy based local descriptor is associated with a high variance in the pixel values, while low entropy based
local descriptor indicates that the pixel values are fairly uniform. Here 60 sample images have been tested to detect
the suspicious masses on mammographic images.
2.3 Local Binary Pattern Operator
In Local Binary Pattern Operator method uses the operators with eight neighboring pixels using the center as a
threshold by multiplying the threshold values by weights given by powers of two[5][6]. By definition Local Binary
Pattern Operator shown in Figure 3 is invariant to any monotonic transformation of the gray scale and its quick to
compute with larger neighborhoods, the number of possible Local Binary Pattern Operator codes increased
exponentially.
This can be avoided to some extent by considering only a subset of that codes and one approach is to use so called
uniform patterns representing the statistically most Local Binary Pattern Operator. The Local Binary Pattern
LBP =
8 11 2
I
i i
E ….. (4)
Pixels (example) Threshold Weights
FIGURE 3: Computation of Local binary patterns
Local Binary Pattern Operator does not take into account the contrast of texture which is the measure of local
variations present in an image and is important in the description of some textures. Texture spectrum operator is
similar to LBP Operator but it uses three levels that is, two thresholds instead of two levels used in Local Binary
Pattern Operator. This leads to a more efficient representation and implementation than with Local Binary Pattern
Operator and according to experimental tests with the help of varying the widow size for different same set of
mammographic images that were used in TSO and entropy based methods.
2.4 Gray Level Co-Occurrence Matrices
Gray-Level Co-occurrence Matrix (GLCM) is one of the most widely used statistical texture measures [12]. The
idea of the method is to consider the relative frequencies for which two neighboring pixels are separated by a
distance on the image. Since the GLCM collects information about pixel pairs instead of single pixels, it is called a
second-order statistic. Texture measures, such as homogeneity, contrast, and entropy are derived from the
co-occurrence matrix. The different sets of images of MIAS have been tested and compared.
3. TEXTURE SEGMENTATION
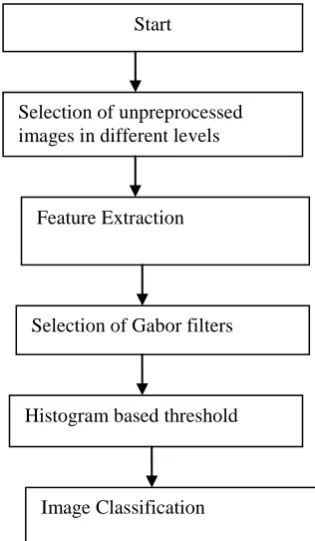
In the view of detecting micro calcification on mammographic images our work has two parts namely segmentation
and classification. The first part starts with the selection of unpreprocessed of size in three levels 128×128 256×256
and 512 ×512 which are then to be extracted in the form of detecting fine textural patterns. For the purpose of
feature extraction here we have chosen Gabor filters. Since the mammographic images frequencies are lying in the
band pass frequency levels that match with Gabor filter frequency. Once the images filtered are then to be subjected
to a histogram based threshold in order to obtain binary images. The Threshold (T) value can be found out by
calculating the mean value which is to be added with the variance. Now the binary image is applied in the four
mentioned texture analysis methods. The same set of procedure to extract the features from the mammographic
images has been applied to the unsupervised classification to the method too using the K-means clustering
algorithm. The methodology for the segmentation method is shown in Figure 4. 7 1 12
2 5 5
5 3 0
1 0 1
0 1
1 0 0
1 0 4
0 16
`
FIGURE 4: Image Classification Procedure
4. EXPERIMENTAL RESULTS AND ANALYSIS
Here Texture Spectrum Operator, Entropy Based Local Descriptor, Local Binary Pattern Operator and Gray Level
Co occurrence Matrix has been evaluated for the same set of MIAS images. The results of classification accuracy
have been computed and compared with the different texture images shown in Table.1. The classification accuracy
for Texture Spectrum operator and Entropy Based Local Descriptor operator achieve less accuracy as compared
with Local Binary Pattern operator and Gray Level Co occurrence Matrix. But the unsupervised K-Means
clustering method outperforms in terms of classification accuracy among all previous methods. In our investigation
60 breast classification images have been used and tested with both supervised and unsupervised methods to
evaluate classification accuracy. The results show that the sensitivity has been 93.5% in classification accuracy
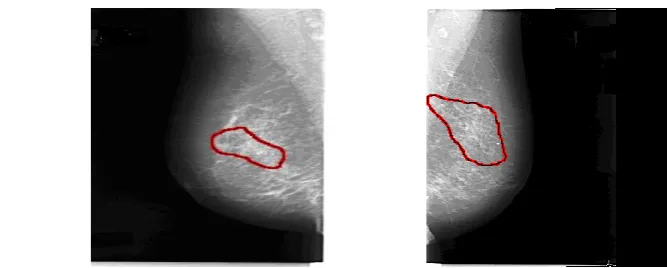
through supervised method and 95% through unsupervised method. The Figure: 5 show the original mammography
images and the Figure 6 shows the detected micro calcifications from the mammogram images for the supervised
image classification.
a
FIGURE 5: Original mammogram suspicious images
Selection of unpreprocessed images in different levels
Feature Extraction
Selection of Gabor filters Start
Histogram based threshold
FIGURE 6: Detected micro calcifications after texture analysis using GLCM and K- means clustering method
Table1: Classification Accuracy of different method
Supervised classification accuracy of LBP and GLCM
89 90 91 92 93 94 95
Number of iterations
C
la
s
s
if
ic
a
ti
o
n
a
c
c
u
ra
c
y
FIGURE 7: Average supervised classification accuracy of LBP and GLCM
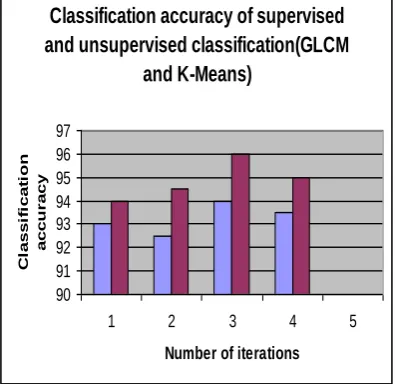
From the Figure 7, it is clearly found that the classification accuracy of GLCM is overtaking other supervised
methods. From the Figure 8, it is also clearly identified that the classification accuracy of K-means method has
Different classification methods Percentage Of mass detection (Classification accuracy)%
Supervised
classification methods
TSO 82
EBLD 90
LBP 92
GLCM 93.5
Unsupervised
classification methods
higher classification accuracy than the GLCM and it is concluded that the unsupervised method is more suitable
than the supervised method for the purpose of finding microcalcification on mammograms.
Classification accuracy of supervised and unsupervised classification(GLCM
and K-Means)
90 91 92 93 94 95 96 97
1 2 3 4 5
Number of iterations
C
la
s
s
if
ic
a
ti
o
n
a
c
c
u
r
a
c
y
FIGURE 8: Average classification accuracy of GLCM and K-Means method
5. CONCLUSION
The images have been taken from the mammogram image analysis society (MIAS) for the validation of the
proposed algorithm. The images used are having 512×512 pixels. Different sizes of range blocks chosen are 16×16,
32 ×32 and 64×64 pixels and the optimal value fixed is 16 to maximize the classification accuracy. The
performance of the algorithm has been evaluated by calculating three parameters namely TP, FP and FN and it is
found that the proposed algorithm is so attractive without compromising the classification accuracy.
REFERENCES
1.Yong HU, Chun-xia Zhao, “Unsupervised Texture Classification by Combining Multi-scale Features and
K-means Classifier” IEEE vol 5 pp1-5, 2009.
2.R. M. Haralick, K. Shanmugan, and I. Dinstein, “Textural features for image classification,” IEEE Trans. Syst.
Man, Cyber, vol. SMC-3, no. 6, pp: 610-621, 1973.
3.R. M. Haralick, “Statistical and structural approaches to texture,” in Proc. IEEE, vol. 67, no. 5, pp. 786-804,
1979.
4.He and Li Wang, Texture unit, Texture spectrum and texture analysis, IEEE Transaction on Geo Science and
Remote sensing 28(4), 509-512, 1990.
5.Hui Zhou, Runsheng Wang, Cheng Wang, A novel extended local-binary-pattern operator for texture analysis,
Information Sciences 178 (2008) 4314–4325.
6.Shu Liao and Albert C. S. Chung Texture classification by using advances local binary patterns and spatial
7. Sreeja Mole S S etal, Extraction and Identification of Tumor Regions from MRI using Zernike Moments and
SVM, IJCTA, Science Press, 8(15),pp.2327.2333, 2015.
8.D. C. He, L. Wang, and J. Guibert, “Texture features extraction,” Pattern Recogn. Lett. no. 6 , pp. 269-273, 1987.
9.L. Van Gool, P. Dewaele, and A. Oosterlinck, “Survey-texture analysis Anno 1983,” Computer. Vision,
Graphics & Image Process, vol. 29, pp. 336:357, 1985.
10. Camps-Valls G. and Bruzzone L.LBP- Based Methods for Hyper spectral Image Classification". IEEE
Transactions on, Image Processing, vol.43, no.6, pp. 1351-1362, June 2005.
11. Sreeja Mole, S.S. and Ganesan, L. “Supervised Classification Of Images Using Textural
Features”, International Journal of Soft Computing, Vol. 4, No. 3 pp. 122-126, 2009.
12. Hong-Choon Ong, Improved Image Texture Classification Using Grey Level Co-occurrence Probabilities
with Support Vector Machines Post-Processing, European Journal of Scientific Research ISSN 1450-216X vol.36
No.1 (2009), pp.56-61.
13. H.D. Li, M. Kallergi, L.P. Clarke, V.K. Jain, R.A. Clark, Markov Random Field for Tumor Detection in
Digital Mammography, IEEE Transactions on Medical Imaging, Vol. 14, No. 3, 1995, pp. 565-576.
14. Tushar Bhangale, U. B. Desai and Upendra Shama, An unsupervised scheme for detection of micro