[Karim* 4(10): October, 2017] ISSN 2349-4506
Impact Factor: 2.785
G
lobal
J
ournal of
E
ngineering
S
cience and
R
esearch
M
anagement
ASSESSMENT OF WATER CONTENT FOR SUB-PAVEMENT LAYERS USING
GPR
Hussein H. Karim*, Hasan H. Joni, Sabah S. Mahood
*Professor, Building and Construction Engineering Department, University of Technology, Baghdad-Iraq
Asst. Professor, Building and Construction Engineering Department, University of Technology, Baghdad-Iraq
M.Sc. in Transportation Engineering, Building and Construction Engineering Department, University of Technology, Baghdad-Iraq
DOI: 10.5281/zenodo.1034503
KEYWORDS
:
GPR, Relative permittivity, volumetric water content..ABSTRACT
Ground penetrating radar (GPR) (500 and 800 MHz) was applied for simulation model constructed in Al-Baladiyat district, Baghdad-Iraq. The obtained data results demonstrated the strongly correlation of electromagnetic (relative permittivity of sub-asphalt layers acquired from GPR) with soil water content. Two-way time, velocity of electromagnetic waves traveled through four section layers of simulation model and their relative permittivity as well as the volumetric water content have been calculated. Two formulas have been derived from GPR data to find a relation between volumetric water content and relative permittivity for crushed gravel and selected granular materials used for base and sub-base layer successively. Thus, water content can be estimated from available empirical equations or from equations derived from the obtained data.
INTRODUCTION
One of the main contributors to degradation and earlier failure of flexible pavements is the presence of excessive water within the pavement layers. Water from many sources enters a pavement layers. The biggest source of water in pavement is surface infiltration (Cedergren et al., 1973). This infiltration happens through cracks and joints in the pavement also through the pavement materials. Additional sources consist the rising ground water, seepage, capillary action, and vapor movement.
Information about subsurface moisture content is very essential for roads protective maintenance schedule, as well as for road pavement design. Water content estimation of sub-asphalt layers provides knowledge for highway engineers about the performance pavement layers and drainage system (Grote et al., 2002). Direct and indirect implementations can be utilized to estimate the volumetric water content of soils. The direct methods comprise the drying and weighing a known volume of a soil sample (gravimetric method). The indirect methods are based on the relations of some physical properties of the soil with its water content (Schlaeger et al., 2005).
Ground penetrating radar (GPR) survey is an indirect and an invasive application of the geophysical techniques which enables the user to perform rapid and inexpensive investigation with time saving and consequently assist highway engineers in early identifying projects most needed for repair and maintenance. Estimation of soil water content using Common-Offset GPR measurements mode facilitates rapid data acquisition (Karim et al., 2016a). Also it can be used for new projects through detecting the engineering properties of pavement thickness, highway foundations and bridge deterioration (Karim et al., 2016b)
[Karim* 4(10): October, 2017] ISSN 2349-4506
Impact Factor: 2.785
G
lobal
J
ournal of
E
ngineering
S
cience and
R
esearch
M
anagement
PRINCIPLES OF GPR
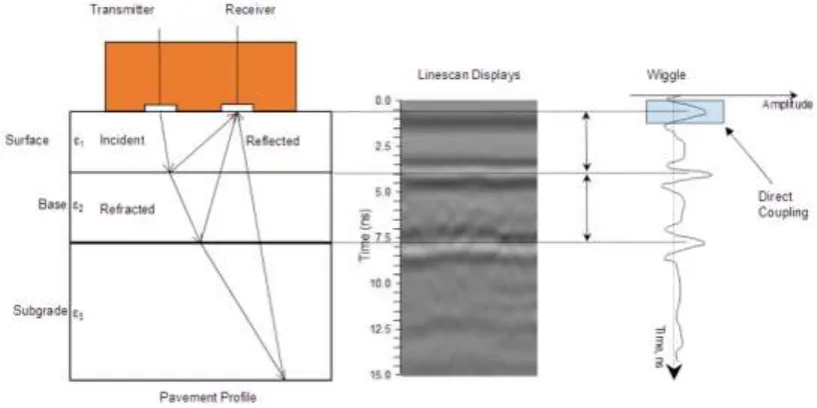
GPR uses the principles of transmitting electromagnetic waves to identify the variation in subsurface properties. When GPR antenna sends electromagnetic waves they move through the material at a velocity depending on the dielectric constant of the material, when waves encounter another material with different dielectric properties, parts of the wave is reflected to the surface and is received by the receiver, parts of the wave continues to travel downward until it is attenuated. The rate of signal attenuation depends on the materials dielectric properties and conductivity. If the materials conductivity is high as in, wet clays, the signal is dissipated rapidly. The strength or amplitude of the reflection is related to the contrast in the dielectric constants of the materials For example, If a pulse moves from dry sand (with a dielectric constant of about 5) to wet sand (with a dielectric constant of about 25), a strong reflection will be produced. But when a pulse moves from dry sand to lime stone (with a dielectric constant of about 6) it will produce a week reflection.
In ground-coupled antenna scans, the first positive peak produced in the data are pointed to as direct coupling (GSSI 2006), which happen in the starting of the scan and is used to detecting the pavement surface position. The surface zero position is corrected in the data, by identifying this in the lines scans as illustrated in Figure (1) (Hu, 2015).
Figure 1: Ground penetrating radar principle (Hu, 2015).
PROPAGATION OF RADAR WAVES
Maxwell’s equations described the propagation of Ground radar radiation (Reynolds, 1997). Which are treated in detail by Carcione (1996) and Greaves et al. (1996). Velocity and attenuation describe the propagation of high-frequency radio waves in the ground (Davis and Annan, 1989). The speed of radio waves (V) in medium is dependent on the speed of light in free space (c= 0.3 m ns-1), the relative dielectric constant (𝜀
𝑟 ) and the relative
magnetic permeability (μ=1 for non-magnetic materials) and is given by (Reynolds, 1997;Charelton, 2008).
𝑣𝑚= 𝑐
√{(𝜀𝑟 𝑢𝑟2 ) [(1+𝑝2)+1]} (1)
Where 𝑝 is the loss factor =𝜎/𝜔𝜀 , 𝜎 is the conductivity (S/m), 𝜔 = 2𝜋𝑓, 𝑓 is frequency(𝐻𝑧), 𝜀 (= 𝜀𝑟𝜀0) is the permittivity and 𝜀0 is the permittivity of free space (8.854 ×10⁻¹²F/m). Radar signal velocity in low-loss geological
materials (𝑝 ≈ 0) which are amenable to radar sounding is related to 𝜀𝑟 by (Davis and Annan, 1989):
𝑣𝑚=√𝜀𝑐
𝑟 (2)
[Karim* 4(10): October, 2017] ISSN 2349-4506
Impact Factor: 2.785
G
lobal
J
ournal of
E
ngineering
S
cience and
R
esearch
M
anagement
materials. Obviously the values tend to range between 3 and 8 unless wet, because the dielectric constant of water is higher than that of most other geological materials. Consequently, variations in the electrical properties of soil are associated with changes in volumetric moisture content (Davis and Annan, 1989).
DIELECTRIC PROPERTIES OF ERTH MATERIALS
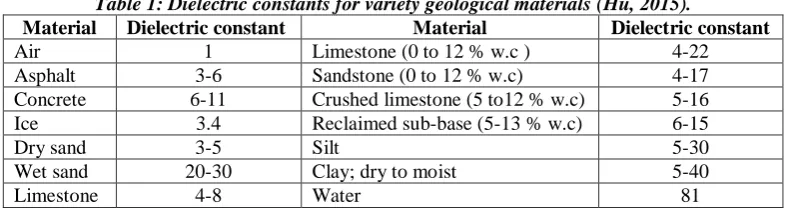
The important factors affecting the dielectric properties of geologic materials are porosity, clay content, and water saturation and used frequency antenna. The dielectric value depend upon the ability of a material to store a charge for a given applied field strength. Table (1) illustrates the dielectric constant values for a variety of geological materials.
Table 1: Dielectric constants for variety geological materials (Hu, 2015).
Material Dielectric constant Material Dielectric constant
Air 1 Limestone (0 to 12 % w.c ) 4-22 Asphalt 3-6 Sandstone (0 to 12 % w.c) 4-17 Concrete 6-11 Crushed limestone (5 to12 % w.c) 5-16 Ice 3.4 Reclaimed sub-base (5-13 % w.c) 6-15 Dry sand 3-5 Silt 5-30 Wet sand 20-30 Clay; dry to moist 5-40 Limestone 4-8 Water 81
Obviously the values tend to range between 3 and 8 unless wet, because the dielectric constant of water is higher than that of most other geological materials. Consequently, variations in the electrical properties of soil are associated with changes in volumetric moisture content (Davis and Annan, 1989).
Generally, a soil medium is, a four-component dielectric mixture containing air, bulk soil, bound water, and free water (Hallikainen et al., 1985). Four parameters combine to create the dielectric constant of soil materials (Knoll and Knight, 1994): the individual dielectric constants of components, the volume fractions of the components, the geometries of the components and the electrochemical interactions between the components. Since the dielectric constant of the soil-water mixture is a function of the water volume fraction in the mixture the volumetric measure of moisture content (θv) is preferred (Hallikainen et al., 1985; Charlton, 2008)
ESTIMATION OF WATER CONTENT USING GPR
GPR technique is implemented in highway engineering for estimating pavement layer thickness, water content of sub-asphalt layers, and assessing some pavement conditions, like moisture-related pavement damage (Chen et al., 2009). The dielectric properties of the materials are strongly affected by soil-water-air systems. These properties can be detected from the reflected GPR wave information. A dielectric constant increment refers to moisture content increasing in soil materials. GPR is a robust, reasonable, and high achievement nondestructive testing device to solve some engineering problems relevant to highway implementations such as measuring pavement layer thickness, and, water content of sub-asphalt layers. Since relative permittivity of water about 81 whereas soil, concrete and asphalt materials have relative permittivity ranging from (3 to 8) as well as air with relative permittivity of 1, relative permittivity measurement can be used for estimating moisture content. GPR as a continuous and nondestructive tool to evaluate pavement layer is of great importance. GPR surveys on pavement water content can be divided into two parts: the first concerns water content in sub-asphalt layers, the other considers the moisture content within pavement layers. The most commonly used model was improved by Topp et al. (1980), which is a third-order polynomial relationship. Topp’s model has been used with good results in a range of Soils (Chen et al., 2009).
FIELD WORK AND INSTRUMENTATION
[Karim* 4(10): October, 2017] ISSN 2349-4506
Impact Factor: 2.785
G
lobal
J
ournal of
E
ngineering
S
cience and
R
esearch
M
anagement
The dimensions of the simulation model used were 5m × 1.5m. It was constructed by spreading and compacting three layers, sub-grade, sub-base and base course. Firstly natural ground was leveled and covered by polyethylene sheet to prevent transmission of water from natural ground to sub-grade specially during rainfall as shown in Figure (3).
The model was divided into four sections; the width of the first and fourth sections was 1.375m, while for the second and third sections was 1.125 m. Water content of each layer was increased gradually from the first to the fourth section. The sub-grade and sub-base designed thickness was 20cm, they were constructed by two 10cm lift for each one. The materials of the first section were placed without adding water (its materials contain only natural water). Then, different quantities of water were added to materials of the sections 2, 3 and 4 with gradual increase of water in the successive sections. The last layer (base course) was constructed with the same stages but with one 10cm lift. The details of the simulation model used are depicted in Figure (4).
[Karim* 4(10): October, 2017] ISSN 2349-4506
Impact Factor: 2.785
G
lobal
J
ournal of
E
ngineering
S
cience and
R
esearch
M
anagement
Figure 3: Isolation of simulation model to prevent transmission of water from natural ground.
(a)
[Karim* 4(10): October, 2017] ISSN 2349-4506
Impact Factor: 2.785
G
lobal
J
ournal of
E
ngineering
S
cience and
R
esearch
M
anagement
(c)
Figure 4: The details of simulation model, (a) top view (b) cross section, and (c) schematic diagram with locations of the buried steel plate.
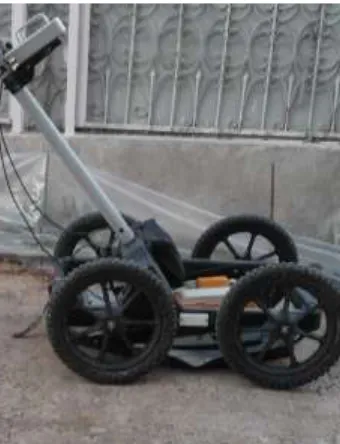
The used GPR equipment was available in University of Technology/ Building and Construction Engineering Department. The equipment comprised the Rough terrain cart, the Professional Explorer (Control unit ( and the RAMAC antennas. Two frequencies 500 and 800 MHz shielded type were used in this study. The shielded electronic unit contains both the transmitter and receiver with fixed separation, 18 cm and 14 cm for the mentioned antennas respectively. This configuration called single fixed-offset or common- offset mode. Figure (5) shows the used GPR equipment. Software -RAMAC Explorer was used to interpret acquired data.
Figure 5: GPR equipment (Ground coupled system).
GPR PROFILES FOR SIMULATION MODEL
[Karim* 4(10): October, 2017] ISSN 2349-4506
Impact Factor: 2.785
G
lobal
J
ournal of
E
ngineering
S
cience and
R
esearch
M
anagement
Figure 6: Traverses location of GPR survey for simulation model.
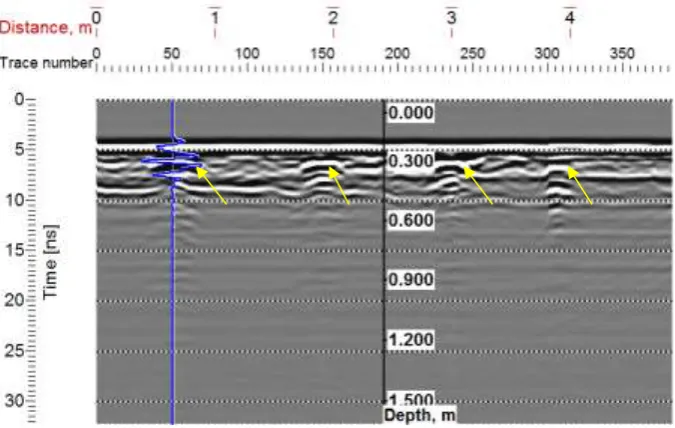
From GPR Survey, three radargrams were acquired with antenna frequency 500 MHz. The same number of radargrams was obtained with 800 MHz antenna frequency.The buried steel plates under base and sub-base layers were appeared, while the plates under sub-grade did not appear. The reason for this is that the sub-grade layer was constructed from wet clayey soil which has low resistivity. Besides, this character makes the sub-grade soil attenuates the radar signals. The high sensitivity to soil texture and electrical conductivity reduces the range of soils where GPR can successfully be applied (Huisman et al., 2003). Figure (7) illustrates the radargram of profile performed with 800 MHz, arrows point to the locations of steel plates which were buried under base layer.
Figure 7: Radagram of Profile which was performed using GPR with 800 MHz antenna frequency over steel plates buried under base layer.arrows point to plate locations.
Later, additional water was injected in base and sub-base layers in section 4 of the simulation model to increase water content in this section to demonstrate the effect of increasing water content on data acquired from GPR survey, further GPR profiles were performed with same mentioned approach.
[Karim* 4(10): October, 2017] ISSN 2349-4506
Impact Factor: 2.785
G
lobal
J
ournal of
E
ngineering
S
cience and
R
esearch
M
anagement
GPR DATA INTERPRETATION
The relative permittivity of base and sub-base layers in each section were estimated by calculating the electromagnetic wave velocity between the surface and the buried reflectors (steel plates). The velocity from the surface to the buried reflectors was calculated by measuring the two way time. The two way time is the interval in which energy travels vertically from the ground surface to the buried reflector and back, and it occurs when the GPR apparatus is directly over the center of the reflector (Grote el at., 2002). After measuring the two way time (twt), the electromagnetic waves velocity was calculated by using the following formula:
𝑣=2d/twt (3) where v is the electromagnetic wave velocity and d is the depth or interval through which two-way time (twt) is measured (Huisman et al., 2003).
Then relative permittivity was estimated from relationship (2) 𝑣 = 𝑐
√ὲ (4)
where 𝑐 is free space electromagnetic propagation velocity (30cm/ns); ὲ is relative permittivity (Huisman et al., 2003).
The actual part of dielectric permittivity of fresh water during megahertz to gigahertz bandwidth is approximately 81, where the permittivity of air is 1 and of most ordinary soil constituents is around (3 to 10).This large contrast in permittivity explaining the success of soil water content measurement with electromagnetic technique with this frequency band.
There are already several empirical formulas to define the relationship between apparent permittivity and volumetric soil water content. The common ones for sandy soils are Alharathi and Feere formulas(Zhang, 2012):
θ = 0.128√ὲ − 0.204 (4)
θ = 0.1181√ὲ − 0.1841 (5) 5 The most widely used one is Topp formula (Topp, 1980)
θ = − 0.053 + 0.0293ε − 0.00055ε2+ 0.0000043ε3 (6)
where θ is the volumetric water content.
Two way time, electromagnetic wave velocity and relative permittivity of base and sub-base layers were calculated using formulas 1 and 2.
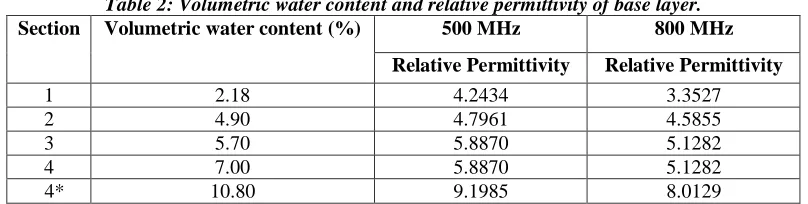
Gravimetric water content and estimated relative permittivity of base and sub-base layers are listed in Tables 2 and 3 respectively.
Table 2: Volumetric water content and relative permittivity of base layer.
Section Volumetric water content (%) 500 MHz 800 MHz
Relative Permittivity Relative Permittivity
1 2.18 4.2434 3.3527 2 4.90 4.7961 4.5855 3 5.70 5.8870 5.1282 4 7.00 5.8870 5.1282 4* 10.80 9.1985 8.0129 4*: section 4 after injecting additional water.
Table 3: Volumetric water content and relative permittivity of sub-base layer.
Section Volumetric water content (%) 500 MHz 800 MHz
Relative Permittivity Relative Permittivity
[Karim* 4(10): October, 2017] ISSN 2349-4506
Impact Factor: 2.785
G
lobal
J
ournal of
E
ngineering
S
cience and
R
esearch
M
anagement
4 12.60 8.7370 9.3949 4* 15.96 9.7356 10.0324
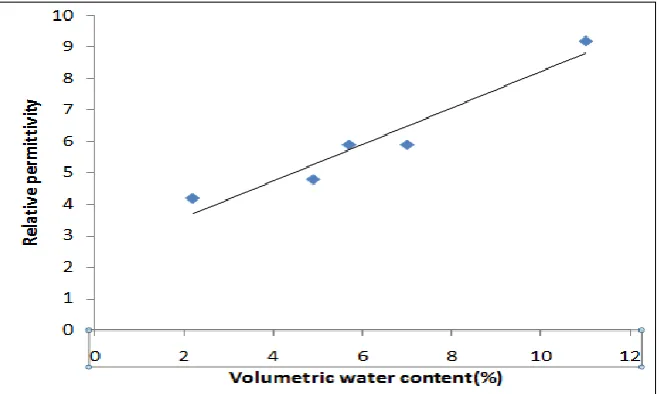
The relation of variation of relative permittivity against volumetric water content for base layer was plotted in Figures (8), (9) and for sub-base layer in Figures (10) and (11).
Figure 8: Variation of relative permittivity against volumetric water content in base layer using 500 MHz antenna.
[Karim* 4(10): October, 2017] ISSN 2349-4506
Impact Factor: 2.785
G
lobal
J
ournal of
E
ngineering
S
cience and
R
esearch
M
anagement
Figure 10: Variation of relative permittivity against volumetric water content in sub-base layer using 500 MHz antenna.
Figure 11: Variation of relative permittivity against volumetric water content in sub-base layer using 800 MHz antenna.
Obviously there is a linear relation between relative permittivity and water content but there is some difference in relation concluded of data acquired from base and sub-base layers due to the different materials used in constructing each layer.
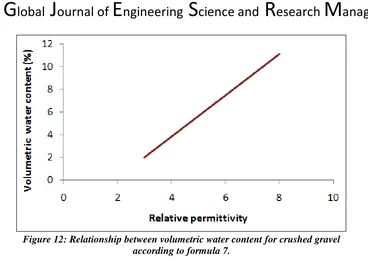
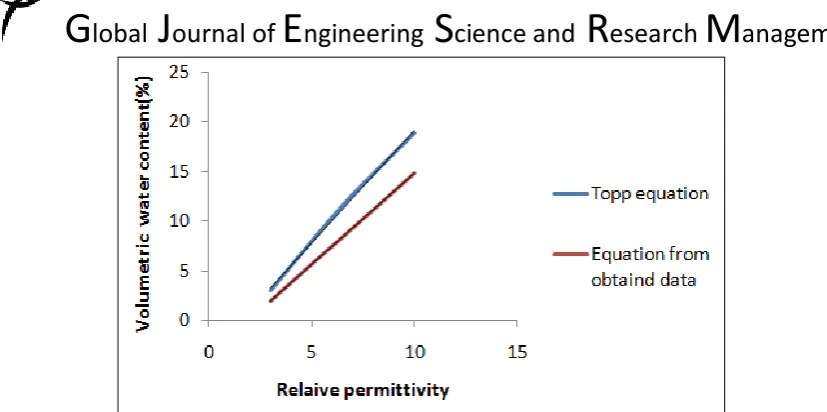
A linear regression was performed to find the relationship between volumetric water content relative permittivity for crushed gravel and selected granular materials used for base and sub-base layer successively. The obtained two formulas are listed below:
∅ = 1.8203 ∈ −3.4183 𝑤𝑖𝑡ℎ 𝑅2=0.96 (7(
∅ = 2 .1106 ∈ −5.5848 𝑤𝑖𝑡ℎ 𝑅2=0.95 (8)
[Karim* 4(10): October, 2017] ISSN 2349-4506
Impact Factor: 2.785
G
lobal
J
ournal of
E
ngineering
S
cience and
R
esearch
M
anagement
Figure 12: Relationship between volumetric water content for crushed gravel according to formula 7.
Figure 13: Relationship between volumetric water content and relative permittivity for selected granular materials according to formula 8.
[Karim* 4(10): October, 2017] ISSN 2349-4506
Impact Factor: 2.785
G
lobal
J
ournal of
E
ngineering
S
cience and
R
esearch
M
anagement
Figure 14: Comparison between predicted data calculated with Topp formula and formula 7.
Figure 15: Comparison between predicted data calculated with Topp formula and formula 8.
The volumetric water content of the base and sub-base layers was calculated by using derived equations 7 and 8, the results were compared with others which obtained by gravimetric method as tabled in Table (4).
Table (4): Comparison between calculated and gravimetric water content.
Deviation Volumetric water content
(%) (gravimetric) Volumetric water content
(%) (calculated) Layer
0.008- 5.28
4.46 Base
0.006- 12.10
11.47 Sub-base
CONCLUSIONS
1. The study showed that the common-offset GPR reflection data can be used to estimate volumetric water content in sub-asphalt layers. The implemented methodology provided a technique for obtaining quick and noninvasive estimates of water content. This method is applicable at sites where the layer thickness (or depth to the reflector) can be estimated with sufficient accuracy.
[Karim* 4(10): October, 2017] ISSN 2349-4506
Impact Factor: 2.785
G
lobal
J
ournal of
E
ngineering
S
cience and
R
esearch
M
anagement
attenuation of electromagnetic signals when traveled through wet clay, this phenomenon limits GPR implementation in this type of soils.
3. The relative permittivity values of observed crushed gravel ranging from 3 to 9 with volumetric water content from 2% to 11%, and relative permittivity values of selected granular materials ranging from 4 to 10 with volumetric water content from 4% to 16%.
4. The deviations of estimated volumetric water content values by GPR profiling from values obtained by gravimetric method were -0.008 and -0.006 for crushed gravel and selected granular materials respectively.
REFERENCES
1. Carcione, J.M., 1996, "Ground-penetrating radar: wave theory and numerical simulation in lossy anisotropic media", Geophysics, Vol. 61, No. 6, pp.1664-1677.
2. Cedergren, H.R., Arman, J.A., and O’Brien, K.H., 1973, "Development of guidelines for the design of subsurface drainage systems for highway pavement structural sections", FHWA-RD-73-14. Federal Highway Administration, Washington, DC.
3. Charlton, M.B., 2008, "Principles of ground-penetrating radar for soil moisture assessment", MB Charlton.com Research.
Nothttp://www.publications.mbcharlton.com/ResearchNotes.html.
4. Chen, C. and Zhang, J., 2009, "A review on GPR applications in moisture content Determination and pavement condition assessment", Characterization, Modeling, and Performance of Geomaterials, Geotechnical special publication no. 189, pp. 138-143.
5. Davis, J.L. and Annan, A.P., 1989, "Ground-penetrating radar for high-resolution mapping of soil and rock stratigraphy", Geophysical Prospecting, Vol. 37, pp.531-551.
6. Karim, H. H., Joni, H. H. and Dawood, A.A., 2016a, "Analysis of changes in soil volumetric water content using common-offset GPR", Global Journal of Engineering Science and Research Management, Vol. 3, No. 9, pp.69-80.
7. Karim, H. H., Joni, H. H. and Dawood, A. A., 2016b, "Ground penetrating radar technique for assessing pavement thicknesses and bridge deterioration", International Journal of Current Engineering and Technology, INPRESCSO, Vol. 6, No. 5, pp.1770-1779.
8. Greaves, R.J., Lesmes, D.P., Lee, J.M. and Toksöz. M.N., 1996, "Velocity variations and water content estimated from multi-offset, ground-penetrating radar", Geophysics, Vol. 61, No. 3, pp.683-695. 9. Grote, K., Hubbard, S..and Rubin, Y., 2002, "GPR monitoring of volumetric water content in soils
applied to highway construction and maintenance", Leading Explore, Vol. 21: pp.482-485.
10. Hallikainen, M.T., Ulaby, F.T., Dobson, M.C., El-Rayes, M. and Wu, L. K. (1985), "Microwave dielectric behavior of wet soil – Part I: Empirical models and experimental observations", IEEE Transactions on Geoscience and Remote Sensing GE- Vol. 23, No. 1, pp.25-34.
11. Hu, J., 2015, "Non-destructive field assessment of flexile pavement and foundation layers", Graduate thesis and Dissertations", Paper 14375.
12. Huisman, J.A., Hubbard, S.S., Redman, J.D. and Annan, A.P., 2003, "Measuring soil water content with ground penetrating radar: A review", Vadose Zone Journal, Soil Science Society of America, Vol. 2, pp.476-491.
13. Knoll, M.D. and Knight, R., 1994, "Relationships between dielectric and hydrogeologic properties of sand-clay mixtures", Proceedings of the Fifth International Conference on Ground Penetrating Radar, Kitchener, Ontario, 12-16 June 1994, pp.45-61.
14. RadExplorer v.1.4.2, 2005, "The software for GPR data processing and Interpretation, User Manual", from http/www.malags.com.
15. Reynolds, J. M., 1997, "An introduction to applied and environmental geophysics", Chichester: Wiley, 796P.
16. Schlaeger, S., H ̈ubner, C. and Becker, R., 2005, "Simple soil moisture probe for low-cost measurement applications", Proc. 6th Conf. on Electromagnetic Wave Interaction with Water and Moisture Substances: ISEMA 2005 (Weimar, Germany, 29 May–1 June 2005.