Volume 67, 2019, Pages 25–36
Proceedings of the 7th OpenSky Workshop 2019
VAT to the Future:
Extrapolating Visual Complex Event Processing
Christian Beilschmidt, Johannes Dr¨
onner, Nikolaus Glombiewski,
Michael K¨
orber, Michael Mattig, Andreas Morgen, Bernhard Seeger
University of Marburg Marburg, Germany [email protected]
Abstract
A key technology to analyze high volume spatio-temporal data streams is complex event processing (CEP). CEP is unique in its ability to not only continuously process data as it arrives through common operations such as aggregations, but also to support pattern matching queries. Pattern Matching allows to detect a user-defined sequence of temporal predicates on event streams. The high volume flight data as provided by the OpenSky Network has a lot of characteristics that make it a perfect match for CEP. In particular, pattern matching operators can be utilized to detect a plethora of movement (landing, starting, evasion) and group patterns (airplanes closing in on each other) in a timely man-ner. However, CEP queries can be complex in nature and may require a combination of domain expertise and historical data analysis in order to deliver the desired results. In order to address these issues, we have combined a database-backed CEP system (Chroni-cleDB) with a scientific toolbox for interactive data exploration and geo visualization (Vat System). This allows users to interactively execute CEP queries and visually confirm the validity of their results, thus, simplifying the parameter tuning considerably.
In addition, our solution supports efficient and interactive time travel queries. It allows to combine event streams with additional data sources (e.g., remote sensing images) and processing technologies (e.g., machine learning models) to extract higher level knowledge. Finally, our ongoing work on visual analytics explores extrapolating query results to provide more timely feedback for critical situations and multi-query optimization techniques to allow for an even more efficient system in general.
1
Introduction
spatio-temporal information (location and timestamp) which requires specialized query seman-tics. One of the key technologies to handle the new data landscape is complex event processing (CEP). Event processing systems are designed to handle a variety of sources and one of its core operations, pattern matching, is optimized for low latency detection of user-defined sequences of temporal predicates on data streams.
Flight data as provided by the OpenSky Network [15] share a lot of the characteristics described above. Due to large amount and variety of airplanes as well as high-frequency updates, there is a plethora of movement (landing, starting, evasion) and group patterns (airplanes closing in on each other), which can be continuously monitored with CEP to avoid potential catastrophes like collisions. However, tuning the parameters of a CEP query to deliver the desired results is challenging and typically requires a combination of domain expertise and historical data analysis. Furthermore, in many cases pure CEP queries need to be combined with additional data sources (e.g., remote sensing images) and processing technologies (e.g., machine learning models). To alleviate some of those challenges, this work utilizes an often overlooked key characteristic for data analysis that flight data exhibits: It can be visualized.
Even though there are a lot of powerful tools that can deal with complex data challenges, the presence of visual analytics in the overall workflow is often neglected while designing the processing layer. Visualization is usually built on top of those solutions. However, especially in the realm of spatio-temporal data, there are usually some inherent visual components users can benefit from. Flight trajectories and weather information possess visual information that helps both air traffic control and pilots to judge the current situation. In practice, the on top solutions feature a user interface tailor made for showing results returned from a specific set of pre-defined queries. Although those interfaces work great for handling the well-defined tasks they are designed for, more intricate analytical tasks in a big data pipeline require a higher level of interactivedata exploration. A data scientist needs to try out advanced queries and test out various data set combinations to find novel insights. In particular, this requires tuning a multitude of parameters to achieve high quality results.
The results of the mindset described above are two extremes. On the one hand, there are highly optimized user interfaces for precise functionality that lack flexibility and adaptability to explore new ventures. On the other hand, data scientists searching for new solutions are continuously building short-lived pipelines. Even though this approach has a high degree of design freedom, a lack of reusable workflows for visual analytics results in a lot of repetitive programming efforts. While searching for new insights, a lot of time is invested to enable exploration (e.g., data conversion and one-off scripts) rather than the exploration itself.
TheVisualization,Analysis andTransformation (Vat) System [5,6] aims to bridge the gap between those two extremes throughexploratory workflows. Vatwas developed and optimized for processing stationary vector and raster data, making it a prime candidate to work with importantflight-related data sets such as weather data. For interactive visualization and anal-ysis of high volume event data as provided by the OpenSky Network, we connectedVat with ChronicleDB [18, 17], a stream database system featuring high ingestion rates and operations for CEP-style event processing.
Vector Data
Raster Data VAT System
WAVE MAPPING
JEPC Users
Event Data ChronicleDB CEP
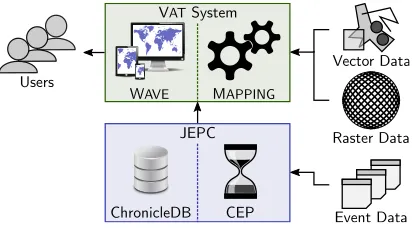
Figure 1: This figure shows the overall architecture of the combined system components.
In this extension of our previous work, we expanded our system in two ways in order to improve the performance and analytic capabilities of the three use cases sketched above. First, while we previously focused on capturing the current status, e.g. showing flightscurrently in severe weather conditions, we now present our first results forextrapolation, e.g. showing flights potentially entering severe weather conditions in the near future. Through extrapolating event queries, we are laying the foundation for a high potential controlling solution that simplifies the process of preventing dangerous situations. Second, we introduce multi-query optimiza-tion, which reduces the processing load for all involved components, and thus, enhances the interactivity and user experience.
In summary, our solution offers the first important building blocks for visual event-based flight analytics. Users can interactively try, adjust, and explore the results of a diverse com-bination of spatio-temporal processing mechanics while finding the right setting of queries for complex coherences between flight-related data sets. In particular, our contributions are as follows:
• we present exploratory workflows for interactive time travel queries by integrating Chron-icleDB into theVatSystem;
• we extend analytic capabilities with predictions based on trajectory extrapolation;
• we introduce multi-query optimization to improve the overall system performance.
The rest of the paper is organized as follows: We give an overview of our system and describe the newly developed components inSection 2. Afterwards, we describe three aircraft related use cases and how they benefit from our proposed extrapolation and multi-query optimization techniques inSection 3. We conclude our paper and describe potential future work in this area inSection 4.
2
System Overview
2.1
General Architecture
The overall system architecture is depicted inFigure 1. Our system consists of two major com-ponents, each of which is specialized for a respective data domain (vector/raster and event data). For the targeted use cases, users interact with theVisualization,Analysis andTransformation (Vat) System. Vatis an interactive spatio-temporal processing platform consisting of a process-ing backend (Mapping) and a web based frontend (Wave). Mappingsupports heterogeneous spatio-temporal data and offers composable operators for transformation and analysis tasks. For instance, it supports geographical projections, spatio-temporal joins of different data types and aggregation mechanisms [7]. For performance reasons, operators are designed to use par-allel processing on manycore systems and GPUs [4]. Wavefacilitates the exploratory usage of
Mapping. It depicts results of complex queries as layers on an interactive map. New layers
are generated on the fly by combining existing ones via operators. The system keeps track of all processing steps taken by the user and stores this information as exploratory workflows. Hence, users are able to return to any previous processing step and start over with new ideas. Moreover, it follows reactive design principles such that all computations and their results are restricted to the user selected map section and time interval. BecauseVat treats all data sets as time series, it is particularly beneficial for spatio-temporal analyses on sliding time windows. In addition,Vatserves as an integrated repository for various spatial data sources including a selection of vector and raster data sets, e.g. climate and surface data, and offers a connectivity interface for data import from external systems.
WhileVat is designed for processing static vector and raster data, flight data as provided by the OpenSky Network is comprised of short lived continuously arriving event data. Since the storage engine of Vat is not optimized for this kind of workload, we implemented a con-nection fromVat to Java Event Processing Connectivity (Jepc), a middleware for uniform event processing. As depicted in Figure 1, two of the core features in Jepc are the utiliza-tion of the dedicated event storage system ChronicleDB and native, specialized CEP operators for advanced temporal [12] and spatio-temporal pattern matching queries. To facilitate the interaction betweenVat and Jepc, ChronicleDB serves multiple roles. First, in order to not overwhelm users with information, visual systems usually have a configurable refresh rate for which they poll the latest data updates. For this purpose, ChronicleDB serves as a dedicated queue with index support to speed up CEP replay queries. Second, since a user should be able to adapt queries on the fly and to verify their validity on historical data, ChronicleDB supports efficient time travel queries. In combination both features significantly reduce query response times, resulting in a solid foundation for interactive visual event analytics.
2.2
Extrapolation Framework
Partitioned History (Main
Memory)
Operator Operator Data Sink
Data source
Forward input
Extrapolate n events per partition Extrapolator
Timespan: 5 minutes Count: 1 event Partition By: Attribute i Attribute 1: Linear ...
Attribute n: Last known value
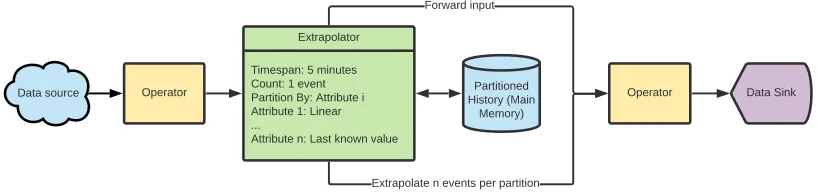
Figure 2: Overview of the extrapolation framework.
the extrapolation method depends on the actual scenario and is critical for the quality of the produced results.
We opt for the second approach and introduce an extrapolation framework intoJepc. The framework is flexible regarding the specification of the extrapolation method, and hence app-plicable to a wide range of use-cases. Figure 2 gives an overview of the framework. Its core component is the so-called Extrapolator, which is implemented as a regular operator within
Jepc. While data arrives, the operator is passive. It builds an in-memory history of the
re-ceived events and forwards all data items downstream without any modifications. After the end of the input stream is reached, the Extrapolator uses the in-memory history to extrapolate future events according to its configuration. It is easy to see that this process is transparent for the downstream operators, which allows us to insert extrapolation in between any two adjacent operators of a query graph.
The Extrapolator is configured via a small set of parameters: Timespan,Count,Partition By andPredictors. The meaning of those parameters is as follows. Timespan specifies how far to extrapolate (e.g., five minutes from the last received event). ViaParition By, the input stream is logically partitioned, and extrapolated events are generated for each of those partitions. Countdetermines the number of events to extrapolate per partition. Finally,Predictorsspecify how to forecast the attribute values of the generated events (e.g., last-known value or linear extrapolation).
Assuming flight data consisting of an unique aircraft id (ID), the current location (LOC), velocity (VEL) and a timestamp (T), a simple linear 5 minute extrapolation would be defined as follows: Timespan=5 minutes,Count=1,Partition By=ID,Predictors=[ID=Last-known value, LOC=linear, VEL=linear]. This configuration partitions the incoming data stream according the ID attribute, i.e., generates one partition per aircraft. For each partition, it extrapolates Count=1 event that linearly predicts LOC and VEL 5 minutes into the future while carrying over the ID from the previous event. Note that for this example, the main-memory history needs to hold only two events per partition for a linear extrapolation, making it very memory efficient.
With the proposed framework, we enableJepcto extrapolate arbitrary event queries. This way, any existing query that detects situations of interest can seamlessly be turned into a predictive query. The framework currently offers methods for last-known value, linear extrap-olation and rotational extrapextrap-olation. Considering the values xt−h,...,t for the current history
ofhprior events andy for the next (yet unknown) event,last-known value sets the predicted next value ˆy =xt. This is particularly useful for non-changing values like the ID in the above
VAT Event QueryMerged Queries ChronicleDB
VAT Event
Query Collected
Queries Merge Multi-Query
Optimization Collect x queries. Wait for up to y timestamps
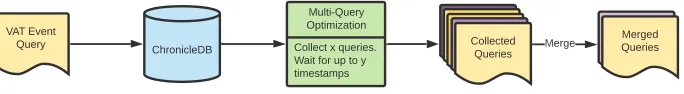
Figure 3: Overview of multi query optimization process.
movement. Rotational extrapolation additionally calculates the angleθ between−−−−−−→xt−2xt−1 and
−−−−−−→
xt−3xt−2 (h = 2). Then, it utilizes the output of the linear extrapolation and rotates it by
θ using a rotation matrix. This method augments the linear extrapolation by incorporating rotational momentum of the trajectory. It should be emphasized that these three methods are based solely on the in-memory history maintained by the Extrapolator.
For future work, we plan to introduce more advanced extrapolation methods from machine learning like averaging and matching via clustering methods ([1,2]) or recurrent neural networks ([19, 21]) that incorporate historical data and learn characteristics from a dataset. Besides pre-defined extrapolators, we allow users to define custom extrapolation methods making our framework applicable even for highly specialized use-cases.
2.3
Multi-Query Optimization
Since one of the core motivations for our work is interactive data exploration, the overall performance of the combination of VatandJepccannot be neglected. In order to facilitate a smooth user experience, we need to minimize processing delays in order to encourage an ongoing exploratory process. Given our overall architecture (Figure 1) and the event processing scope of this work, this means optimizing the processing pipeline betweenJepcandVat.
As a first step in our ongoing work on query optimization, we target a couple of key char-acteristics of exploratory workflows. In general, users will start creating their workflow by requesting data from a data source. In the process of trying out different operators and com-bining information to derive new insights, a user will create multiple branching workflow paths from a data source. In essence, this operational pattern results in multiple Wave operators requesting the same data source over and over again. This effect is amplified due to the spatio-temporal nature of the systems - a worfklow is usually created and evaluated in a specified time interval and region. Afterwards, the same workflow may be visually verified and changed in other spatio-temporal bounding boxes.
Although repeated requests to the same data can be efficiently handled through caching mechanisms (e.g., a LRU main memory cache), replaying high volume data streams such as flight event data requires a very large cache to avoid cache misses. Furthermore, stateful event processing operators such as joins, aggregation and especially pattern matching require interim results, which further degrades the overall cache performance. Given the unknown target of the data exploration process, dropping operators, changing regions and/or time intervals may render ChroicleDBs system cache essentially useless with just a couple of clicks.
Therefore, we opt to support the caching mechanism with an additional optimization layer targeted towards multi-query optimziation. The overall optimization process is depicted in
constraints close to the source are merged and additional operators are placed within the query graph to correct merged constraints at the output level.
This additional optimization layer enhances ChroncileDBs processing capabilities based on the nature of exploratory workflows - utilizing shared query components of branched paths and requesting the same spatio-temporal regions of a singleWavescreen. Furthermore, this design allows us to naturally share state of event processing operators. This is especially beneficial for pattern matching, which features a potentially large state that has to be build up through strictly sequential processing, limiting the ability to reuse interim results otherwise. Thus, we open up our overall system for a variety of pattern matching optimization techniques ([13]).
3
Use Cases
In this section, we demonstrate a variety of functions of Jepc in combination with the Vat
System and highlight the benefits of the proposed extensions. First, we exemplify the combined processing of flight event data fromJepcand raster data fromVat’s data repository by detect-ing flights facdetect-ing severe weather conditions. Then, we evaluate the quality of our extrapolation methods by turning this query into a prediction. Afterwards, we present the realization and visualization of pattern matching inJepcandVatin terms of starting and landing trajectories in flight events. We also discuss the benefits of multi-query optimization in this context. Fi-nally, we introduce advanced group patterns inJepcand their integration inVatby detecting neighbouring flight trajectories. For all three use cases, we use a snapshot of the freely available OpenSky Network dataset. The snapshot consists of 34 million flight events covering the 4th of February 2019.
3.1
Spatio-Temporal Event Enrichment
In aviation, it is of interest to investigate weather information due to its impact on the start and landing phase of aircrafts as well as routes in general, e.g., evasive maneuvers. Therefore, this use case deals with the detection of flights facing severe weather conditions. The resulting workflow combines the flight event data from ChronicleDB with two raster data sets fromVat. The first raster data set is comprised of weather data originating from Eumetsat’s Meteosat Second Generation, which provides a full scan of the hemisphere in 3 712×3 712 pixel resolution every fifteen minutes [16]. This raw data can either be displayed directly or processed into cloud information, e.g., using convolutional neural networks in a preprocessing step [9]. The second raster data set is used to identify areas with high rain rates which indicate severe weather conditions and thunderstorms. The data is available in a temporal resolution of five minutes and a spatial resolution of 1 100×900 pixels, and can be obtained from the radar network of the German weather agency (DWD)1. Different spatial and temporal resolutions are handled
automatically by theVat System such that multiple data sets can be displayed and processed together on the map of the user interface.
In order to identify flight positions near or within areas with high rain rates, we incorpo-rateVat’s visual analytics toolbox. By using a spatio-temporal join operator, we extract the weather information from the raster image for each flight event. To extract characteristics of the correlated data, the results could also be visualized in a data table or via plots (omitted due to space constraints). Finally, we use a filter operation based on user-defined thresholds to extract noteworthy events.
Figure 4: Yellow aircraft trajectories and aircrafts in severe weather conditions (red points).
0
5
10
Absolute Error
in km
linear
rotation
last known
+10 +20 +30 +40 +50
Prediction of the next X seconds.
0.0
0.5
1.0
Relative Error
Figure 5: The errors between predic-tions and observapredic-tions using different extrapolation methods.
Figure 4shows the results of this process within the user interface of theVatSystem. The layer list on the left side shows the different incorporated data sets and acts as the map legend. The time selection on the top specifies the time window of the displayed data. For this use case, the data is partitioned into ten minute intervals. The map shows an area covering Western Europe and the Atlantic Ocean. The yellow lines indicate flight trajectories, with noticeable hot spots in London and Paris. Furthermore, a big cloud band spans from the south of France to the Baltic sea. In the radar data layer, a green color indicates radar coverage and the blue to red gradient indicates the rain rate. In particular, areas with a high rain rate, which correlate to severe weather situations, are visible over Northern Germany. In this case, the red points in
Figure 4indicate the locations of aircrafts within the observed time span that experienced a high rain rate.
With the extrapolation framework described in Subsection 2.2 this query can be turned into a prediction. For this purpose, we replace layers dedicated to flight event data with extrapolation queries, resulting in a forecast of flight positions. Additionally, the radar data can be extrapolated with machine learning models [10]. A discussion of the weather data extrapolation is beyond the scope of this paper. In order to measure the accuracy of our event extrapolation, we have analyzed 2 211 flight trajectories with 218 127 segments in central Europe, spanning a time frame of 20 minutes. For a given timestampt, we predicted the aircraft position at the timestampt+X based on previous positions (2 for linear and 3 for rotational extrapolation). We then compared the extrapolated positions with the ground truth.
Figure 5 shows our results for a varying X (x-axis) from 10 to 50 seconds. On the y-axis of the upper graph, we show the mean absolute error as the deviation between the predicted position and the actual position in kilometers. The y-axis of the lower graph shows the relative error for which we have divided the absolute values by the distance traveled by the aircraft. For example, the phenomenon that helicopters move less quickly than long-haul aircraft could have led to a bias in the overall mean error. The relative error calculation takes this aspect into consideration.
Figure 6: Pattern query results that identify the tracks of starting (green) and landing (red) aircrafts.
Plane A
linear
rotation
Plane B
Figure 7: Two segment-wise illustra-tions of trajectory predicillustra-tions using linear and rotational extrapolation.
prediction points to the future. In addition, the prediction of rotations reduces the error com-pared to linear calculations. It is noteworthy that the relative error decreases with increasing predication timespan. This means that the error of the extrapolator does not increase dispro-portionately to the prediction interval.
3.2
Landing and Starting Pattern
Pattern queries, in particular, lend themselves for analyzing streams of flight data, since each aircraft continuously reports data such as velocity or altitude, which change for certain flight maneuvers. In this use case, we demonstrate how to detect starting and landing maneuvers via a complex event processing query. For starting, we identify a gradual ascent of an aircraft. This is expressed as a continuous increase in altitude and velocity before rising above 200% altitude of the first event attributed with a detected increase. Landing is detected in an analogous matter.
The visualization of the results is depicted inFigure 6which shows the area around Frankfurt airport. It features three layers based on queries running in ChronicleDB. Trajectories matching the starting pattern are shown as green lines. Results for the landing patterns are displayed as red lines. Furthermore, black lines are associated with a third query showing all flight trajectories within the configured time frame.
The use case is a prime example for the benefits of multi-query optimization. All three layers feature queries for the same data source within the same time frame. Furthermore, the pattern queries are very similar and may benefit from shared operator states. While evaluating the query on a time frame of 20 minutes, we measured a 1.6 speed up when applying our optimization techniques. With an increasing numbers of layers, this speed up also grows. This obviously improves the user experience for interactive data exploration.
For this purpose, we analyzed landing trajectories. In Figure 7, we have plotted the ground truth trajectories (black) for two planes A and B against the extrapolated linear (blue) and rotational (orange) trajectories respectively. Clearly, the rotational extrapolation better cap-tures non-linear flight movements, e.g. for Plane B the mean absolute error is reduced by 0.18 km. Therefore, it is important to use expert knowledge to choose the right method for different problem settings. The synergy of integrating Jepc into Vat facilitates this in an interactive manner: Not only doesVat gain the ability to work with events, but through visualization in
Vat, it is also possible to set the parameters appropriately in pattern and extrapolation queries.
3.3
Detection of Group Movements
For the third use case, we use a group pattern query to detect potential threats on the route of a flight. In aviation, there must be a considerably large distance between aircrafts (e.g., at least 300mvertically, 5.4kmhorizontally in Germany2). Hence, we are searching for aircrafts
flying on similar routes with a distance below those thresholds. More specifically, we search for a group of two or more aircrafts, moving within a horizontal distance below 5.4km and a vertical distance below 300mfor at least 10 minutes.
In order to detect groups, we utilize spatio-temporal group pattern queries. Those queries originate from moving object databases [14]. So far, they have received little attention in the streaming context. While there exist specialized solutions for certain movement patterns [20, 8], a general approach has not yet been presented in literature. In Jepc, we adopted the operators presented by Sakr et al. [14] to a streaming scenario, and thus, support a wide variety of movement patterns. In this use case we present the cross-pattern operator, which allows to relate moving objects to each other. The operator transforms the incoming event stream into a temporal graph by applying a user-defined predicate to pairs of moving objects (e.g., distance below a threshold). The vertices of the graph represent the objects and an edge between two vertices states that the predicate evaluated to true. Edges remain valid until the predicate evaluates to false. Groups are identified by scanning for sub-graphs of a specific type (e.g., clique or connected component). For example, a group of objects that move closely together is detected by scanning for cliques in a graph derived from a distance predicate. Since the membership status of objects may change, the development of groups over time needs to be monitored. This is done by tracking changes in the graph (edge additions/removals) and analyzing their impact on the detected sub-graphs. To offer fine-grained control over group detection, users can specify several additional parameters like the minimum group size or the minimum duration a group must exist before it is reported.
The results of the pattern query are depicted inFigure 8. The user interface shows the area around Bruxelles and a single layer containing flight trajectories for a time frame of the last 20 minutes. Trajectories of aircrafts that violated the minimum distance regulation are shown in blue, while grey trajectories show flights with a sufficiently large distance to each other. In this case, the query returns a single group of two US Air Force Black Hawk helicopters moving from Chi`evres Air Base, Belgium to Ramstein Air Base, Germany. This again highlights the benefits of combiningVatwith event processing: complex coherences are visualized in an intuitive way and can be further investigated in an interactive manner. Furthermore, just like in the first use case, we can utilize the extrapolation framework to predict distance constraint violations, and thus increase aviation safety due to early warnings.
Figure 8: Blue trajectories highlight a group of adjacent aircrafts.
4
Conclusion
We showcased the potential of coupling a visual spatial analytics platform with a database for managing massive event streams as provided by the OpenSky Network. Furthermore, we discussed our first results for a generic event processing extrapolation framework and multi-query optimization in the context of visual analytics. For the example of CEP-style pattern and spatial group pattern queries on high volume aircraft event data, we developed three use cases that highlight the strength of the combined system and the newly developed components. For future work, we intend to increase the synergy between both components even further by feeding more complex data (e.g., raster data) back into Jepc and by improving visual live stream support inVat(e.g., via specialized notifications inWave). Furthermore, we intend to develop more complex use cases for aircraft data based on our preliminary results on correlation with weather data. To further improve performance, we also want to explore the benefits of coprocessors for CEP-style query processing [11].
5
Acknowledgments
This work has been performed in the context of the LOEWE centre emergenCITY. The re-search is partially funded by the Hessen State Ministry for Higher Education, Rere-search and the Arts, Germany, as part of the LOEWE priority project Nature 4.0 – Sensing Biodiversity. Fur-thermore, this work is partially funded by the Deutsche Forschungsgemeinschaft (DFG) under grant numbers SE 553/7-3 and SE 553/9-1.
References
[1] G. Andrienko, N. Andrienko, G. Fuchs, and J. M. C. Garcia. Clustering trajectories by rele-vant parts for air traffic analysis. IEEE Transactions on Visualization and Computer Graphics, 24(1):34–44, Jan 2018.
[3] Christian Beilschmidt, Johannes Dr¨onner, Nikolaus Glombiewski, Christian Heigele, Jana Holzni-genkemper, Anna Isenberg, Michael K¨orber, Michael Mattig, Andreas Morgen, and Bernhard Seeger. Pretty fly for a VAT GUI: visualizing event patterns for flight data. InDEBS 2019, pages 224–227. ACM, 2019.
[4] Christian Beilschmidt, Johannes Dr¨onner, Michael Mattig, Marco Schmidt, Christian Authmann, Aidin Niamir, Thomas Hickler, and Bernhard Seeger. Interactive Data Exploration for Geoscience. InBTW 2017, volume P-266, pages 117–126, Bonn, Germany, 2017. Gesellschaft f¨ur Informatik e.V.
[5] Christian Beilschmidt, Johannes Dr¨onner, Michael Mattig, Marco Schmidt, Christian Authmann, Aidin Niamir, Thomas Hickler, and Bernhard Seeger. VAT: A Scientific Toolbox for Interactive Geodata Exploration. Datenbank-Spektrum, 17(3):233–243, 2017.
[6] Christian Beilschmidt, Johannes Dr¨onner, Michael Mattig, and Bernhard Seeger. VAT: A System for Data-Driven Biodiversity Research. InEDBT 2017, pages 546–549, Konstanz, Germany, 2017. [7] Christian Beilschmidt, Thomas Fober, Michael Mattig, and Bernhard Seeger. An Efficient
Aggre-gation and Overlap Removal Algorithm for Circle Maps. GeoInformatica, , 2019.
[8] Lu Chen, Yunjun Gao, Ziquan Fang, Xiaoye Miao, Christian S. Jensen, and Chenjuan Guo. Real-time distributed co-movement pattern detection on streaming trajectories. PVLDB, 12(10):1208– 1220, 2019.
[9] Johannes Dr¨onner, Nikolaus Korfhage, Sebastian Egli, Markus M¨uhling, Boris Thies, J¨org Bendix, Bernd Freisleben, and Bernhard Seeger. Fast cloud segmentation using convolutional neural net-works. Remote Sensing, 10(11):1782, 2018.
[10] Seongchan Kim, Seungkyun Hong, Minsu Joh, and Sa-Kwang Song. Deeprain: Convlstm network for precipitation prediction using multichannel radar data. CoRR, abs/1711.02316, 2017. [11] Michael K¨orber, Jakob Eckstein, Nikolaus Glombiewski, and Bernhard Seeger. Event stream
processing on heterogeneous system architecture. InDaMoN 2019, pages 3:1–3:10, 2019.
[12] Michael K¨orber, Nikolaus Glombiewski, and Bernhard Seeger. Tpstream: Low-latency temporal pattern matching on event streams. InEDBT 2018, pages 313–324, 2018.
[13] Medhabi Ray, Chuan Lei, and Elke A. Rundensteiner. Scalable pattern sharing on event streams. InSIGMOD ’16, pages 495–510, New York, NY, USA, 2016. ACM.
[14] Mahmoud Attia Sakr and Ralf Hartmut G¨uting. Group spatiotemporal pattern queries. GeoIn-formatica, 18(4):699–746, 2014.
[15] Matthias Sch¨afer, Martin Strohmeier, Vincent Lenders, Ivan Martinovic, and Matthias Wilhelm. Bringing up opensky: a large-scale ADS-B sensor network for research. InIPSN’14, pages 83–94, 2014.
[16] Johannes Schmetz, Paolo Pili, Stephen Tjemkes, Dieter Just, Jochen Kerkmann, Sergio Rota, and Alain Ratier. An introduction to Meteosat Second Generation (MSG). Bulletin of the American Meteorological Society, 83(7):977–992, 2002.
[17] Marc Seidemann, Nikolaus Glombiewski, Michael K¨orber, and Bernhard Seeger. Chronicledb: A high-performance event store.ACM Trans. Database Syst., 44(4):13:1–13:45, October 2019. [18] Marc Seidemann and Bernhard Seeger. Chronicledb: A high-performance event store. InEDBT
201, pages 144–155, 2017.
[19] Z. Shi, M. Xu, Q. Pan, B. Yan, and H. Zhang. Lstm-based flight trajectory prediction. In2018 International Joint Conference on Neural Networks (IJCNN), pages 1–8, July 2018.
[20] Lu An Tang, Yu Zheng, Jing Yuan, Jiawei Han, Alice Leung, Chih-Chieh Hung, and Wen-Chih Peng. On discovery of traveling companions from streaming trajectories. In ICDE 2012, pages 186–197, 2012.