Enhancement Of Operational Excellence In
Construction Equipment By Using Overall Equipment
Effectiveness
Mr. Nilesh S. Ayane
Student ofMaster of Production Engg & Technology. Mechanical Engg.dept. PRMIT&R Badnera
PRMIT&R Badnera, Amravati University Amravati, India
nilesh_ayane02@yahoo.co.in
Prof.
Mangesh V. Gudadhe
Associate Prof, Mechanical Engineering dept. PRMIT&R Badnera
PRMIT&R Badnera, Amravati University Amravati, India.
mangeshgudadhe@yahoo.com
Abstract— the objective of this paper is to improve the efficiency, productivity, availability and minimize the downtime of the existing plant and equipments which plays major role in Infrastructure and construction projects. An optimum utilization of the resources, available man, machine and material results in to maximum efficiency and productivity of the equipments. It will also reduce overall production cost of aggregate, concrete, asphalt and wet mix macadam and increase overall productivity of
industry. This research collected the past 4 month’s data of
crusher & asphalt plant and operational machineries and analyzed the problem which affects the productivity & utility of plant & Machineries and applied few Operational Excellence techniques i.e. Asset productivity & Overall Equipment effectiveness to overcome these problems.
Keywords—Operational Excellence; Overall Equipment effectiveness; Availability, Performance and Quality Losses;
I. INTRODUCTION
Running a construction business these days is challenging. The fiscal and regulatory environment is constantly changing and not always in favour of businesses. This is true for both Owners of capital projects (Developers and Owner/Operators) and Engineering, Procurement, Construction (EPC) contractors. Managing a profitable business is no longer only about having a healthy order book and managing cash flows within projects. To survive and grow in this environment, businesses have to achieve operational excellence that removes waste across the entire construction supply chain and become lean. This paper addresses the process and technology alignment needed for achieving operational excellence and for emerging stronger in these turbulent times. The management of heavy construction equipment is a difficult task. The equipment manager is called also upon to serve as leader, resource manager, accountant, engineer, arbitrator and policy maker.
also be able to forecast internal rental rates for their machinery. Repair and maintenance expenditures can have significant impacts on these economic decisions and forecasts. Operational excellence is not just a matter of cost reduction and quality improvement, but also being smart about how to handle people and resources. It requires solid change management capability and strong leadership to become operational excellence.
II. EASE OF USE
A. Definition of Operation Excellence
Operational excellence (OE) is a critical driver for business success and a key part of our enterprise execution strategy. Operational excellence is defined as “the systematic management of process safety, personal safety and health, environment, reliability and efficiency to achieve world-class performance”.
Operational discipline means completing every task, the right way, every time. It is achieved through leaders who in still operational discipline and a workforce that complies with OE requirements. Leaders set expectations and monitor and shape behaviors. The entire workforce, including leaders, recognizes hazards and follows procedures, management of change and stop work authority appropriately.
Operational Excellence (OE) is an integrated management system developed by Infrastructure & Project Management industry that drives business productivity by applying proven practices and procedures in three “Techniques” –Asset Productivity, Overall Equipment Effectiveness and Operations Risk Management. Out of which only Overall equipment Effectiveness will be discussed here.
by focusing on the levers that enhance flexibility and speed to market, quality and reliability, and customer value. However, operational excellence is not simply about doing the same things better. It stems from the way the business is set up or structured and how the work is executed on a day-to-day basis to leverage what the company does best. In addition, operational excellence is a journey, not a destination: companies must revisit decisions about structure and execution regularly to achieve the flexibility and leanness needed to respond to a changing business environment.
B. Overall Equipment Effectiveness (OEE)
It is a hierarchy of metrics developed by Seiichi Nakajima in the 1960s to evaluate how effectively a manufacturing operation is utilized. It is based on the Harrington Emerson way of thinking regarding labor efficiency.
OEE is a result can be expressed as the ration of the actual output of the equipment divided by the maximum output of the equipment under the best performance condition. The Overall Equipment Effectiveness was originated from the Total Productive Maintenance (TPM) practices, developed by S. Nakajima at the Japan Institute of Plant Maintenance, the aims of TPM is to achieve the ideal performance and achieve the Zero loss which means no production scrap or defect, no breakdown, no accident, no waste in the process running or changeover. The quantification of these accumulations of waste in time and its comparison to the total available time can give the production and the maintenance management a general view of the actual performance of the plant and it can help them to focus the improvement on the bigger loss.
The only way to achieve this is to measure. The starting point for improvement is to calculate and find out the key indicators, defined as Key Performances Indicators (KPI) of your production process. By being equipped with real information is it possible to understand where the inefficiencies are and implement the right actions to remove them.
The OEE analysis starts a Plant Operating Time assessment; this value indicates the amount of time your plant or machine is available for production runs. This is usually expressed in Work Shifts. All non-production run time events, such as coffee and lunch breaks, scheduled maintenance, vacations and unplanned production periods, are subtracted from the Plant Operating Time total. The remaining time will indicate how much Planned Production Time you will have at your disposal. The OEE then starts calculating the Planned Production Time that the machines need for production runs and monitors production lost
due to unplanned downtime events based on production speed or rejects, with the aim to pinpoint and remove the causes of inefficiency.
Improving equipment effectiveness, this mean looking into the six big losses which divided from three main losses:
a. Down time losses: classified as Equipment breakdowns and, Setup and adjustment slowdowns.
b. Speed losses: which can be found as Idling and short-term stoppages and Startup/restart losses.
c. Defects or Quality losses: everything about Scrap and rework and Startup losses
And finding what causes these losses and starts the improvements process. The idea is to make the equipment work as it should be working always and produce as much as it supposed to produce; you cannot accept that you producing less than anyone else has the same equipment and you should always seek for the best performance at all.
d. Involving operators in daily maintenance, this means to achieve autonomous maintenance where the workers who operate the equipment are allowed to take responsibility for some of maintenance activities.
Repair level: Here the operators take the action to repair the machine according to given structure paper.
Preventive level: the operator will take a corrective action to prevent the problems.
Improvement level: the operator will be uncharged in any improvement strategy; moreover he will take the corrective action too on the problems when occurred.
e. Improving maintenance efficiency and effectiveness, this mean having a systematic approach to all maintenance activities. This involves the identification of the nature and level of preventive maintenance required for each piece of equipment, the creation of standards for condition-based maintenance, and the setting of respective responsibilities for operating and maintenance staff. The respective roles of "operating" and "maintenance" staff are seen as being distinct. Maintenance staff are seen as developing preventive actions and general breakdown services, whereas operating staff take on the "ownership" of the facilities and their general care. Maintenance staffs typically move for more facilitating and supporting role where they are responsible for the training of operators, problem diagnosis, and devising and assessing maintenance practice.
adjustments, and other preventive tasks, training involves teaching operators how to do those inspections and how to work with maintenance in a partnership.
g. Designing and managing equipment for maintenance prevention. Equipment is costly and should be viewed as a productive asset for its entire life. Designing equipment that is easier to operate and maintain than previous designs is a fundamental part of TPM. Suggestions from operators and maintenance technicians help engineers design, specify, and procure more effective equipment. By evaluating the costs of operating and maintaining the new equipment throughout its life cycle, long-term costs will be minimized. Low purchase prices do not necessarily mean low life-cycle costs.
C. Six Big Losses
One of the major goals of TPM and OEE is to reduce or eliminate what are called the six big losses which they are the most common causes of efficiency loss in manufacturing. The link of the losses and the effectiveness in TPM is defined in terms of both the quality of the product and the equipment availability. Any operation time may face losses and these losses can be visible like scrap, changeovers and breakdowns or invisibles such as the slow running, the frequent adjustment to maintain the production within tolerance, Nakajima summarized the loss in a six big losses as following
Downtime Losses:
It found if the output is zero and the system produces nothing, where the unused segments of time, during the examined period are downtime losses, and mainly it can be one of two:
1. Breakdown losses this loss is due to parts failure where they cannot work anymore and they need either repair or replace. These losses are measured by how long it takes from labour or parts for fixing the problem.
2. Setup and adjustment time, These losses are due to the changes in the operating conditions, like the start of the production or the start of the different shifts, changes in products and condition of the operation. The main examples of this kind of losses are equipments changeovers, exchange of dies, jigs and tools. These losses consist of setup, start-up and adjustment down times.
Speed Losses:
When the output is smaller than the output at references speed these are called speed losses. When considering speed losses, one dose not check if the output conforms to quality specifications. This can be found in two forms: Minor stoppage losses these losses are due to the reason of machine halting,
jamming, and idling. Many companies are considering these minor stoppages as the breakdowns in order to give importance to this problem.
Speed losses these losses are due to the reduction in speed of the equipment. In other words the machine is not working at the original or theoretical speed. If the quality defect and minor stoppages occurs regularly then the machine is run at low speed to cover the problems. It is measure by comparing the theoretical to actual working load.
Defect or quality losses:
The produced output either dose or dose not confirm to quality specifications. If it does not comply, this is consider a quality loss.
1. Rework and quality defects; these losses are due to the defective products during the routine production. These products are not according to the specifications. So that rework is done to remove the defects or make a scrap of these products. Labor is required to make a rework which is the cost for the company and material become a scrap is also another loss for the company. The amount of these losses is calculated by the ratio of the quality products to the total production.
2. Yield losses these losses; are due to wasted raw materials .The yield losses are split into two groups. The first one is the raw materials losses which are due to the product design, manufacturing method etc. The other group is the adjustment losses due to the quality defects of the products which are produced at the start of the production process, changeovers etc.
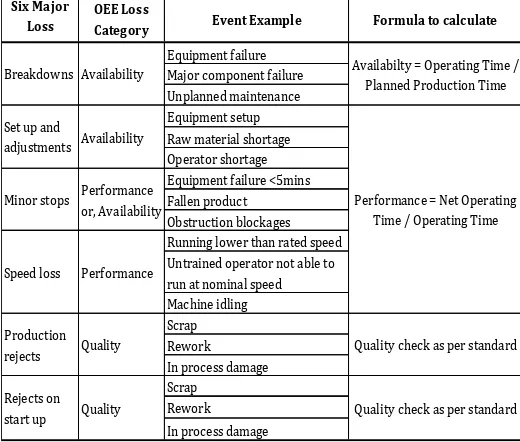
Table 1. Six Major Losses Addressed By OEE
III. OEECALCULATION
OEE is equal to the multiplication of the three main bases for the main six big losses:
Six Major Loss Category
OEE Loss
Category Event Example Formula to calculate
Equipment failure Major component failure Unplanned maintenance Equipment setup Raw material shortage Operator shortage Equipment failure <5mins Fallen product Obstruction blockages Running lower than rated speed Untrained operator not able to run at nominal speed Machine idling Scrap Rework In process damage Scrap
Rework In process damage
Quality check as per standard
Quality check as per standard Quality
Quality Breakdowns
Set up and adjustments
Minor stops
Speed loss
Production rejects
Rejects on start up
Availabilty = Operating Time / Planned Production Time
Performance = Net Operating Time / Operating Time Availability
Availability
Performance or, Availability
1. Availability indicates the problem which caused by downtime losses.
2. Performance indicates the losses caused by speed losses and 3. Quality indicates the scrap and rework losses.
OEE = Availability x Performance rate x Quality (1)
a. Availability: The availability is calculated as the required availability minus the downtime and then divided by the required availability. This can be written in the form of formula as
Availability = ((Required availability – Downtime)/
Required availability)* 100 (2)
The required availability can be defined as the time of production to operate the equipment minus the other planned downtime like breaks, meetings etc. The downtime can be defined as the actual time for which the equipment is down for repairs or changeovers. This time is also sometimes known as the breakdown time. The output of this formula gives the true availability of the equipment. This value is used also in the overall equipment effectiveness formula to measure the effectiveness of the equipment.
b. Performance : The performance rate can be defined as the ideal or design cycle time to produce the item multiplied by the output of the equipment and then divided by the operating time. This will give the performance rate of the equipment. The formula to calculate the performance rate can be expressed as
Performance rate = ((design cycle time * output)/
Operating time)* 100 (3)
The design cycle time or the production output will be in the unit of production, like parts per hour and the output will be the total output in the given time period interval.
The operating time will be the availability value of the availability formula. The result of this formula will be in the percentage of the performance of the equipment
c. Quality: The quality rate can be expressed as the productioninput into the process or equipment minus the volume ornumber of quality defects then divided by the production input. The quality rate can be expressed in a formula as
Quality rate = ((production input – quality defects)/
Production input)* 100 (4)
The production input mean that the unit of product being feed into the production process. The quality defects mean the amount of products which are below the quality standards i.e. the rejected items after the production process. This formula is very helpful to calculate the quality problems in the production process.
What is OEE for.?
OEE provides simple and consolidated formulas to measure effectiveness of the equipment or production system. Moreover it point out that it can also be used as an indicator of process improvement activities since OEE is directly linked to the losses as well as OEE can be even used to compare performance across the factory highlighting poor line performance or to quantify improvements made.
World Class OEE
As each company has different the OEE value to reach will also differ accordingly. Consider, for example, that if the value of all three KPI factors were 90%. This would seem to be an optimal result but the real OEE result would be 72%! According to experience shared by many companies, an OEE value is considered a lean and efficient production example and a target reference (World Class) if it reaches 85%. This OEE value would be obtained with the example KPI values shown in the table below:
Case Study
This case study is subjected to the operational excellence (OE) of plant and equipments of road construction project i.e. Crusher plant and other production related equipments. To achieve the OE not only the technical parameters but also project management and operational activities are important which helps in co-ordination and execution of the project. Due to improper report formats, it was unable to co-ordinate and follow up with respective departments for required machine, spares and manpower.
With reference to the data collection and analysis done for operation and production cost of aggregate and asphalt mix
KPI World Class
Availability 90.00%
Performance 95.00%
Quality 99.90%
from crusher and asphalt plant for the period 4 months, following challenges has been observed:
1. Maximum Idle Hours & breakdown down hours, Minimum availability of plant and equipments.
2. Higher Fuel, Spare & Lubricant Consumptions than that of standard norms.
3. Minimum Utilization of Plant & Equipment.
4. Refilling of fuel in last days of month due to which, fuel will be available in tank and hence the fuel consumption of equipment reflects at higher side.
5. Maintenance was not carried out as per manufacturer’s
schedule.
6. Maximum cost repair
7. Higher consumption of spares which results into higher Production Cost
8. Improper coordination of Purchase Team and plant & Machinery Team which results in delay in spares availability.
9. Delay in decision making for whether the equipment shall be repaired in house or shall be repaired externally due to lack of manpower.
10. Unavailability of additional supporting equipment at time of requirement and replacement of breakdown equipment.
Crusher Plant Overall Report for 4 Months - Before OE Technique Implementation
The above challenges need to overcome to achieve the Operational excellence. We have organised the internal meeting with all concern managers of respective departments at project site and summarised the “Factors Affecting the Productivity & Availability of Crusher” by considering various types of criteria. We have analysed the reasons for those factors and also proposed remedies for each factor and reason. According to them we understood the major concern reasons of less
productivity as well as utility which are affecting the production cost to company.
We have prepared some reports formats which will be signed & send by In-charge of respective dept. to all Head office coordinators of the project.
Daily Breakdown & Diesel Consumption report Daily & Monthly Production report
Monthly production cost report.;
Crusher Plant Overall Report for 4 Months – after OE technique Implementation
Result & Discussion
We found that operational excellence is strongly connected with the operational levels. Implementation of lean or Six Sigma predominantly changes the business processes at the operational level and is better known as business process redesign which is part of business process management. By modeling the business processes at operational level, process analysis can root out the non-value-adding steps and find points of improvement. Six Sigma for instance is used to analysis the current processes and eliminate issues within those processes. As such, operational excellence is aimed at improving a firm's value activities (those activities that add value to a product and are technologically and strategically distinct) within its value chain (Kippenberger, 1997). As described within the business model literature, a value chain is a set of activities within a company that, if taken together, create a product or service (Porter, 1985). In that respect, it becomes part of the extended activity system as described by Zott and Amit (2009). While a firm's activity system is "The set of interdependent organizational activities centered on a focal firm, including those conducted by the focal firm, its partners, vendors or Equip
Code Equipment Description
Worked Hour
Total % Availability
Total % Utilization
Actual consumption
Lt/Hr Total Cost
of Repair (INR)
Total Operating Cost / Hr
Total Production
(MT) Production
Cost Rs/MT
291 Front End Loader 724 92.57 27.16 8.63 112,666 155.6
1220 Dumper -25 Ton 643 90.07 24.79 7.59 111,020 172.7
1222 Dumper -25 Ton 783 98.06 27.73 6.99 117,981 150.7
1229 Dumper -25 Ton 725 87.40 28.80 7.67 135,882 187.4
1370 Crusher Plant
-200 TPH 1,029 82.12 43.51 - 5,432,522 5,279.4
20325Excavator 1 Cu.m 1,469 100.00 51.01 13.46 167,618 114.1
175,531 34.6
Equip Code
Equipment Description
Worked Hour
Total % Availability
Total % Utilization
Total Cost of Repair (INR)
Total Operating Cost / Hr
Total Production
(MT)
Production Cost Rs/MT
291 Front End Loader 244 83.89 40.40 69,454 285
1119 Dumper - 25 Ton 971 98.51 34.23 73,009 75
1220 Dumper - 25 Ton 854 94.17 31.49 123,505 145
1222 Dumper - 25 Ton 1023 100.00 35.52 76,890 75
6646 Dumper - 25 Ton 1360 99.65 47.39 68,511 50
1370 Crusher Plant -200 TPH 1706 95.90 61.77 5,790,511 3,394 20325 Excavator 1 Cu.m 1,904.0 75.00 88.15 145,049 76
customers, etc.." the value chain is limited to the set of activities within the focal firm (Zott & Amit, 2009). In that regard, operational excellence as operational tool is what binds a firm's business process management together with its value chain as part of the broader concept business model.
Graph for availability % of crusher and equipment integrated with its system
Graph for utilization % crusher and equipment integrated with its system
Graph for monthly production of crusher plant (MT) with the help of equipment integrated with its system
The above graph clearly indicates the effect on equipment availability %, Utility % and Productivity in Crusher system after implementation on Operational Excellence techniques in project.
The purpose of present work was to analyze the performance, efficiency, productivity of Major plants like Crusher plant used in infrastructure industry. Through there are various method of assessing performance, in the study we have implemented the concept of operational excellence for testing the performance. From the above performance analysis, it is observed that, before conducting the experimentation on existing plant and equipments, the ideal capacity and production rate of plant were less and machine did not perform as its optimum level. After end of the experimentation it is concluded that important parameters that influence the production rate and energy consumption for a production are the breakdown of Plant and equipments, shortfall of power supply, tippers, manpower, raw material (Boulders), Moisture content in Aggregate. Power consumption increased with increase in moisture contents in aggregate; however, there was also decrease in production output.
A. Authors and Affiliations
1) Author 1- Mr. Nilesh S. Ayane (Student- M.E. Production Engineering & Technology )
Mechanical Engineering. Dept. PRMIT&R Badnera PRMIT&R Badnera, Amravati University
Amravati, India
E-Mail Id- nilesh_ayane02@yahoo.co.in
2) Author 2 - Mr. Mangesh V. Gudadhe (Associate Prof.) Mechanical Engineering Dept. PRMIT&R Badnera PRMIT&R Badnera, Amravati University
Amravati, India.
E-Mail Id- mangeshgudadhe@yahoo.com Availab
ility % Before OE
Availab ility % Then
Utiliz ation % Befor e OE Utiliz ation % Then
Aggrega te Prodctio n Before OE (Ton)
Acknowledgment
I have taken efforts in this project. However, it would not have been possible without the kind support and help of many individuals and organizations. I would like to extend my sincere thanks to all of them.
I am highly indebted to Mr. Ganesan (DGM – Project) in Afcons Infrastructure Ltd. for their guidance and constant supervision as well as for providing necessary information regarding the project & also for their support in completing the project.
I would like to express my gratitude towards my parents & member of AFCONS and my project Guide Mr. Mangesh V. Gudadhe (Asso. Prof. - Mechanical Engineering. Dept. PRMIT&R Badnera) for their kind co-operation and encouragement which help me in completion of this project. My thanks and appreciations also go to my colleague in developing the project and people who have willingly helped me out with their abilities.
References
[1] Ahuja, I.P.S. and Khamba, J.S. 2008. Total productive
maintenance: Literature review and directions. International journal of quality & reliability management. London, UK : Emerald group publishing limited, 2008. Vol. 25, 7. ISSN: 0265-671X.
[2] Raffaele Iannone and Maria Elena Nenn - Managing OEE to
Optimize Factory Performance.
[3] Nakajima, S. Introduction to TPM: Total Productive
Maintenance. Productivity Press; (1988)
[4] Cost Reference Guide for Construction Equipment. (1996). K-III Directory Corporation, San Jose, CA.
[5] Orjan Ljungberg, 1998 “Measurement of Overall Equipment
Effectiveness as a basis for TPM activities”, International Journal of Operations & Production Management, Vol 18 No.5, pp 495- 507.
[6] E79-98 Guideline for the Definition and Measurements of Overall
Equipment Effec‐ tiveness: proceedings of Advanced
Semiconductor Manufacturing Conference and Workshop,